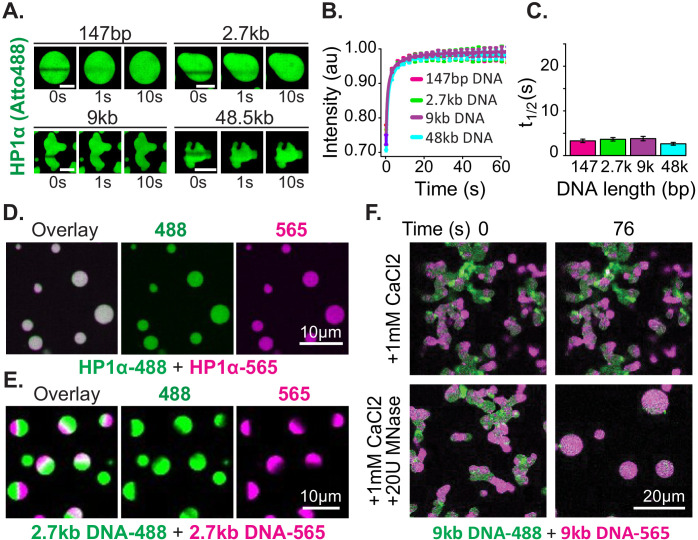
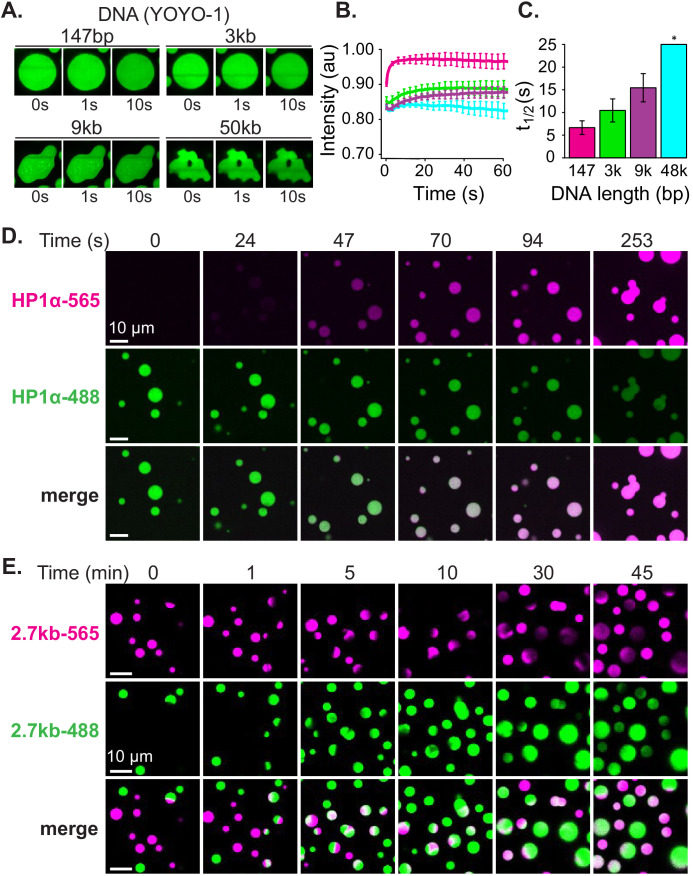
Figure 3. Distinct characteristics of HP1α and DNA in condensates.
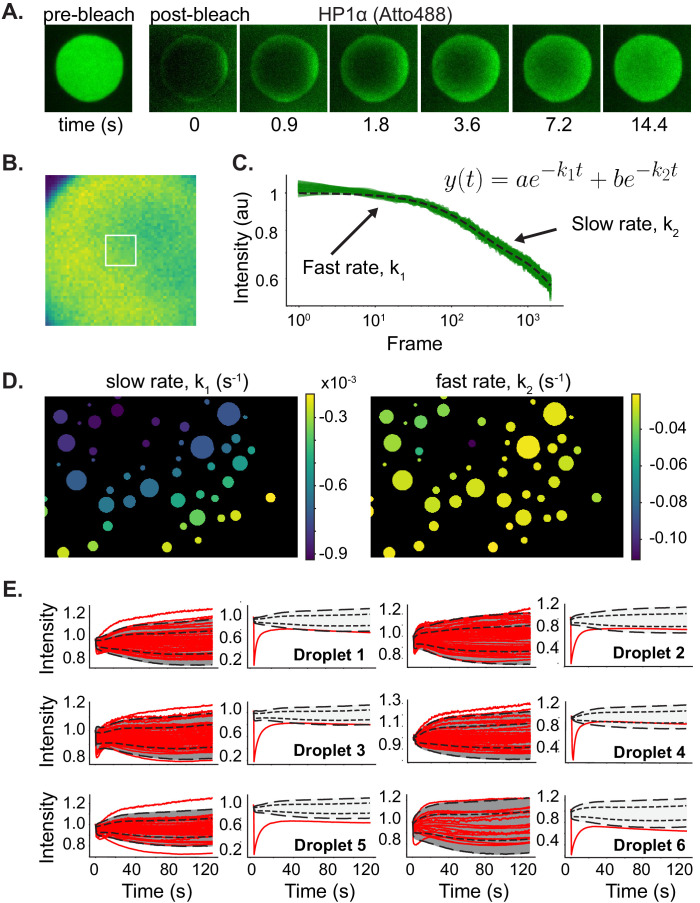
(A) FRAP of HP1α in condensates. Timestamped images from FRAP experiments for fluorescent HP1α and four lengths of linear DNA (147 bp, 2.7 kbp, 9 kbp, or 50 kbp). Scale bar indicates 5 μm. (B) Recovery of HP1α fluorescence intensity and (C) half-life of HP1α recovery plotted for each DNA length tested. N = 15 for each condition, error bars represent standard deviations. (D) Two-color HP1α mixing experiments. Condensates formed separately with 2.7 kbp unlabeled DNA and either HP1α−488 (green) or HP1α−565 (magenta) imaged 1.16 min after mixing. (E) Two-color DNA mixing experiments. Condensates formed separately with unlabeled HP1α and 2.7 kbp DNA-488 (green) or 2.7 kbp DNA-565 (magenta) imaged 4.4 min after mixing. (F) MNase treatment of condensates. Mixed condensates formed separately with unlabeled HP1α and 9 kbp DNA-488 (green) or 9 kbp DNA-565 (magenta) treated with either 1 mM CaCl2 or 1 mM CaCl2 and 20U MNase. Images shown for both conditions before and 76 s after the treatment.


