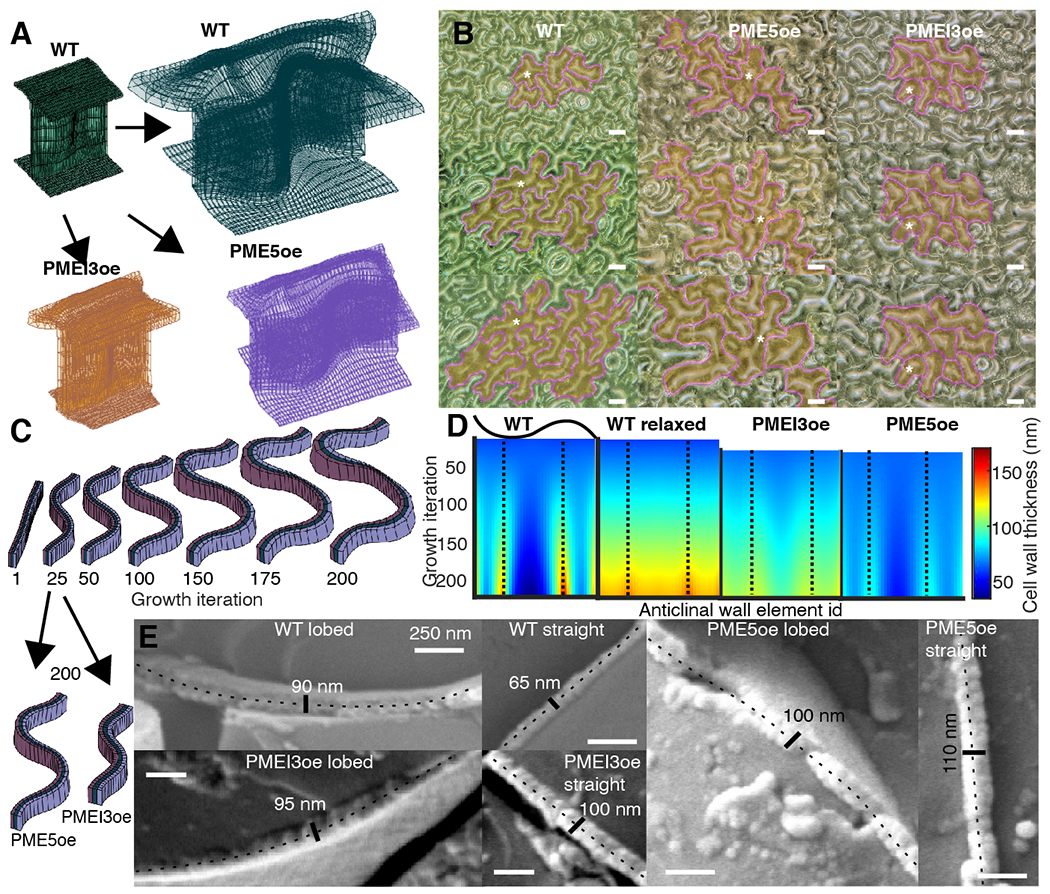
Fig. 3. The expanding beam model of pavement cell shape.

(A) Finite element method implementation of the model in WT (green), PME5oe (violet) and PMEI3oe (orange) cotyledons. (B) Digital microscope images of a time-course of WT, PME5oe and PMEI3oe cotyledons at 1, 2, and 3-days post-germination. Tracked cells are highlighted in yellow with magenta contours; white stars, selected tracked cells. (C) Single element-high cross-section of the anticlinal wall at selected iteration steps showing the development of lobes and the cell wall thickness. Black arrows point from the 25th iteration (the start of PME5oe/PMEI3oe induction) to the 200th iteration. (D) A spatiotemporal heat map of cell wall thickness output from the computational model, obtained using a single element-height middle segment of the anticlinal wall. Each color represents the wall thickness at a particular local portion or segment of the wall used in the model, termed an anticlinal wall element (X-axis), for any given growth iteration of the model (Y-axis). The wall begins with uniform thickness (Iteration 0 at the top of each image) that increases in variability between elements with increasing iterations. Dashed lines represent the center of the lobes. The WT relaxed corresponds to stress-free incompatible growth state, before elastic transformation is applied (fig. S7B). (E) CryoSEM images of cryo-fractured lobed and straight walls in WT, PME5oe and PMEI3oe cotyledons. In each image, the fractured anticlinal wall is labelled with a dotted line together with the measured thickness. Scale bars, 250 nm.
