

Abstract
Mesenchymal stem cells (MSCs) were shown to have potential therapeutic effects for treatment of liver fibrosis, and dysregulated expression of microRNAs (miRNAs) played a pivotal role in the pathogenesis of liver fibrosis by regulating their downstream target genes. However, the mechanism by which MSCs affect the progression of liver fibrosis by regulating miRNA expression remains unclear. Here, we investigated whether human umbilical cord MSCs (HUC-MSCs) attenuated hepatic fibrosis by regulating miR-455-3p and its target gene. Significantly upregulated miRNA (miR-455-3p) was screened out by GEO datasets analysis and coculture HUC-MSCs with hepatic stellate cell (HSC) LX-2 cells. p21-activated kinase-2 (PAK2) was forecasted to be the target gene of miR-455-3p by bioinformatics analyses and confirmed by luciferase reporter assay. HUC-MSCs were transplanted into mice with carbon tetrachloride- (CCl4-) induced liver fibrosis, the result showed that HUC-MSC transplantation significantly ameliorated the severity of CCl4-induced liver fibrosis, attenuated collagen deposition, improved liver function by reducing the expression of alanine aminotransferase (ALT) and aspartate aminotransferase (AST) in serum, upregulated miR-455-3p, and suppressed PAK2 expression of liver tissue in mice. Taken together, our study suggests that HUC-MSCs inhibit the activation of HSCs and mouse CCl4-induced liver fibrosis by upregulation of miR-455-3p through targeting PAK2.
1. Introduction
Liver fibrosis and cirrhosis are common pathological processes of many chronic liver diseases, including chronic hepatitis B and C, alcoholic steatohepatitis, nonalcoholic steatohepatitis, and autoimmune hepatitis, which can eventually lead to liver failure or liver cancer. Hepatic stellate cells (HSCs) are widely accepted to be the fibrogenic cell type in the liver [1]. The characteristic of fibrosis is accompanied by the activation and proliferation of HSCs and increased production of excessive extracellular matrix [2, 3]. Currently, there are still few strategies to reverse liver fibrosis except orthotopic liver transplantation, but organ donor shortage, complications of surgery, and immunosuppression limit its application [4]. Therefore, there is an urgent need to find a new alternative treatment strategy.
Mesenchymal stem cells (MSCs) are multipotent stem cells, which can be isolated from bone marrow, adipose tissue, umbilical cord, and other tissues [5, 6]. There have been demonstrated that MSCs have an inflammatory tendency and can homing to the injured site to play an anti-inflammatory role [7, 8]. Recently, accumulating evidences suggest that exogenous MSC treatment could ameliorate HSC activation and liver fibrosis, differentiate into hepatic cells, and promote the recovery of liver function [9, 10].
MicroRNAs (miRNAs), a class of endogenous noncoding RNAs, approximately 22 nucleotides long, function as negatively regulate protein translation by binding to the 3′ untranslated region (3′ UTR) of mRNAs of their target gene [11]. Recent studies have shown that miRNAs regulate the activation of HSCs and the progress and development of liver fibrosis. For example, miR-125b promotes activation of HSCs and liver fibrosis by activating the ras homolog gene family, member A (RhoA) signaling [12], miR-26b-5p inhibits liver fibrogenesis by targeting platelet derived growth factor receptor-β (PDGFR-β) [13], and miR-455-3p alleviates HSC activation and prevents liver fibrosis by suppressing heat shock factor 1 (HSF1) expression [14]. However, the underlying mechanisms of MSCs alleviating HSC activation by regulating miRNA expression remains unknown.
In this study, we used two miRNA profile data (GSE33857 and GSE77271) about liver fibrosis which were downloaded from publicly available GEO datasets and screened out five common differentially expressed miRNAs (DEMs) (miR-342-3p, miR-125a-5p, miR-455-3p, miR-574-5p, and miR-193a-3p) which were upregulated or downregulated in experimental animals or human liver fibrosis samples. The result was verified by quantitative real-time reverse transcription-polymerase chain reaction (qRT-PCR) in activated HSCs induced by transforming growth factor β1 (TGFβ1). Subsequently, we cocultured activated HSCs with human umbilical cord mesenchymal stem cells (HUC-MSCs) and found that miR-455-3p expression was the most significant difference compared with the HSC group cultured alone. These findings were subsequently verified in mouse models of liver fibrosis treated with HUC-MSCs. Finally, our results demonstrated that HUC-MSC treatment ameliorated liver fibrosis by upregulating miR-455-3p through suppression of p21-activated kinase-2 (PAK2).
2. Materials and Methods
2.1. Isolation, Culture, and Expansion of HUC-MSCs
HUC-MSCs were isolated as described previously [15]. Umbilical cords were donated by mothers who provided written informed consent for research purposes. The collection and isolation procedure were both approved by the Ethics Committee of Soochow University (Suzhou, China). Cells were cultured in Dulbecco's modified Eagle's medium (DMEM) supplemented with 10% fetal bovine serum (FBS) (Gibco, Grand Island, NY, USA), 1 mmol/L GlutaMAX™ (Gibco), and 100 IU/mL penicillin/streptomycin (Gibco) at 37°C in a 5% CO2-humidified atmosphere with medium changes every 2-3 days and were subcultured by using 0.25% trypsin-EDTA (Thermo Fisher Scientific, Waltham, MA, USA) upon reaching 80%-90% confluence. The ability to differentiate into osteoblasts and adipocytes and the surface antigen profile of HUC-MSCs were confirmed as previously reported [15, 16].
2.2. HSC Culture and Treatment
The human HSC line LX-2 cells were purchased from the Cell Center of Shanghai Institutes for Biological Sciences (Shanghai, China). Cells were cultured in DMEM supplemented with 10% FBS, GlutaMAX™, and 100 IU/mL penicillin/streptomycin. For activation, LX-2 cells at 70-80% confluence were starved for 24 hours in DMEM medium containing 0.2% FBS and then treated with TGFβ1 (Sigma, St. Louis, MO, USA) at a concentration of 10 ng/mL for 48 hours.
2.3. HUC-MSCs/LX-2 Cocultures
Fully activated LX-2 cells were cultured alone or cocultured with HUC-MSCs using transwell inserts (24 mm diameter, 0.4-μm pore size, Corning, NY, USA) to assess the effects of HUC-MSCs on LX-2 cells. All coculture experiments were performed with LX-2 cells in the lower chamber and HUC-MSCs in the upper compartment using DMEM medium with 10% FBS. LX-2 cells were collected after culturing for 48 hours.
2.4. Cell Proliferation Assays
The proliferation of LX-2 cells was measured using a Cell Counting Kit-8 (CCK8) assay (Dojindo Molecular Technologies, Inc., Kumamoto, Japan). In brief, LX-2 cells were seeded in the lower chamber of 6-well plate using transwell inserts at a density of 5 × 10⁴ cells per well, while in the coculture group the same number of HUC-MSCs was seeded in the upper compartment. After culturing for 48 hours, the upper department was removed, and the CCK8 reagent was added to the lower chamber containing LX-2 cells and incubated for additional 2 hours according to the manufacturer's protocol. Optical densities were measured using a microplate reader (SpectraMax M5; Molecular Devices, Sunnyvale, CA, USA) at a wavelength of 450 nm.
2.5. miR-455-3p Transfection
miR-455-3p mimics, inhibitors, and their negative controls (NC) were purchased from GenePharma (Shanghai, China). LX-2 cells were transfected with Lipofectamine™ 3000 reagent (Invitrogen, Carlsbad, CA, USA) according to the manufacturer's instructions. Then, the cells were maintained at 37°C in a humidified atmosphere containing 5% CO2 for 48 hours.
2.6. Luciferase Reporter Assay
The 3′ UTR sequence of human PAK2 that contained the putative wild-type (WT) or mutant (MUT) miR-455-3p binding site was inserted into the pGL3 luciferase vector (Promega, Madison, WI, USA). For the luciferase reporter experiments, LX-2 cells were cotransfected with the above constructed 3′ UTR luciferase vector and miR-455-3p mimics or NC using Lipofectamine™ 3000 reagent. Cells were harvested 48 hours after transfection for dual-luciferase reporter assay by a fluorescence detector (Promega). The relative firefly luciferase activity was normalized to Renilla luciferase activity.
2.7. Animal Models
Animal experiments were performed according to the guidelines of Institutional Animal Care and Use Committee of Soochow University (Suzhou, China). Male C57BL/6 mice of 8-10 weeks age were purchased from Shanghai SLAC Laboratory Animal Co., Ltd. (Shanghai, China). Liver fibrosis mice were induced by carbon tetrachloride (CCl4) (20% in olive oil, 5 μL/g) intraperitoneal administration twice a week for 12 weeks, while mice in the control group were treated with olive oil. Each experimental group contained 6 mice. Mice were divided into three groups: control group, CCl4 group, and CCl4+HUC-MSC group. CCl4+HUC-MSC group mice were injected 5 × 10⁵ HUC-MSCs in 0.3 mL phosphate-buffered saline (PBS) by the tail vein once a week at the 6th week after CCl4 administration for six times, while mice in the control and CCl4 groups were injected with only 0.3 mL PBS during the same period. At the end of the 12th week, venous blood was obtained from the retroorbital vein to measure liver serum markers. Then, all mice were sacrificed and liver lobes were obtained for further analyses.
2.8. Histology
Liver tissues were fixed in 4% paraformaldehyde and embedded in paraffin. Sections were cut at 5 μm thickness and stained with hematoxylin-eosin (H&E). Collagen deposition of sections was detected by Masson's trichrome staining and Sirius red staining using standard protocols.
2.9. Immunofluorescence and Immunohistochemistry
Immunofluorescence staining was performed to assess α-smooth muscle actin (α-SMA) and collagen 1α1 (Col1α1) on LX-2 cells as routine protocols. Briefly, LX-2 cells were seeded into 6-well plates and divided into three groups: LX-2 group, LX-2 cells cultured alone; LX-2+TGFβ1 group, LX-2 cells cultured alone and treated with TGFβ1 for activation; and LX-2+HUC-MSCs group, LX-2 cells treated with TGFβ1 and then co-cultured with HUC-MSCs. After being cultured, the cells were washed twice with PBS and then fixed with 4% paraformaldehyde and permeabilized with 0.1% Triton X-100 in PBS for 20 minutes at room temperature. After being washed with PBS, the cells were incubated with 10% goat serum in PBS for blocking nonspecific binding sites and then incubated overnight with primary antibodies specific to α-SMA (1 : 200; Abcam, Cambridge, MA, USA) or Col1α1 (1 : 200; Abcam) at 4°C. After being washed with PBS, the cells were finally incubated with Dylight 649-conjugated or Dylight 488-conjugated secondary antibody for 2 hours in the dark. After being incubated with DAPI (Beyotime, Shanghai, China) for staining nuclei, the images of cells were acquired using a fluorescence microscope (OlympusBX-53, Tokyo, Japan).
For immunofluorescence staining and immunohistochemical analysis of liver tissues, paraffin-embedded tissue sections were dewaxed in xylene and dehydrated in a series of graded alcohols; heat-induced antigen retrieval was accomplished by microwaving in citric saline for 15 minutes. The sections were further blocked in PBS plus 0.025% Tween 20 with 2% bovine serum albumin. For immunofluorescence staining, the sections were incubated with primary antibodies specific for α-SMA (1 : 200; Abcam) and PAK2 (1 : 200; Abcam), then were further incubated with Dylight 649-conjugated and Dylight 488-conjugated secondary antibody; finally, the samples were incubated with DAPI (Beyotime). For immunohistochemical analysis, after blocking, the sections were incubated with primary antibodies specific for α-SMA (1 : 200; Abcam), Col1α1 (1 : 200; Abcam), and PAK2 (1 : 100; Abcam) overnight at 4°C. After washing with PBS, the sections were incubated with horseradish peroxidase- (HRP-) conjugated secondary antibody for 1 hour at room temperature. Subsequently, the signal was visualized by 3,3′-diaminobenzidine tetrachloride, and the nuclei were counterstained with hematoxylin.
2.10. Hepatic Hydroxyproline Content
The hepatic hydroxyproline level was measured using an assay kit (Nanjing Jiancheng Bioengineering Institute, Nanjing, China), according to the manufacturer's instructions.
2.11. Quantitative Real-Time PCR
Isolation of total RNA from cultured LX-2 cells or liver tissues was conducted using Trizol reagents (Invitrogen, Carlsbad, CA, USA). cDNA was synthesized using the PrimeScript RT reagent kit (Takara, Shanghai, China). qRT-PCR was performed in triplicate using the SYBR Premix Ex Taq (Takara) on the ABI ViiA 7Dx real-time PCR system (Life Technologies, NY, USA). The expression levels of mRNA of interest and microRNA were calculated according to the comparative threshold cycle value (2−ΔΔCt) method and were normalized against β-actin or U6. All of the primers were synthesized by GENEWIZ (Suzhou, China). The primer sequences used in this study were as follows: α-SMA (human), forward: 5′-CTATGAGGGCTATGCCTTGCC-3′, reverse: 5′-GCTCAGCAGTAGTAACGAAGGA-3′; Col1α1 (human), forward: 5′-GTGCGATGACGTGATCTGTGA-3′, reverse: 5′-CGGTGGTTTCTTGGTCGGT-3′; PAK2 (human), forward: 5′-CACCCGCAGTAGTGACAGAG-3′, reverse: 5′-GGGTCAATTACAGACCGTGTG-3′; β-actin (human), forward: 5′-AGAGCTACGAGCTGCCTGAC-3′, reverse: 5′-AGCACTGTGTTGGCGTACAG-3′; α-SMA (mouse), forward: 5′-GGCACCACTGAACCCTAAGG-3′, reverse: 5′-ACAATACCAGTTGTACGTCCAGA-3′; Col1α1 (mouse), forward: 5′-CTGGCGGTTCAGGTCCAAT-3′, reverse: 5′-TTCCAGGCAATCCACGAGC-3′; PAK2 (mouse), forward: 5′-AACGGAGAGCTAGAAGACAAGC-3′, reverse: 5′-TGGAACAGAAGGCAAAGGTTT-3′; β-actin (mouse), forward: 5′-GGCTGTATTCCCCTCCATCG-3′, reverse: 5′-CCAGTTGGTAACAATGCCATGT-3′; miR-455-3p, forward: 5′-GCGCAGTCCATGGGCAT-3′, reverse: 5′-CAGTGCGTGTCGTGGAGT-3′; and U6, forward: 5′-CTCGCTTCGGCAGCACATATACT-3′, reverse: 5′-ACGCTTCACGAATTTGCGTGTC-3′.
2.12. Western Blot Analysis
Cells and liver tissues were lysed in RIPA buffer (Millipore, Billerica, MA, USA), and total proteins were extracted. The protein concentration was measured using a BCA protein assay kit (Beyotime, Nanjing, China). Proteins used for Western blot analysis were performed routinely; membranes were incubated with primary antibodies against α-SMA (1 : 1000; Abcam), Col1α1 (1 : 2000; Abcam), GAPDH (1 : 2500; Abcam), and PAK2 (1 : 2000; Abcam) overnight at 4°C. Then, HRP-conjugated goat anti-rabbit IgG (1 : 1000; Cell Signaling Technology, Beverly, MA, USA) secondary antibody was employed at 37°C for 1 hour. The immunobands were visualized using the chemiluminescence HRP substrate (Millipore). The protein expression was standardized to GAPDH and quantified using Gel-Pro Analyzer software (Media Cybernetics, Rockville, MD, USA).
2.13. Statistical Analysis
The statistical analyses were performed by using GraphPad Prism 6 (GraphPad Software Inc., San Diego, CA, USA). Experimental data are expressed as the mean ± SD. Statistical significance was determined using the two-tailed Student's t-test for the comparison of two groups. For comparison among multiple groups, one-way analysis of variance (ANOVA) was performed. A value of P < 0.05 was considered statistically different.
3. Results
3.1. HUC-MSCs Inhibit Proliferation and Activation of HSCs
To ascertain whether HUC-MSC transplantation affects the proliferation of HSCs, human HSC cell line LX-2 cells were cocultured with HUC-MSCs using a coculture transwell chamber. CCK-8 assays were performed to measure the cell proliferation of LX-2 cells. For activation, LX-2 cells were incubated with TGFβ1. The results showed that TGFβ1 treatment significantly promoted LX-2 cell proliferation, while HUC-MSCs notably reversed this effect (Figure 1(a)). To investigate whether HUC-MSCs could influence HSC activation, LX-2 cells were cultured in the absence of serum for starvation and activated with TGFβ1. The expression of α-SMA and Col1α1 (two markers of activated HSCs) mRNA and protein in TGFβ1 treatment group was highly increased, as determined by qRT-PCR, Western blot, and immunostaining analyses compared with LX-2 cultured in the absence of TGFβ1, which indicated successful activation of LX-2 cells (Figures 1(b)–1(f)). Meanwhile, coculture with HUC-MSCs for 48 hours led to an obvious downregulation of α-SMA and Col1α1 mRNA expression, as determined by qRT-PCR (Figure 1(b)), and the inhibition effect of HUC-MSCs on HSC activation was in a dose-dependent manner (Supplementary Figure 1(a) and 1(b)). The expression of α-SMA and Col1α1 was also downregulated confirmed by repeated Western blot and immunostaining analysis, suggesting that TGFβ1-mediated activation of LX-2 cells was inhibited by HUC-MSCs (Figures 1(c)–1(f)).
Figure 1.
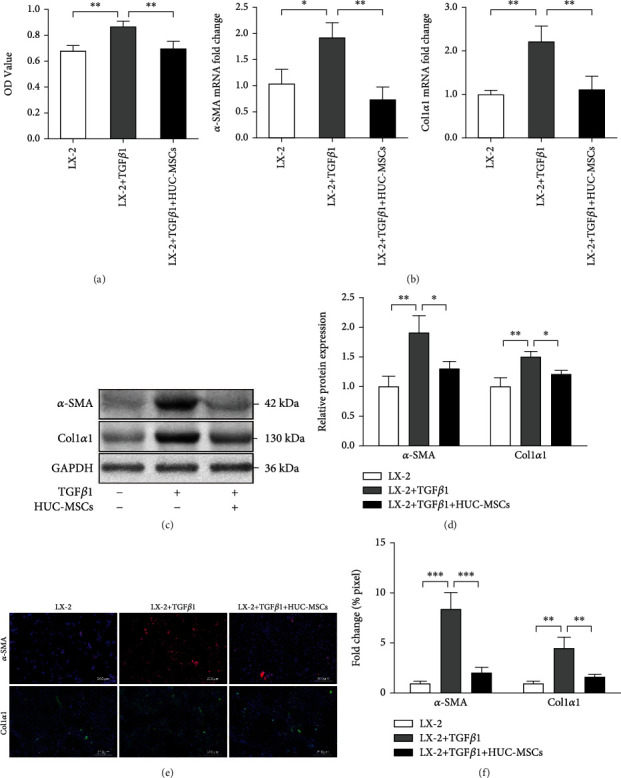
HUC-MSCs inhibit proliferation and activation of HSCs. (a) CCK8 assay analysis of HUC-MSCs on inhibition of TGFβ1-mediated proliferation in LX-2 cells. (b) The mRNA levels of α-SMA and Col1α1 were measured by qRT-PCR. (c) The protein levels of α-SMA and Col1α1 were measured by Western blot. (d) Quantitation of α-SMA and Col1α1 levels from three independent Western blot analyses. (e) Immunofluorescence images of LX-2 cells, the red fluorescence represents α-SMA, and the green fluorescence represents Col1α1. Scale bars, 200 μm. (f) Quantification of α-SMA and Col1α1 positive areas. Percentages of immunoreactive areas were expressed as relative values to those in the LX-2 group. The quantitative data are represented as the mean ± SD. Each experiment was repeated three times. ∗P < 0.05, ∗∗P < 0.01, and ∗∗∗P < 0.001.
3.2. HUC-MSCs Promote Inactivation of LX-2 Cells by Upregulating miR-455-3p
Increasing evidence demonstrated that miRNAs regulate a wide range of cellular processes, including cell proliferation, differentiation, and apoptosis. In addition, aberrant miRNA expression may associate with the development of multiple diseases, including liver fibrosis. Here, we screened out five common differentially expressed miRNAs (DEMs) (miR-342-3p, miR-125a-5p, miR-455-3p, miR-574-5p, and miR-193a-3p) about liver fibrosis from two miRNA profile data (GSE33857 and GSE77271) which were downloaded from publicly available GEO datasets (Figure 2(a)). Then, the result was verified by qRT-PCR in activated HSC LX-2 cells induced by TGFβ1 (Figure 2(b)). Subsequently, we cocultured activated LX-2 cells with HUC-MSCs and found that miR-455-3p expression was the most significant difference in the five DEMs compared with LX-2 cells cultured alone, and it indicated that HUC-MSCs significantly upregulated miR-455-3p expression in TGFβ1-activated LX-2 cells (Figure 2(c)). Therefore, we chose miR-455-3p for a further study. To validate whether HUC-MSCs inhibit LX-2 cell activation by upregulating miR-455-3p, TGFβ1-activated LX-2 cells were cocultured with HUC-MSCs for 48 hours and were transfected with miR-455-3p mimics, mimics NC, inhibitors, or inhibitors NC, respectively. We first confirmed the upregulation of miR-455-3p upon transfection of LX-2 with miR-455-3p mimics or downregulation of miR-455-3p upon transfection with miR-455-3p inhibitors (Figure 2(d)), and we observed that reduced fibrosis marker α-SMA levels upon miR-455-3p mimic transfection and increased α-SMA levels upon miR-455-3p inhibitor transfection (Figures 2(e) and 2(f)). The results showed that upregulation of miR-455-3p expression could improve the inactivation of LX-2 cells induced by HUC-MSCs, while downregulation of miR-455-3p expression could reverse the inhibitory effect. These observations indicated that HUC-MSCs suppressed the activity of LX-2 cells by upregulating miR-455-3p.
Figure 2.
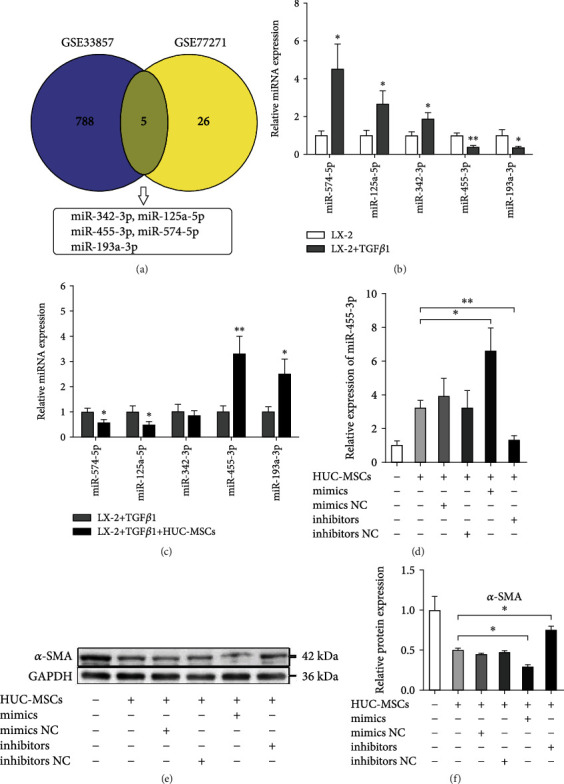
HUC-MSCs promote inactivation of LX-2 cells by upregulating miR-455-3p. (a) Venn diagram of DEMs about liver fibrosis from two miRNA profile data. (b) Comparison of qRT-PCR results of five selected DEMs in LX-2 cells treated with or without TGFβ1. (c) Comparison of the expression levels of five selected DEMs in TGFβ1-activated LX-2 cells cultured alone or cocultured with HUC-MSCs. (d) The expression levels of miR-455-3p were examined in TGFβ1-treated LX-2 cells cocultured with HUC-MSCs and then were transfected with miR-455-3p mimics, mimics NC, inhibitors, or inhibitors NC, respectively. (e) The protein levels of α-SMA measured by Western blot in each group. (f) Quantitation of α-SMA levels from three independent Western blot analyses. The quantitative data are represented as the mean ± SD. Each experiment was repeated three times. ∗P < 0.05 and ∗∗P < 0.01.
3.3. miR-455-3p Regulates PAK2 Expression by Directly Targeting the 3′ UTR of Its mRNA
We then investigated the underlying mechanism by which miR-455-3p regulates HSC activation and to identify the downstream target genes of miR-455-3p, and we performed bioinformatics analyses using Microt4, miRanda, miRDB, RNA22, and TargetScan databases and focused on PAK2, an activated receptor of TGFβ. The 3′ UTR of PAK2 mRNA contained a complementary site for the seed region of miR-455-3p (Figure 3(a)). Moreover, PAK2 has been reported to be a downstream target gene of miR-455-3p in human osteoblasts and in human colon adenocarcinoma cells [17, 18]. However, whether miR-455-3p regulates PAK2 expression in HSCs has not been confirmed yet. Therefore, to further demonstrate whether PAK2 was a direct target of miR-455-3p and mediated the suppressive effect of miR-455-3p on the profibrotic phenotype, the two putative miR-455-3p target sites (wild-type (WT) or mutant (MUT) 3′ UTR target sequences) were cloned into a luciferase reporter vector. Luciferase activity of WT 3′ UTR of PAK2 was significantly inhibited in LX-2 cells transfected with miR-455-3p (Figure 3(b)); no change of luciferase activity was observed after the cotransfection of miR-455-3p with MUT 3′ UTR of PAK2 (Figure 3(b)). To further investigate whether miR-455-3p is able to successfully modulate PAK2 expression in HSCs, LX2 cells were transfected with miR-455-3p mimics or NC, we found that overexpression of miR-455-3p strongly attenuated the expression of PAK2 protein compared with the controls (Figures 3(c) and 3(d)). These findings suggested that miR-455-3p may repress the expression of PAK2 by directly targeting the 3′ UTR of PAK2.
Figure 3.
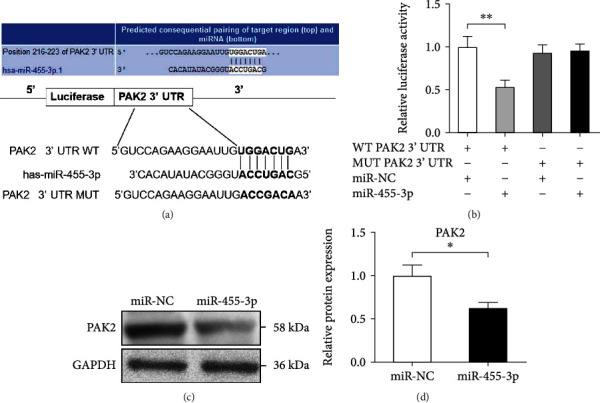
miR-455-3p regulates PAK2 expression by directly targeting the 3′ UTR of its mRNA. (a) Predicted miR-455-3p targeting sequence in 3′ UTR of WT or MUT PAK2 mRNA. (b) Dual-luciferase reporter assay of LX-2 cells cotransfected with WT or MUT PAK2 3' UTR reporter and miR-455-3p mimics or mimics NC. (c) PAK2 protein expression analysis in LX-2 cells transfected with miR-455-3p mimics using Western blotting. (d) Quantitation of PAK2 protein levels from three independent Western blot analyses. The quantitative data are represented as the mean ± SD. Each experiment was repeated three times. ∗P < 0.05 and ∗∗P < 0.01.
3.4. HUC-MSCs Attenuate the Severity of Liver Fibrosis in Mice
To further investigate the role of HUC-MSCs in hepatic fibrosis in vivo, HUC-MSCs were injected to mice once a week after 6 weeks of CCl4 administration during the 12 weeks of CCl4-induced fibrogenesis. At the end of the 12th week, we determined the degree of fibrosis in liver tissue by histology, Masson's trichrome, and Sirius red staining. We observed less liver damage and fewer fibrotic areas in the livers of mice injected with HUC-MSCs compared with PBS-treated controls (Figures 4(a) and 4(b)). Moreover, the mRNA and protein levels of profibrogenic markers, α-SMA and Col1α1 (Figures 4(c) and 4(e)), and the total collagen content (Figure 4(f)) was significantly downregulated in mice injected with HUC-MSCs. We also observed significantly lower α-SMA and Col1α1-positive areas (Figures 4(g) and 4(h)) in the livers of mice injected with HUC-MSCs, suggesting reduced fibrosis upon HUC-MSC inhibition. The levels of alanine aminotransferase (ALT) and aspartate aminotransferase (AST) in the serum of HUC-MSC infusion group were significantly downregulated compared with those of the PBS-treated group (CCl4 group) (Figure 4(d)), suggesting reduced liver injury upon HUC-MSC suppression in vivo. These results suggested that HUC-MSC injection could attenuate mouse liver fibrosis in this model.
Figure 4.
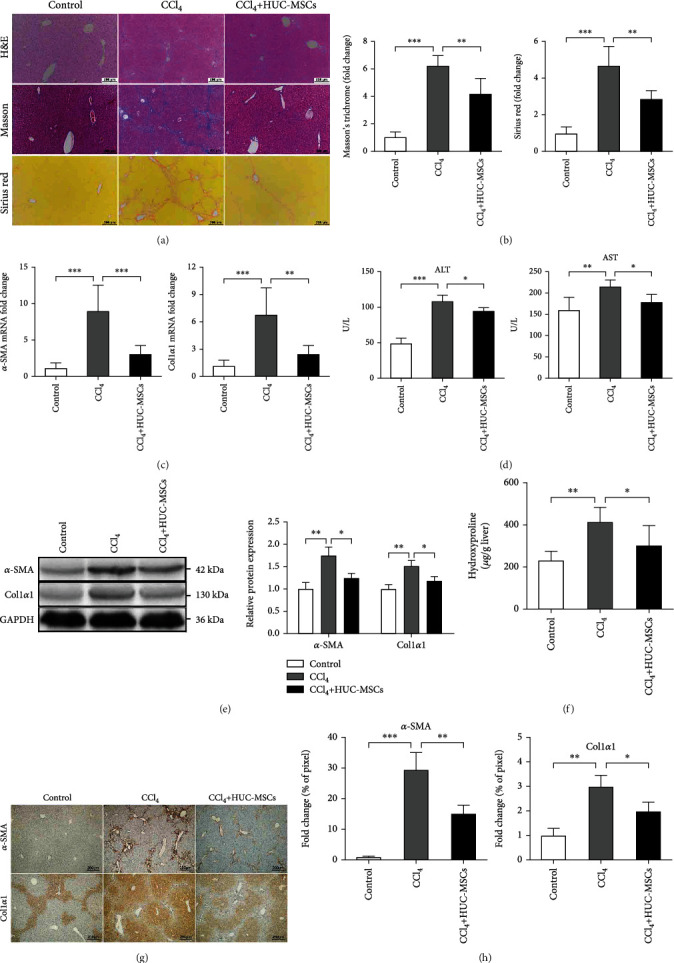
HUC-MSCs significantly attenuate severity of liver fibrosis in mice. (a) Representative images of H&E, Masson, and Sirius red staining of liver sections in olive oil-treated mice and mice of CCl4-induced liver fibrosis treated with PBS or HUC-MSCs. Scale bars, 200 μm. (b) Relative fold change of Masson and Sirius red positive fibrosis areas compared with the olive oil-treated group. (c) qRT-PCR shows the expression of α-SMA and Col1α1 in the three groups. (d) Serum levels of ALT and AST were determined to indicate the extent of liver damage in the different groups. (e) The protein levels of α-SMA and Col1α1 in liver tissues were examined by Western blotting. (f) The amount of liver hydroxyproline was detected in the different groups. (g) Immunohistochemical analysis of mouse liver tissues for the expression of α-SMA and Col1α1. Scale bars, 200 μm. (h) Quantification of immunohistochemical analysis. Percentages of immunoreactive (α-SMA and Col1α1) areas were expressed as relative values to those in oil-treated mouse livers. The quantitative data are represented as the mean ± SD. Each experiment was repeated three times. ∗P < 0.05, ∗∗∗P < 0.01, and ∗∗∗P < 0.001.
3.5. HUC-MSCs Upregulating the Expression of miR-455-3p of CCl4-Induced Liver Fibrosis in Mice by Suppressing PAK2 Expression
To verify whether miR-455-3p is involved in the inhibitory effect of HUC-MSCs on liver fibrosis, we determined miR-455-3p levels in a mouse model of liver fibrosis, which was induced by injecting C57BL/6 mice with CCl4 for 12 weeks. The increased levels of miR-455-3p in fibrotic liver tissues of mice treated by HUC-MSCs compared with CCl4 group were confirmed by qRT-PCR analysis (Figure 5(a)). To examine the efficacy of miR-455-3p at the functional level, we analyzed the mRNA and protein level of PAK2, a target gene of miR-455-3p, which has been confirmed before. As shown in Figure 5(b), a significantly lower expression level of PAK2 was found in CCl4-treated mice injected with HUC-MSCs compared with PBS injection; we also found a significantly decreased PAK2 at protein level inspected by Western blotting and immunohistochemical analysis compared with the CCl4 group (Figures 5(c)–5(f)). To determine whether PAK2 was expressed in activated HSCs, we double-stained the liver tissue slices with α-SMA and PAK2 by immunofluorescence staining, and it could be seen that α-SMA and PAK2 were coexpressed in the space of Disse of the liver (the yellow areas indicated by the arrow) (Figure 5(g)), and the areas coexpression α-SMA and PAK2 in the HUC-MSC treatment group were significantly smaller than those in the CCl4 group (Figure 5(h)). It has been reported that PAK2 is highly expressed in activated HSCs [19], the immunohistochemical staining showed that PAK2 was positively expressed in hepatic portal area and sinuses of hepatic stromal cells (Figure 5(c), combined with immunofluorescence staining, and the results may indicate that PAK2 was positively expressed in activated HSCs in liver fibrosis. In conclusion, our findings revealed that HUC-MSCs alleviated hepatic fibrosis through upregulating miR-455-3p by targeting PAK2.
Figure 5.
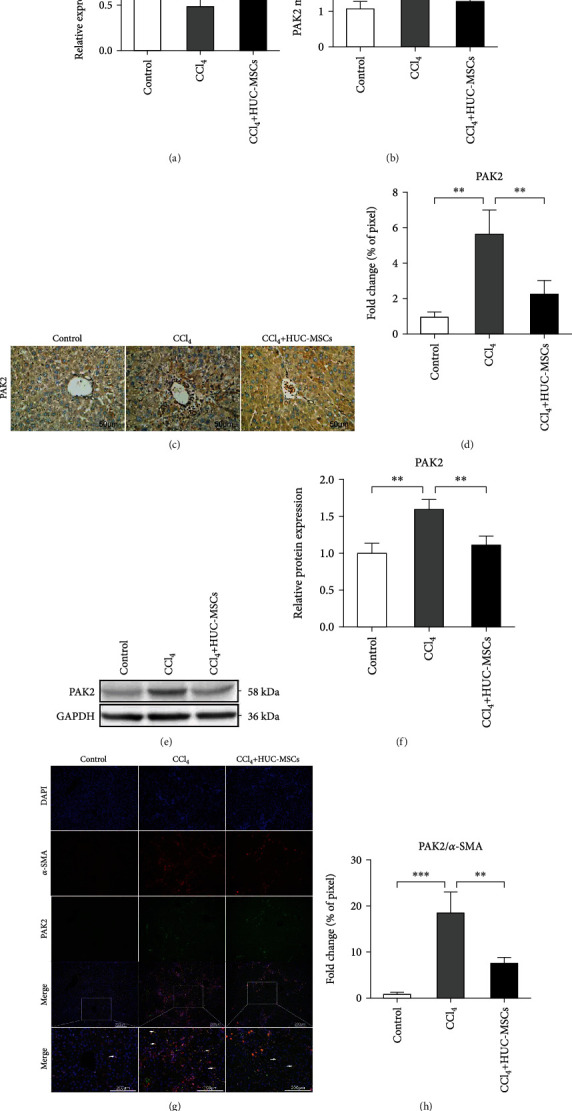
HUC-MSCs upregulate the expression of miR-455-3p of CCl4-induced liver fibrosis in mice by suppressing PAK2 expression. (a) The expression levels of miR-455-3p were examined in mouse hepatic tissues of the olive oil-treated group and CCl4-induced liver fibrosis groups treated with PBS or HUC-MSCs. (b) The expression levels of PAK2 mRNA in mouse hepatic tissues were examined by qRT-PCR. (c) Immunohistochemical staining of PAK2 in liver tissues of different groups. Scale bars, 50 μm. (d) Quantification of PAK2-positive area in mouse hepatic tissues. (e) The protein levels of PAK2 in mice hepatic tissue were examined by Western blotting. (f) Quantitation of PAK2 protein levels from three independent Western blot analyses. (g) Immunofluorescence images of liver sections for the presence of DAPI (blue) or α-SMA (red) or PAK2 (green). The yellow areas indicated by the arrow are the coexpression regions of α-SMA and PAK2. Scale bars, 200 μm. (h) Quantification of coexpression region of α-SMA and PAK2 in mouse hepatic tissues. The quantitative data are represented as the mean ± SD. Each experiment was repeated three times. ∗P < 0.05 and ∗∗P < 0.01.
4. Discussion
Liver fibrosis is the end result of the most kinds of chronic liver damage and eventually will develop into liver cirrhosis, liver failure, and even liver cancer [20]. Activation of HSCs was believed to be the crucial component of this process [21]. However, there have been no effective therapeutic strategies for liver fibrosis up to now. Recently, MSCs have been shown to inhibit the activation of HSCs in vitro and improve liver fibrosis in animal models and in clinical trials [22–24]. However, the underlying mechanisms have not yet been fully elucidated.
Recent studies have focused on miRNA mechanisms in the pathophysiology of hepatic fibrosis and the activation of HSCs. miR-455-3p is generally regarded as an oncogene or tumor suppressor in different types of tumors [25, 26]. Recently, miR-455-3p has been demonstrated participating in fibrosis. For instance, upregulation of miR-455-3p could suppress idiopathic pulmonary fibrosis through repression of Bax expression [27]. miR-455-3p overexpression suppressed renal fibrosis through repressing Rho-associated protein kinase 2 (ROCK2) expression [28]. And miR-455-3p can inhibit liver fibrosis by alleviating HSC activation through suppressing heat shock transcription factor 1 (HSF1) expression [14]. A recent study showed that miR-455-3p derived from HUC-MSC exosomes has a promising treatment for acute liver injury [29]. However, it remains unclear whether miR-455-3p was involved in the mechanism of MSCs regulating liver fibrosis.
In the current study, we found that miR-455-3p was significantly upregulated in activated HSCs co-cultured with HUC-MSCs in vitro. In vivo, we found that miR-455-3p was upregulated in CCl4-induced hepatic fibrosis models treated by HUC-MSCs, which was in accordance with the results in vitro. Our findings suggested that miR-455-3p might play an important role in the MSC treatment of liver fibrogenesis, and its upregulation might be associated with the alleviation of hepatic fibrosis. However, how HUC-MSCs inhibit the activation of HSCs by regulating the expression of miR-455-3p is a question we need for a further study. According to the research by Shao et al. [29], IL-6 stimulation of HUC-MSCs can significantly upregulate the expression of miR-455-3p in its exosomes, while the exosomes with high expression of miR-455-3p can significantly reduce lipopolysaccharide- (LPS-) mediated liver injury in mice. We speculate that HUC-MSCs may inhibit the activation of HSCs and liver fibrosis by secreting exosomes rich in miR-455-3p.
To elucidate the target gene of miR-455-3p, we predicted it by bioinformatics analysis and confirmed that PAK2 was the target gene of miR-455-3p by luciferase reporter assay. PAK2 is one of the P21-activated kinases (PAKs) of the serine/threonine kinases family [30], which is a critical effector of the Rho family of small GTPases linked to cytoskeleton reorganization [31]. PAK2 is widely distributed in the whole body and regulates a variety of biological behaviors, including promoting tumorigenesis, cellular senescence, and organismal aging [32, 33]. TGFβ has long emerged as a prominent master regulator of fibrogenesis [34]. The cellular responses evoked by TGFβ were mediated by canonical SMAD signaling and noncanonical (non-SMAD) signaling, including mitogen-activated protein kinase (MAPK) and phosphoinositide 3-kinase (PI3K)/protein-serine-threonine kinase (Akt) signaling [35, 36]. As a downstream component of Akt, PAK2 has been reported as an activated receptor of TGFβ in mesenchymal cells; PAK2 activation is essential for the proliferative/profibrotic action of TGFβ [37]. PAK2 was also reported as a non-SMAD effector of TGFβ in renal interstitial fibrogenesis; overexpression of PAK2 promotes renal fibrogenesis [38].
PAK2 was strongly expressed in activated HSCs [19], and it was highly likely that PAK2 positively modulates TGFβ/Akt signaling in HSCs. In our study, we found that HUC-MSC treatment could inhibit the expression of profibrotic markers, upregulate miR-455-3p, and downregulate PAK2 in activated HSCs, and the effect could be enhanced by miR-455-3p mimics and attenuated by miR-455-3p inhibitors. In vivo, we also found that HUC-MSCs could upregulate miR-455-3p and inhibit PAK2 in a mouse hepatic fibrosis model. However, it has been reported that miR-455-3p can promote TGFβ/SMAD signaling in chondrocytes and inhibit the development of osteoarthritis by directly targeting PAK2 [17]. Therefore, it might be that PAK2 positively modulates TGFβ/Akt (non-SMAD) signaling in mesenchymal cells, while negatively regulating TGFβ/SMAD signaling by attenuating the receptor-SMAD interaction in epithelial cells [39].
5. Conclusion
Our study demonstrated that HUC-MSCs significantly alleviate HSC activation and CCl4-induced liver fibrosis in a mouse model; overexpression of miR-455-3p by targeting PAK2 might be the underlying mechanism for the therapeutic effects of HUC-MSCs in hepatic fibrosis.
Acknowledgments
This project was supported by the National Key R&D Program of China (No. 2018YFA0107500) and Zhenjiang Social Development Fund (No. SH2020027).
Contributor Information
Sanrong Xu, Email: zjxsrong@163.com.
Yuting Kuang, Email: yuting_kuang@163.com.
Data Availability
The datasets generated and/or analyzed during the present study are available from the corresponding author upon reasonable request.
Conflicts of Interest
The authors declare that they have no conflicts of interest.
Authors' Contributions
ZQ performed the study and wrote the manuscript. GTF established the animal models and carried out the histopathological studies. ZY performed the study, carried out the data analysis, and prepared the figures. LHD and ZSXM carried out cell culture and did the molecular studies. KYT and XSR conceived the ideas, supervised the study, and revised the manuscript. Qing Zhou, Tengfei Gu, and Yong Zhang contributed equally to this work and were co-first authors.
Supplementary Materials
Supplementary Figure 1: HUC-MSCs inhibit HSC activation and promote miR-455-3p expression in a dose-dependent manner. (a) Comparison of mRNA levels of α-SMA measured by qRT-PCR of five groups with HUC-MSC : HSC ratios of 0 : 1, 1 : 25, 1 : 5, 1 : 1, and 5 : 1. (b) Comparison of mRNA levels of Col1α1 measured by qRT-PCR of the five groups. (c) Comparison of miR-455-3p levels measured by qRT-PCR of the five groups.
References
- 1.Higashi T., Friedman S. L., Hoshida Y. Hepatic stellate cells as key target in liver fibrosis. Advanced Drug Delivery Reviews. 2017;121:27–42. doi: 10.1016/j.addr.2017.05.007. [DOI] [PMC free article] [PubMed] [Google Scholar]
- 2.Tsuchida T., Friedman S. L. Mechanisms of hepatic stellate cell activation. Nature Reviews Gastroenterology & Hepatology. 2017;14(7):397–411. doi: 10.1038/nrgastro.2017.38. [DOI] [PubMed] [Google Scholar]
- 3.Mederacke I., Hsu C. C., Troeger J. S., et al. Fate tracing reveals hepatic stellate cells as dominant contributors to liver fibrosis independent of its aetiology. Nature Communications. 2013;4(1) doi: 10.1038/ncomms3823. [DOI] [PMC free article] [PubMed] [Google Scholar]
- 4.Kadyk L. C., Collins L. R., Littman N. J., Millan M. T. Proceedings: moving toward cell-based therapies for liver disease. STEM CELLS Translational Medicine. 2015;4(3):207–210. doi: 10.5966/sctm.2014-0276. [DOI] [PMC free article] [PubMed] [Google Scholar]
- 5.Haldar D., Henderson N. C., Hirschfield G., Newsome P. N. Mesenchymal stromal cells and liver fibrosis: a complicated relationship. FASEB J. 2016;30(12):3905–3928. doi: 10.1096/fj.201600433R. [DOI] [PubMed] [Google Scholar]
- 6.Wilson A., Hodgson-Garms M., Frith J. E., Genever P. Multiplicity of mesenchymal stromal cells: finding the right route to therapy. Frontiers in Immunology. 2019;10 doi: 10.3389/fimmu.2019.01112. [DOI] [PMC free article] [PubMed] [Google Scholar]
- 7.Shi Y., Wang Y., Li Q., et al. Immunoregulatory mechanisms of mesenchymal stem and stromal cells in inflammatory diseases. Nature Reviews Nephrology. 2018;14(8):493–507. doi: 10.1038/s41581-018-0023-5. [DOI] [PubMed] [Google Scholar]
- 8.Wang J., Ren H., Yuan X., Ma H., Shi X., Ding Y. Interleukin-10 secreted by mesenchymal stem cells attenuates acute liver failure through inhibiting pyroptosis. Hepatology Research. 2018;48(3):E194–E202. doi: 10.1111/hepr.12969. [DOI] [PubMed] [Google Scholar]
- 9.El Agha E., Kramann R., Schneider R. K., et al. Mesenchymal stem cells in fibrotic disease. Cell Stem Cell. 2017;21(2):166–177. doi: 10.1016/j.stem.2017.07.011. [DOI] [PubMed] [Google Scholar]
- 10.Lee C. W., Chen Y. F., Wu H. H., Lee O. K. Historical perspectives and advances in mesenchymal stem cell research for the treatment of liver diseases. Gastroenterology. 2018;154(1):46–56. doi: 10.1053/j.gastro.2017.09.049. [DOI] [PubMed] [Google Scholar]
- 11.Ha M., Kim V. N. Regulation of microRNA biogenesis. Nature Reviews Molecular Cell Biology. 2014;15(8):509–524. doi: 10.1038/nrm3838. [DOI] [PubMed] [Google Scholar]
- 12.You K., Li S. Y., Gong J., et al. MicroRNA-125b Promotes Hepatic Stellate Cell Activation and Liver Fibrosis by Activating RhoA Signaling. Molecular Therapy-Nucleic Acids. 2018;12:57–66. doi: 10.1016/j.omtn.2018.04.016. [DOI] [PMC free article] [PubMed] [Google Scholar]
- 13.Yang L., Dong C., Yang J., et al. MicroRNA-26b-5p inhibits mouse liver fibrogenesis and angiogenesis by targeting PDGF receptor-beta. Molecular Therapy - Nucleic Acids. 2019;16:206–217. doi: 10.1016/j.omtn.2019.02.014. [DOI] [PMC free article] [PubMed] [Google Scholar]
- 14.Wei S., Wang Q., Zhou H., et al. miR-455-3p alleviates hepatic stellate cell activation and liver fibrosis by suppressing HSF1 expression. Molecular Therapy Nucleic Acids. 2019;16:758–769. doi: 10.1016/j.omtn.2019.05.001. [DOI] [PMC free article] [PubMed] [Google Scholar]
- 15.Wang G., Cao K., Liu K., et al. Kynurenic acid, an IDO metabolite, controls TSG-6-mediated immunosuppression of human mesenchymal stem cells. Cell Death & Differentiation. 2018;25(7):1209–1223. doi: 10.1038/s41418-017-0006-2. [DOI] [PMC free article] [PubMed] [Google Scholar]
- 16.Li X., Shang B., Li Y. N., Shi Y., Shao C. IFNγ and TNFα synergistically induce apoptosis of mesenchymal stem/stromal cells via the induction of nitric oxide. Stem Cell Research & Therapy. 2019;10(1):p. 18. doi: 10.1186/s13287-018-1102-z. [DOI] [PMC free article] [PubMed] [Google Scholar]
- 17.Hu S., Zhao X., Mao G., et al. MicroRNA-455-3p promotes TGF-β signaling and inhibits osteoarthritis development by directly targeting PAK2. Experimental & Molecular Medicine. 2019;51(10):1–13. doi: 10.1038/s12276-019-0322-3. [DOI] [PMC free article] [PubMed] [Google Scholar]
- 18.Ni X., Ding Y., Yuan H., et al. Long non-coding RNA ZEB1-AS1 promotes colon adenocarcinoma malignant progression via miR-455-3p/PAK2 axis. Cell Proliferation. 2020;53(1):p. e12723. doi: 10.1111/cpr.12723. [DOI] [PMC free article] [PubMed] [Google Scholar]
- 19.Bandapalli O. R., Macher-Goeppinger S., Schirmacher P., Brand K. Paracrine signalling in colorectal liver metastases involving tumor cell-derived PDGF-C and hepatic stellate cell-derived PAK-2. Clinical & Experimental Metastasis. 2012;29(5):409–417. doi: 10.1007/s10585-012-9459-3. [DOI] [PubMed] [Google Scholar]
- 20.Campana L., Iredale J. P. Regression of liver fibrosis. Seminar in Liver Disease. 2017;37(1):1–10. doi: 10.1055/s-0036-1597816. [DOI] [PubMed] [Google Scholar]
- 21.Seki E., Brenner D. A. Recent advancement of molecular mechanisms of liver fibrosis. Journal of Hepato-Biliary-Pancreatic Sciences. 2015;22(7):512–518. doi: 10.1002/jhbp.245. [DOI] [PMC free article] [PubMed] [Google Scholar]
- 22.An S. Y., Jang Y. J., Lim H. J., et al. Milk fat globule-EGF factor 8, secreted by mesenchymal stem cells, protects against liver fibrosis in mice. Gastroenterology. 2017;152(5):1174–1186. doi: 10.1053/j.gastro.2016.12.003. [DOI] [PubMed] [Google Scholar]
- 23.Huang B., Cheng X., Wang H., et al. Mesenchymal stem cells and their secreted molecules predominantly ameliorate fulminant hepatic failure and chronic liver fibrosis in mice respectively. Journal of Translational Medicine. 2016;14(1) doi: 10.1186/s12967-016-0792-1. [DOI] [PMC free article] [PubMed] [Google Scholar]
- 24.de Miguel M. P., Prieto I., Moratilla A., Arias J., Aller M. A. Mesenchymal stem cells for liver regeneration in liver failure: from experimental models to clinical trials. Stem Cells International. 2019;2019:12. doi: 10.1155/2019/3945672.3945672 [DOI] [PMC free article] [PubMed] [Google Scholar]
- 25.Liu A., Zhu J., Wu G., et al. Antagonizing miR-455-3p inhibits chemoresistance and aggressiveness in esophageal squamous cell carcinoma. Molecular Cancer. 2017;16(1):p. 106. doi: 10.1186/s12943-017-0669-9. [DOI] [PMC free article] [PubMed] [Google Scholar]
- 26.Zeng Y., Gao T., Huang W., et al. GATA3 regulates miR-455-3p to inhibit TGF-β signaling. Biological Chemistry. 2019;294(43):15808–15825. doi: 10.1074/jbc.RA119.010800. [DOI] [PMC free article] [PubMed] [Google Scholar]
- 27.Zhou Y., Chai X. Protective effect of bicyclol against pulmonary fibrosis via regulation of micro RNA-455-3p in rats. Journal of Cellular Biochemistry. 2019;121(1):651–660. doi: 10.1002/jcb.29310. [DOI] [PubMed] [Google Scholar]
- 28.Wu J., Liu J., Ding Y., et al. MiR-455-3p suppresses renal fibrosis through repression of ROCK2 expression in diabetic nephropathy. Biochemical and Biophysical Research Communications. 2018;503(2):977–983. doi: 10.1016/j.bbrc.2018.06.105. [DOI] [PubMed] [Google Scholar]
- 29.Shao M., Xu Q., Wu Z., et al. Exosomes derived from human umbilical cord mesenchymal stem cells ameliorate IL-6-induced acute liver injury through miR-455-3p. Stem Cell Research & Therapy. 2020;11(1):p. 37. doi: 10.1186/s13287-020-1550-0. [DOI] [PMC free article] [PubMed] [Google Scholar]
- 30.Ha B. H., Morse E. M., Turk B. E., Boggon T. J. MINIREVIEW: Type II PAK Signaling, Regulation, and Specificity. Journal of Biological Chemistry. 2015;290(21):12975–12983. doi: 10.1074/jbc.R115.650416. [DOI] [PMC free article] [PubMed] [Google Scholar]
- 31.Phee H., Au-Yeung B. B., Pryshchep O., et al. Pak2 is required for actin cytoskeleton remodeling, TCR signaling, and normal thymocyte development and maturation. Elife. 2014;3 doi: 10.7554/eLife.02270. [DOI] [PMC free article] [PubMed] [Google Scholar]
- 32.Gupta A., Ajith A., Singh S., Panday R. K., Samaiya A., Shukla S. PAK2-c-Myc-PKM2 axis plays an essential role in head and neck oncogenesis via regulating Warburg effect. Cell Death Disease. 2018;9(8):p. 825. doi: 10.1038/s41419-018-0887-0. [DOI] [PMC free article] [PubMed] [Google Scholar]
- 33.Lee J. S., Mo Y., Gan H., et al. Pak2 kinase promotes cellular senescence and organismal aging. Proceedings of the National Academy of Sciences. 2019;116(27):13311–13319. doi: 10.1073/pnas.1903847116. [DOI] [PMC free article] [PubMed] [Google Scholar]
- 34.Meng X. M., Nikolic-Paterson D. J., Lan H. Y. TGF-β: the master regulator of fibrosis. Nature Reviews Nephrology. 2016;12(6):325–338. doi: 10.1038/nrneph.2016.48. [DOI] [PubMed] [Google Scholar]
- 35.Yu Y., Feng X. H. TGF-β signaling in cell fate control and cancer. Current Opinion in Cell Biology. 2019;61:56–63. doi: 10.1016/j.ceb.2019.07.007. [DOI] [PubMed] [Google Scholar]
- 36.Luo K. Signaling cross talk between TGF-β/Smad and other signaling pathways. Cold Spring Harbor Perspectives in Biology. 2017;9(1) doi: 10.1101/cshperspect.a022137. [DOI] [PMC free article] [PubMed] [Google Scholar]
- 37.Wilkes M. C., Repellin C. E., Hong M., et al. Erbin and the _NF2_ Tumor Suppressor Merlin Cooperatively Regulate Cell-Type- Specific Activation of PAK2 by TGF- β. Developmental Cell. 2009;16(3):433–444. doi: 10.1016/j.devcel.2009.01.009. [DOI] [PMC free article] [PubMed] [Google Scholar]
- 38.Wang S., Wilkes M. C., Leof E. B., Hirschberg R. Noncanonical TGF-beta pathways, mTORC1 and Abl, in renal interstitial fibrogenesis. American Journal of Physiology-Renal Physiology. 2010;298(1):F142–F149. doi: 10.1152/ajprenal.00320.2009. [DOI] [PMC free article] [PubMed] [Google Scholar]
- 39.Sato M., Matsuda Y., Wakai T., et al. p21-activated kinase-2 is a critical mediator of transforming growth factor-β-induced hepatoma cell migration. Journal of Gastroenterology and Hepatology. 2013;28(6):1047–1055. doi: 10.1111/jgh.12150. [DOI] [PubMed] [Google Scholar]
Associated Data
This section collects any data citations, data availability statements, or supplementary materials included in this article.
Supplementary Materials
Supplementary Figure 1: HUC-MSCs inhibit HSC activation and promote miR-455-3p expression in a dose-dependent manner. (a) Comparison of mRNA levels of α-SMA measured by qRT-PCR of five groups with HUC-MSC : HSC ratios of 0 : 1, 1 : 25, 1 : 5, 1 : 1, and 5 : 1. (b) Comparison of mRNA levels of Col1α1 measured by qRT-PCR of the five groups. (c) Comparison of miR-455-3p levels measured by qRT-PCR of the five groups.
Data Availability Statement
The datasets generated and/or analyzed during the present study are available from the corresponding author upon reasonable request.