Abstract
Background: Hypertension in patients with atrial fibrillation (AF) is a known independent risk factor for stroke. The Complete blood pressure (BP) monitor (Omron Healthcare, Kyoto, Japan) was developed as the first BP monitor with electrocardiogram (ECG) capability in a single device to simultaneously monitor ECG and BP readings. This study investigated whether the Complete can accurately differentiate sinus rhythm (SR) from AF during BP measurement.
Methods and Results: Fifty-six consecutive patients with persistent AF admitted for catheter ablation were enrolled in the study (mean age 65.8 years; 83.9% male). In all patients, 12-lead ECGs and simultaneous Complete recordings were acquired before and after ablation. The Complete interpretations were compared with physician-reviewed ECGs, whereas Complete recordings were reviewed by cardiologists in a blinded manner and compared with ECG interpretations. Sensitivity, specificity, and κ coefficient were also determined. In all, 164 Complete and ECG recordings were simultaneously acquired from the 56 patients. After excluding unclassified recordings, the Complete automated algorithm performed well, with 100% sensitivity, 86% specificity, and a κ coefficient of 0.87 compared with physician-interpreted ECGs. Physician-interpreted Complete recordings performed well, with 99% sensitivity, 85% specificity, and a κ coefficient of 0.85 compared with physician-interpreted ECGs.
Conclusions: The Complete, which combines BP and ECG monitoring, can accurately differentiate SR from AF during BP measurement.
Key Words: Atrial fibrillation, Blood pressure, Digital health, Electrocardiogram (ECG)
Hypertension is highly prevalent in adults with atrial fibrillation (AF), especially those aged >60 years, and affects 1 billion adults worldwide.1 Stroke prevention is one of the top priorities of principal management in patients with AF.2–4 The presence of hypertension in patients with AF is an independent risk factor for stroke, with these individuals at a 1.8- to 2-fold higher risk of stroke than those without hypertension.4,5 Thus, it is important to refine personalized predictions of AF in hypertensive patients with sinus rhythm (SR).
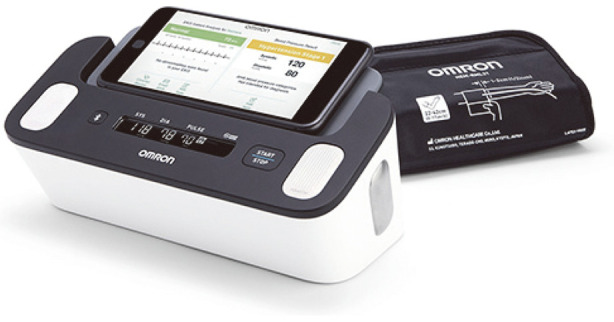
The Complete blood pressure (BP) monitor (Omron Healthcare, Kyoto, Japan) is an upper arm BP monitor that allows users to simultaneously monitor ECG and BP at home (Figure 1). The ability to measure both risk factors simultaneously with a single device is an easy way for AF patients to track their condition and to know when to seek treatment to prevent stroke. The Complete was developed by AliveCor (Mountain View, CA, USA) and uses an advanced algorithm for improved detection of AF.6
Figure 1.

The Complete (Omron Healthcare, Kyoto, Japan) wireless upper arm blood pressure monitor with electrocardiogram capability.
The aim of this study was to investigate whether the Complete can differentiate SR from AF accurately and reliably while measuring BP compared with 12-lead ECGs acquired nearly simultaneously and interpreted by physicians. Correlations between Complete automated algorithm detection and physician-interpreted 12-lead ECGs, as well as between physician-interpreted Complete recordings and physician-interpreted 12-lead ECGs were assessed to characterize the quality of the Complete recordings.
Methods
Study Design and Study Participants
The present multicenter, non-randomized, and adjudicator-blinded study evaluated the accuracy of the Complete device in detecting AF during BP measurement. Omron Healthcare provided the Complete coupled to a WiFi-enabled smart device (iPhone; Apple Inc., Cupertino, CA, USA) for use in the study. Omron Healthcare was not involved in study design, implementation, data analysis, or manuscript preparation. This study was approved by all institutional review boards of the participating institutions, including the Kyoto Prefectural University of Medicine, and was performed in accordance with the Declaration of Helsinki.
Patients with persistent AF who were admitted for catheter ablation were screened for study eligibility. To be eligible for inclusion, patients had to be >20 years of age and to have a history of persistent AF. Patients with pacemakers or defibrillators were excluded from the study. All subjects were informed about the study and provided written informed consent. Patients who consented to take part in the study were provided with a Complete device paired with an iPhone at the time of their admission to hospital.
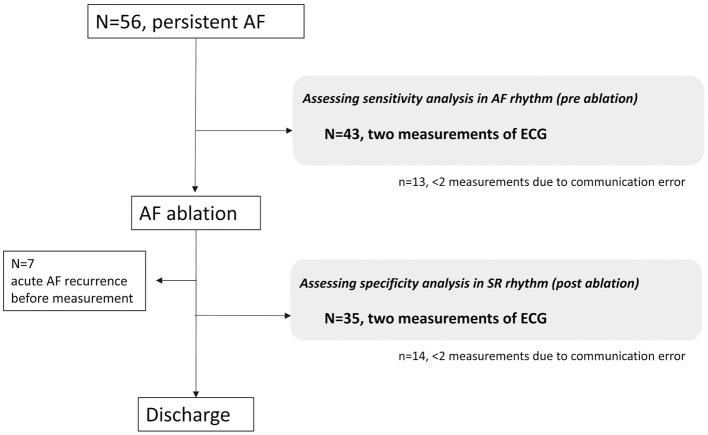
Patients were instructed to perform 2 BP measurements and a 30-s ECG recording of bipolar Lead I rhythm strip by touching the electrodes located on the top face and both sides of the monitor. If a recording could not be interpreted as “normal” or “possible AF”, patients were instructed to perform another measurement. Within 2 h of the measurements made using the Complete device, 12-lead ECG recordings were obtained. This series of processes was performed before and after ablation during a patient’s hospitalization (Figure 2). The rhythm strip was automatically analyzed by the Complete algorithm, which labels a recording as “normal” or “possible atrial fibrillation” using a machine learning model. The algorithm uses a collection of approximately 50 specific parameters calculated from the rhythm strip, including RR interval statistics, morphological characteristics, signal quality, and frequency domain features. The algorithm classifies rhythm irregularity and the absence of a P wave as “possible AF” and regular rhythms with P waves as “normal” if the rate is between 50 and 100 beats/min. If the rate is <50 beats/min (“bradycardia”) or >100 beats/min (“tachycardia”), or if the recording is noisy or shorter than 30 s (“unreadable”), then it is labeled as “unclassified”. After analysis, the recorded rhythm strips were automatically transferred to Omron Healthcare’s compliant cloud server, which conforms to the Health Insurance Portability and Accountability Act of 1996, and were downloaded and printed for review. All 12-lead ECGs and Complete recordings were independently reviewed in a blinded manner by cardiologists who classified the rhythm as SR, AF, or “uninterpretable” (due to baseline artifact, wander, or drift).
Figure 2.
Flow chart of study participants. AF, atrial fibrillation; ECG, electrocardiogram.
Statistical Analysis
Sensitivity and specificity were calculated for comparisons between: (1) Complete automated interpretation and physician-interpreted 12-lead ECGs; (2) physician-interpreted Complete recordings and physician-interpreted 12-lead ECGs; and (3) Complete automated interpretation and physician-interpreted Complete recordings. Kappa (κ) coefficients for interobserver agreement were calculated, and κ coefficients >0.8 were considered to indicate excellent agreement. Independence was tested using Chi-squared tests. Statistical analyses were performed using JMP Pro 15 (SAS Institute, Cary, NC, USA).
Results
In all, 56 patients were enrolled in the study from May 2019 to March 2020. The baseline characteristics and measurement data of the study population are listed in Table 1. Acute recurrence before postablation measurements was observed in 7 of 56 patients (12.5%). There were 164 simultaneous 12-lead ECGs and Complete recordings, and 8 Complete recordings (4.9%) were labeled as “unclassified” by the Complete algorithm.
Table 1.
Baseline Characteristics and Measurement Data for the Study Population (n=56)
| Baseline characteristics | |
| Age (years) | 65.8±10.7 |
| Male sex | 47 (83.9) |
| History of congestive heart failure | 7 (12.5) |
| History of hypertension | 30 (53.6) |
| History of diabetes | 5 (9.1) |
| History of stroke | 1 (1.9) |
| History of vascular disease | 0 (0) |
| Measurement data | |
| Before ablation | |
| SBP (mmHg) | 123±11 |
| DBP (mmHg) | 86±3 |
| Heart rate (beats/min) | 80.5±9.2 |
| After ablation | |
| SBP (mmHg) | 126±25 |
| DBP (mmHg) | 80±1 |
| Heart rate (beats/min) | 80.8±8.8 |
Data are given as the mean±SD or as n (%). DBP, diastolic blood pressure; SBP, systolic blood pressure.
To test the accuracy of the Complete automated algorithm for detecting possible AF, Complete automated rhythm interpretation and physician-interpreted 12-lead ECG readings were compared. Of the 156 interpretable recordings, the sensitivity and specificity for detecting possible AF by the Complete automated algorithm were 100% (95% confidence interval [CI] 1.00–1.00) and 86% (95% CI 0.78–0.94), respectively, with a κ coefficient of 0.87 (95% CI 0.79–0.95; Table 2).
Table 2.
Interpretation of Complete Automated Algorithm Compared With Physician-Interpreted 12-Lead ECGs
| Complete algorithm interpretation |
Physician-interpreted 12-lead ECGs | ||
|---|---|---|---|
| AF | Sinus | Total | |
| Possible AF (n) | 86* | 10* | 96 |
| Normal (n) | 0* | 60* | 60 |
| Unclassified (n) | 5 | 3 | 8 |
| Total (n) | 91 | 73 | 164 |
AF, atrial fibrillation; ECG, electrocardiogram. *Sensitivity, specificity, and k coefficient are calculated only for the simultaneous transmission with interpretation.
To assess the fidelity and overall quality of Complete rhythm recordings and transmission, physician-interpreted Complete recordings and 12-lead ECGs were compared. Of the 164 simultaneous 12-lead ECGs and Complete recordings, 3 Complete recordings were “uninterpretable” by the physicians. Of the remaining 161 recordings, the sensitivity and specificity for detecting AF by physician-interpreted Complete recordings were 99% (95% CI 0.97–1.00) and 85% (95% CI 0.76–0.93), respectively, with a κ coefficient of 0.85 (95% CI 0.76–0.93; Table 3).
Table 3.
Comparison of Physician-Interpreted Complete Recordings and Physician-Interpreted 12-Lead ECGs
| Physician-interpreted Complete recordings |
Physician-interpreted 12-lead ECGs | ||
|---|---|---|---|
| AF | Sinus | Total | |
| Possible AF | 88* | 11* | 99 |
| Normal | 1* | 61* | 62 |
| Uninterpretable | 2 | 1 | 3 |
| Total | 91 | 73 | 164 |
AF, atrial fibrillation; ECG, electrocardiogram. *Sensitivity, specificity, and k coefficient are calculated only for the simultaneous transmission with interpretation.
To measure the quality of the Complete recordings, the interpretations provided by the Complete automated algorithm and physicians were compared. As noted, 8 recordings were labeled as “unclassified” by the Complete algorithm. Of the remaining 156 recordings, the sensitivity and specificity for detecting possible AF by Complete automated algorithm interpretation were 99% (95% CI 0.97–1.00) and 97% (95% CI 0.92–1.00), respectively, with a κ coefficient of 0.96 (95% CI 0.91–1.00).
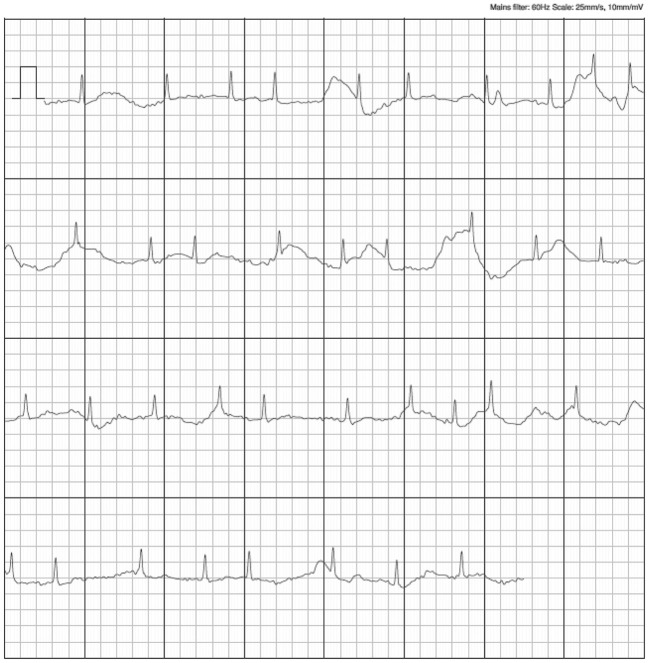
Of the 8 recordings labeled “unclassified” by the Complete algorithm, 1 (12.5%) was due to a heart rate of <50 or >100 beats/min, 4 (50%) were due to baseline artifact and a low amplitude of the recordings, and 1 (12.5%) was due to a recording <30 s in duration. The reasons why the remaining 2 recordings (25%) were classified as “unclassified” were unclear. Of the 8 “unclassified” recordings, 1 was considered “uninterpretable” by the physicians. The remaining 7 Complete recordings were interpreted by the physicians with 100% sensitivity and 100% specificity (5 in AF, 2 in SR). All 10 false-positive AF recordings were associated with small-voltage P waves and frequent supraventricular premature contractions (SVPCs) giving rise to irregularity, as shown in Figure 3.
Figure 3.
Examples of false-positive recordings.
Discussion
Digital medical technology has revolutionized medical examinations, especially in the field of cardiology.7 Modern applications are becoming available with advances in technology that enable more advanced ad hoc monitoring. These range from new devices to mobile phone applications. These options allow for more advanced screening with improved specificity and sensitivity.8,9 For example, the detection of AF during periodic self-monitoring of BP using home automation devices by hypertensive patients has the advantage of being widely available in populations to screen for AF, and is a cost-effective alternative to current screening approaches.10
Several BP monitors with irregular heartbeat (IHB) detectors have been available for some time. Several clinical studies examining the accuracy of IHB in detecting AF have shown high specificity (range 0.92–0.97) for IHB, but with variable sensitivity (range 0.30–0.97), suggesting that IHB detectors should not be used for AF screening.11
In contrast to IHB detection, according to the US Food and Drug Administration (FDA), detection of AF represents a diagnosis of the disease. To date, 6 published clinical trials have investigated the diagnostic accuracy of AF detection by automated BP measurement devices.11–16 All 6 studies compared the results of the BP monitor against a 12-lead ECG interpreted by cardiologists and reported sensitivity (range 0.89–1.00) and specificity (range 0.76–0.99). Furthermore, it has been suggested that the diagnostic accuracy (sensitivity and specificity) of the AF detection algorithm can be improved by increasing the number of measurements.17 However, because these devices are only designed to detect AF by assessing the consistency of pulse rate irregularities,13 physicians cannot use them as a diagnostic decision tool at the time of consultation.
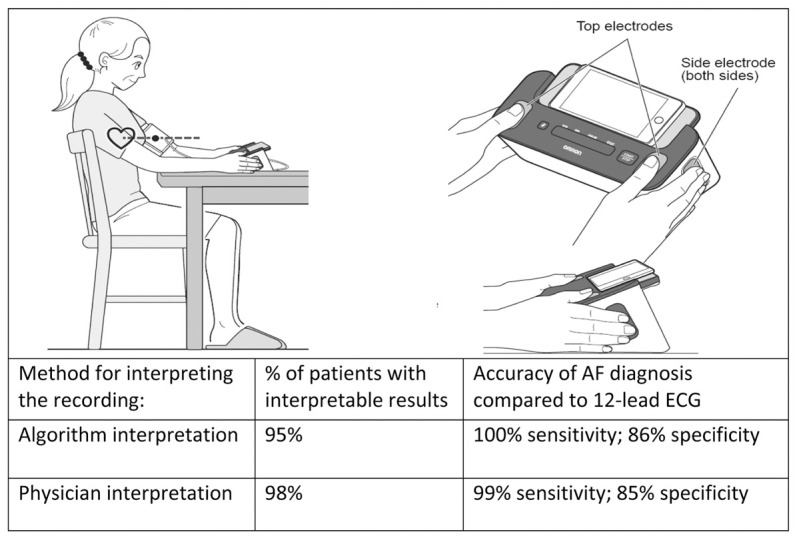
Conversely, small hand-held ECG devices have now been developed that allow a “visible” rhythm recording using smartphone technology.18 In 2017, the Kardia Band (AliveCor) was introduced as the first FDA-approved Apple Watch accessory that can record a quick rhythm strip equivalent to Lead I for 30 s for a patient.19 More recently, the Kardia Mobile Cardiac Monitor was paired with an automated rhythm adjudication algorithm for the detection of AF to offer simple and prompt AF detection.6 Now, an automated rhythm adjudication algorithm for the detection of AF has been added to the Complete BP device. Assessment of the accuracy of the Complete device in the present study shows excellent agreement with physician-interpreted simultaneously acquired 12-lead ECGs during BP measurement (Figure 4). In suspected paroxysmal AF, repeated automated home BP monitoring with ECG technology may increase the likelihood of diagnosing AF. Hypertension and AF are common chronic and recurrent conditions with an unmet need for disease tracing and diagnosis. In the near future, monitoring disease-related metrics through such multifunctional BP devices will be essential in assessing the effectiveness of treatment and disease management.
Figure 4.

Accuracy of atrial fibrillation (AF) diagnosis by the Complete automated algorithm and physician interpretation compared with the 12-lead electrocardiogram (ECG). Patients were instructed to put their thumbs on the top electrodes of the device, and 2 or more fingers on each of the side electrodes, to record their ECG. Once the fingers were placed on the electrodes, the ECG recording started automatically. Automated Complete recordings detected AF with 100% (95% confidence interval [CI] 1.00–1.00) sensitivity and 86% (95% CI 0.78–0.94) specificity compared with physician-interpreted 12-lead ECGs. Physician-interpreted Complete recordings detected AF with 99% (95% CI 0.97–1.00) sensitivity and 85% (95% CI 0.76–0.93) specificity compared with physician-interpreted 12-lead ECGs.
In the present study, a significant association was found between the frequency of SVPCs and that of false-positive AF detection (Figure 3). Despite high diagnostic accuracy, with sensitivity and specificity of 100% and 86%, respectively, false-positive findings may unnecessarily alarm users. However, excessive SVPCs have been linked not only to future risk of AF, but also to cardiovascular outcomes and mortality.20 In addition, excessive SVPC and a high CHADS2 score independently and synergistically predict the first appearance of AF in patients in SR, indicating a 10-fold higher risk. Thus, clinicians need to consider the optimal screening frequency and comprehensive evaluation according to disease risk.
Study Limitations
Patients with cardiac implantable electronic devices were not included in this study. Thus, the Complete device requires further evaluation in this population. There were 13 patients before ablation and 14 patients after ablation with fewer than 2 measurements due to communication errors between the device and server system; in addition, even when recordings were made, 8 were labeled as “unclassified”. None of the patients who participated in the study had used the device before. With more experience and practice regarding the proper use of this device, some of those communication errors and unclassified recordings could be avoided.
Given the false-positive recordings (14% with the algorithm and 15% based on physicians’ interpretations), the Complete device is not suitable for replacing the comprehensive analyses performed by physicians. However, the false-negative detection rate was very small; therefore, the Complete device has the potential to aid in clinical decision making. Although the Complete device has been approved by the FDA, the regulation and application of mobile health tools focus primarily on safety, and in many cases there are no prospective and unbiased evidence-based assessments of efficacy.21 Given the trajectory of mobile health tools, analyses as presented in this study will become increasingly important.
Conclusions
Complete, a combination BP and ECG monitor, can accurately differentiate SR from AF with good sensitivity and specificity and excellent interobserver agreement compared with 12-lead ECGs. Having the ability to measure both BP and AF simultaneously in a single device provides users with a simple way of keeping track of their condition and knowing when to seek treatment for stroke prevention.
Sources of Funding
Omron Healthcare provided the Complete and iPhone for this study, but was not involved in study design, data analysis, or article preparation.
Disclosures
K.S. has had university research contracts with Omron Healthcare.
K.S. is also affiliated with an endowed department sponsored by Biotronik and Japan LifeLine.
The other authors have no conflicts of interest to declare.
IRB Information
This study was approved by the Institutional Clinical Research Review Board of Kyoto Prefectural University of Medicine (Reference no. ERB-C-1347).
Data Availability
The deidentified participant data will not be shared.
References
- 1. Kearney PM, Whelton M, Reynolds K, Muntner P, Whelton PK, He J.. Global burden of hypertension: Analysis of worldwide data. Lancet 2005; 365: 217–223. [DOI] [PubMed] [Google Scholar]
- 2. Kim TH, Yang PS, Kim D, Yu HT, Uhm JS, Kim JY, et al.. CHA2DS2-VASc score for identifying truly low-risk atrial fibrillation for stroke: A Korean nationwide cohort study. Stroke 2017; 48: 2984–2990. [DOI] [PubMed] [Google Scholar]
- 3. Kim TH, Yang PS, Uhm JS, Kim JY, Pak HN, Lee MH, et al.. CHA2DS2-VASc score (congestive heart failure, hypertension, age ≥75 [doubled], diabetes mellitus, prior stroke or transient ischemic attack [doubled], vascular disease, age 65–74, female) for stroke in Asian patients with atrial fibrillation: A Korean nationwide sample cohort study. Stroke 2017; 48: 1524–1530. [DOI] [PubMed] [Google Scholar]
- 4. Lip G, Freedman B, De Caterina R, Potpara TS.. Stroke prevention in atrial fibrillation: Past, present and future. Comparing the guidelines and practical decision-making. Thromb Haemost 2017; 117: 1230–1239. [DOI] [PubMed] [Google Scholar]
- 5. Stroke Risk in Atrial Fibrillation Working Group.. Independent predictors of stroke in patients with atrial fibrillation: A systematic review. Neurology 2007; 69: 546–554. [DOI] [PubMed] [Google Scholar]
- 6. William AD, Kanbour M, Callahan T, Bhargava M, Varma N, Rickard J, et al.. Assessing the accuracy of an automated atrial fibrillation detection algorithm using smartphone technology: The iREAD Study. Heart Rhythm 2018; 15: 1561–1565. [DOI] [PubMed] [Google Scholar]
- 7. Turakhia MP, Desai SA, Harrington RA.. The outlook of digital health for cardiovascular medicine: Challenges but also extraordinary opportunities. JAMA Cardiol 2016; 1: 743–744. [DOI] [PubMed] [Google Scholar]
- 8. Lau JK, Lowres N, Neubeck L, Brieger DB, Sy RW, Galloway CD, et al.. iPhone ECG application for community screening to detect silent atrial fibrillation: A novel technology to prevent stroke. Int J Cardiol 2013; 165: 193–194. [DOI] [PubMed] [Google Scholar]
- 9. Lowres N, Neubeck L, Salkeld G, Krass I, McLachlan AJ, Redfern J, et al.. Feasibility and cost-effectiveness of stroke prevention through community screening for atrial fibrillation using iPhone ECG in pharmacies: The SEARCH-AF study. Thromb Haemost 2014; 111: 1167–1176. [DOI] [PubMed] [Google Scholar]
- 10. National Institute for Heath and Care Excellence (NICE).. Cost impact of the WatchBP Home A used in a primary healthcare clinic environment. 2012. https://www.nice.org.uk/guidance/MTG13/documents/watchbp-home-a-for-diagnosing-and-monitoring-hypertension-and-detecting-atrial-fibrillation-eac-additional-analysis-cost-impact-in-primary-care2 (accessed April 10, 2020).
- 11. Wiesel J, Arbesfeld B, Schechter D.. Comparison of the Microlife blood pressure monitor with the Omron blood pressure monitor for detecting atrial fibrillation. Am J Cardiol 2014; 114: 1046–1048. [DOI] [PubMed] [Google Scholar]
- 12. Kearley K, Selwood M, Van den Bruel A, Thompson M, Mant D, Hobbs FR, et al.. Triage tests for identifying atrial fibrillation in primary care: A diagnostic accuracy study comparing single-lead ECG and modified BP monitors. BMJ Open 2014; 4: e004565. [DOI] [PMC free article] [PubMed] [Google Scholar]
- 13. Wiesel J, Fitzig L, Herschman Y, Messineo FC.. Detection of atrial fibrillation using a modified microlife blood pressure monitor. Am J Hypertens 2009; 22: 848–852. [DOI] [PubMed] [Google Scholar]
- 14. Stergiou GS, Karpettas N, Protogerou A, Nasothimiou EG, Kyriakidis M.. Diagnostic accuracy of a home blood pressure monitor to detect atrial fibrillation. J Hum Hypertens 2009; 23: 654–658. [DOI] [PubMed] [Google Scholar]
- 15. Wiesel J, Wiesel D, Suri R, Messineo FC.. The use of a modified sphygmomanometer to detect atrial fibrillation in outpatients. Pacing Clin Electrophysiol 2004; 27: 639–643. [DOI] [PubMed] [Google Scholar]
- 16. Gandolfo C, Balestrino M, Bruno C, Finocchi C, Reale N.. Validation of a simple method for atrial fibrillation screening in patients with stroke. Neurol Sci 2015; 36: 1675–1678. [DOI] [PubMed] [Google Scholar]
- 17. Verberk WJ, de Leeuw PW.. Accuracy of oscillometric blood pressure monitors for the detection of atrial fibrillation: A systematic review. Expert Rev Med Devices 2012; 9: 635–640. [DOI] [PubMed] [Google Scholar]
- 18. Tarakji KG, Wazni OM, Callahan T, Kanj M, Hakim AH, Wolski K, et al.. Using a novel wireless system for monitoring patients after the atrial fibrillation ablation procedure: The iTransmit study. Heart Rhythm 2015; 12: 554–559. [DOI] [PubMed] [Google Scholar]
- 19. Bumgarner JM, Lambert CT, Hussein AA, Cantillon DJ, Baranowski B, Wolski K, et al.. Smartwatch algorithm for automated detection of atrial fibrillation. J Am Coll Cardiol 2018; 71: 2381–2388. [DOI] [PubMed] [Google Scholar]
- 20. Suzuki S, Sagara K, Otsuka T, Kano H, Matsuno S, Takai H, et al.. Usefulness of frequent supraventricular extrasystoles and a high CHADS2 score to predict first-time appearance of atrial fibrillation. Am J Cardiol 2013; 111: 1602–1607. [DOI] [PubMed] [Google Scholar]
- 21. Powell AC, Landman AB, Bates DW.. In search of a few good apps. JAMA 2014; 311: 1851–1852. [DOI] [PubMed] [Google Scholar]
Associated Data
This section collects any data citations, data availability statements, or supplementary materials included in this article.
Data Availability Statement
The deidentified participant data will not be shared.


