

Summary
The subthalamic nucleus (STN) supports action selection by inhibiting all motor programs except the desired one. Recent evidence suggests that STN can also cancel an already selected action when goals change, a key aspect of cognitive control. However, there is little neurophysiological evidence for a dissociation between selecting and cancelling actions in the human STN. We recorded single neurons in the STN of humans performing a stop-signal task. Movement-related neurons suppressed their activity during successful stopping whereas stop-signal neurons activated at low-latencies near the stop-signal reaction time. In contrast, STN and motor-cortical beta-bursting occurred only later in the stopping process. Task-related neuronal properties varied by recording location from dorsolateral movement to ventromedial stop-signal tuning. Therefore, action selection and cancellation coexist in STN but are anatomically segregated. These results show that human ventromedial STN neurons carry fast stop-related signals suitable for implementing cognitive control.
Graphical Abstract

eTOC Blurb
Mosher et al. show that neurons in human dorsal STN participate in movement, while those in ventral STN respond to stop-signals. Stop-signal responses are fast, in line with a race-model of action cancellation, and in contrast to beta bursting that occurs late. Neural activity in STN supports a hyperdirect parcellation of STN into functional zones.
Introduction
The ability to cancel plans that no longer support our goals is a critical feature of cognitive flexibility. In the motor system, this manifests in the ability to cancel or inhibit actions already underway, such as stopping a movement towards a target. Computational models posit that brain circuits that inhibit actions (“stop pathways”) compete with circuits that promote actions (“go pathways”) and therefore an action can only be cancelled if activity in the stop pathway outraces activity in the go pathway (Boucher et al., 2007; Logan and Cowan, 1984; Schall et al., 2017; Schmidt et al., 2013). Physiologically, an instantiation of a go pathway in the human brain is the “direct pathway” that links motor cortex with the motor thalamus via the striatum and substantia nigra in the basal ganglia. Activation of this pathway releases motor thalamus from its state of constant inhibition and allows a movement to occur. A neurophysiological instantiation of a stop pathway that cancels movements when goals change has remained elusive, though is thought to involve connectivity between frontal cortex and the basal ganglia.
Recent evidence suggests that the subthalamic nucleus (STN) is the missing link (Alegre et al., 2013; Aron and Poldrack, 2006; Aron et al., 2003, 2014, 2016; Jahanshahi et al., 2015b; Obeso et al., 2014; Wessel et al., 2016; Wiecki and Frank, 2013). The STN excites the final output nuclei of the basal ganglia (globus pallidus internus, GPi; substantia nigra pars reticulata, SNr), thereby increasing inhibition of the motor thalamus (Jahanshahi et al., 2015b). Classically, the STN is placed in the “indirect pathway” through the basal ganglia. This multisynaptic pathway is slow compared to the direct pathway and is thought to play a role in terminating actions that have already been completed by the go-pathway, or in inhibiting unwanted motor programs that compete with the go-pathway (Mink, 1996; Nambu et al., 2002). Recently, a monosynaptic “hyperdirect pathway” from frontal cortex to STN has been identified (Chen et al., 2020; Haynes and Haber, 2013), leading to the hypothesis that frontal cortex (specifically right inferior frontal gyrus) can bypass the slower multisynaptic inhibitory pathway to directly activate STN more quickly than the go-pathway (Aron and Poldrack, 2006; Aron et al., 2003, 2014; Chen et al., 2020; Wessel et al., 2016). If this hyperdirect pathway is activated, it would lead to a widespread increase in inhibitory drive and rapidly cancel an action when a goal changes (Schmidt et al., 2013; Wessel and Aron, 2017).
While the STN has a rather homogenous cytoarchitecture (Yelnik and Percheron, 1979), physiological studies have segregated STN into somatotopic zones that receive input from different parts of cortex or basal ganglia (DeLong et al., 1985; Iwamuro et al., 2017; Keuken et al., 2012; Nambu et al., 1996; Rodriguez-Oroz et al., 2001). Anatomical tracing studies in macaques reveal that motor cortex projects to dorsal STN, while connections from frontal cortex terminate in ventral STN (Haynes and Haber, 2013). These observations lead to the overall hypothesis that dorsal regions support action selection and motor control, whereas ventral regions support higher cognitive functions such as stopping (Greenhouse et al., 2013; Jahanshahi et al., 2015a; Mallet et al., 2007). While electrical stimulation and local field recordings support this functional parcellation of action selection and cancellation (Chen et al., 2020), there is at present no single neuron evidence for this hypothesis in humans.
If the STN has anatomical zones that play distinct functional roles in movement and cognition, this would be of profound clinical significance. The STN is a routine target for deep brain stimulation (DBS) that alleviates the symptoms of movement disorders such as Parkinson’s Disease (Pouratian et al., 2012). A side-effect of such stimulation is an inability to inhibit impulsive behavior, which empirically has been associated with the placement of electrodes in ventral STN in regions thought to be involved in action cancellation (Chen et al., 2020; Greenhouse et al., 2013; Hershey et al., 2010; Jahanshahi et al., 2015a; Scherrer et al., 2020; van Wouwe et al., 2017). Electrical stimulation at more dorsal sites, in contrast, improves motor control with fewer cognitive side effects (Greenhouse et al., 2011, 2013). If neurons that support stopping have distinct firing features from movement neurons, this information could be utilized to design stimulation protocols that specifically inhibit specific cell types, which would be a major clinical advance.
It remains unknown whether this functionally segregated model of STN, which is contrary to the standard model of STN as a monolithic relay station that plays no role in cognition, is applicable to the human brain. Here, we recorded individual neurons in STN as humans performed a stop-signal task to determine (1) are there neural representations of stop or go pathways in the STN and (2) do these representations localize to distinct subfields of STN as would be predicted by a frontal-cortical hyperdirect pathway.
Results
Task and Behavior
We recorded single neurons from the human STN and field potentials (ECoG) from sensorimotor cortex as subjects performed a stop signal task during surgery for implantation of DBS electrodes to treat symptoms of Parkinson’s Disease (33 surgeries/sessions in 19 subjects, see Table S1). Subjects were instructed to move a joystick as quickly as possible in the direction of a go-signal (white arrows, Figure 1A) using the hand contralateral to the recording site (accuracy 87±11% on go trials). On 1/3 of trials, subjects were presented with an instruction to stop (or cancel) the planned action (red arrows, Figure 1A). The onset of the stop signal occurred at a variable delay relative to stimulus onset so that subjects successfully stopped on 44±25% of trials (Methods, Figure 1BC). We analyze four types of conditions: fast-go and slow-go trials (trials where a go-signal was followed by a fast or slow reaction time and the subject moved in the correct direction, respectively), successful-stop trials (stop trials in which the subject successfully stopped) and failed-stop trials.
Figure 1: Stop-signal task and recording setup.
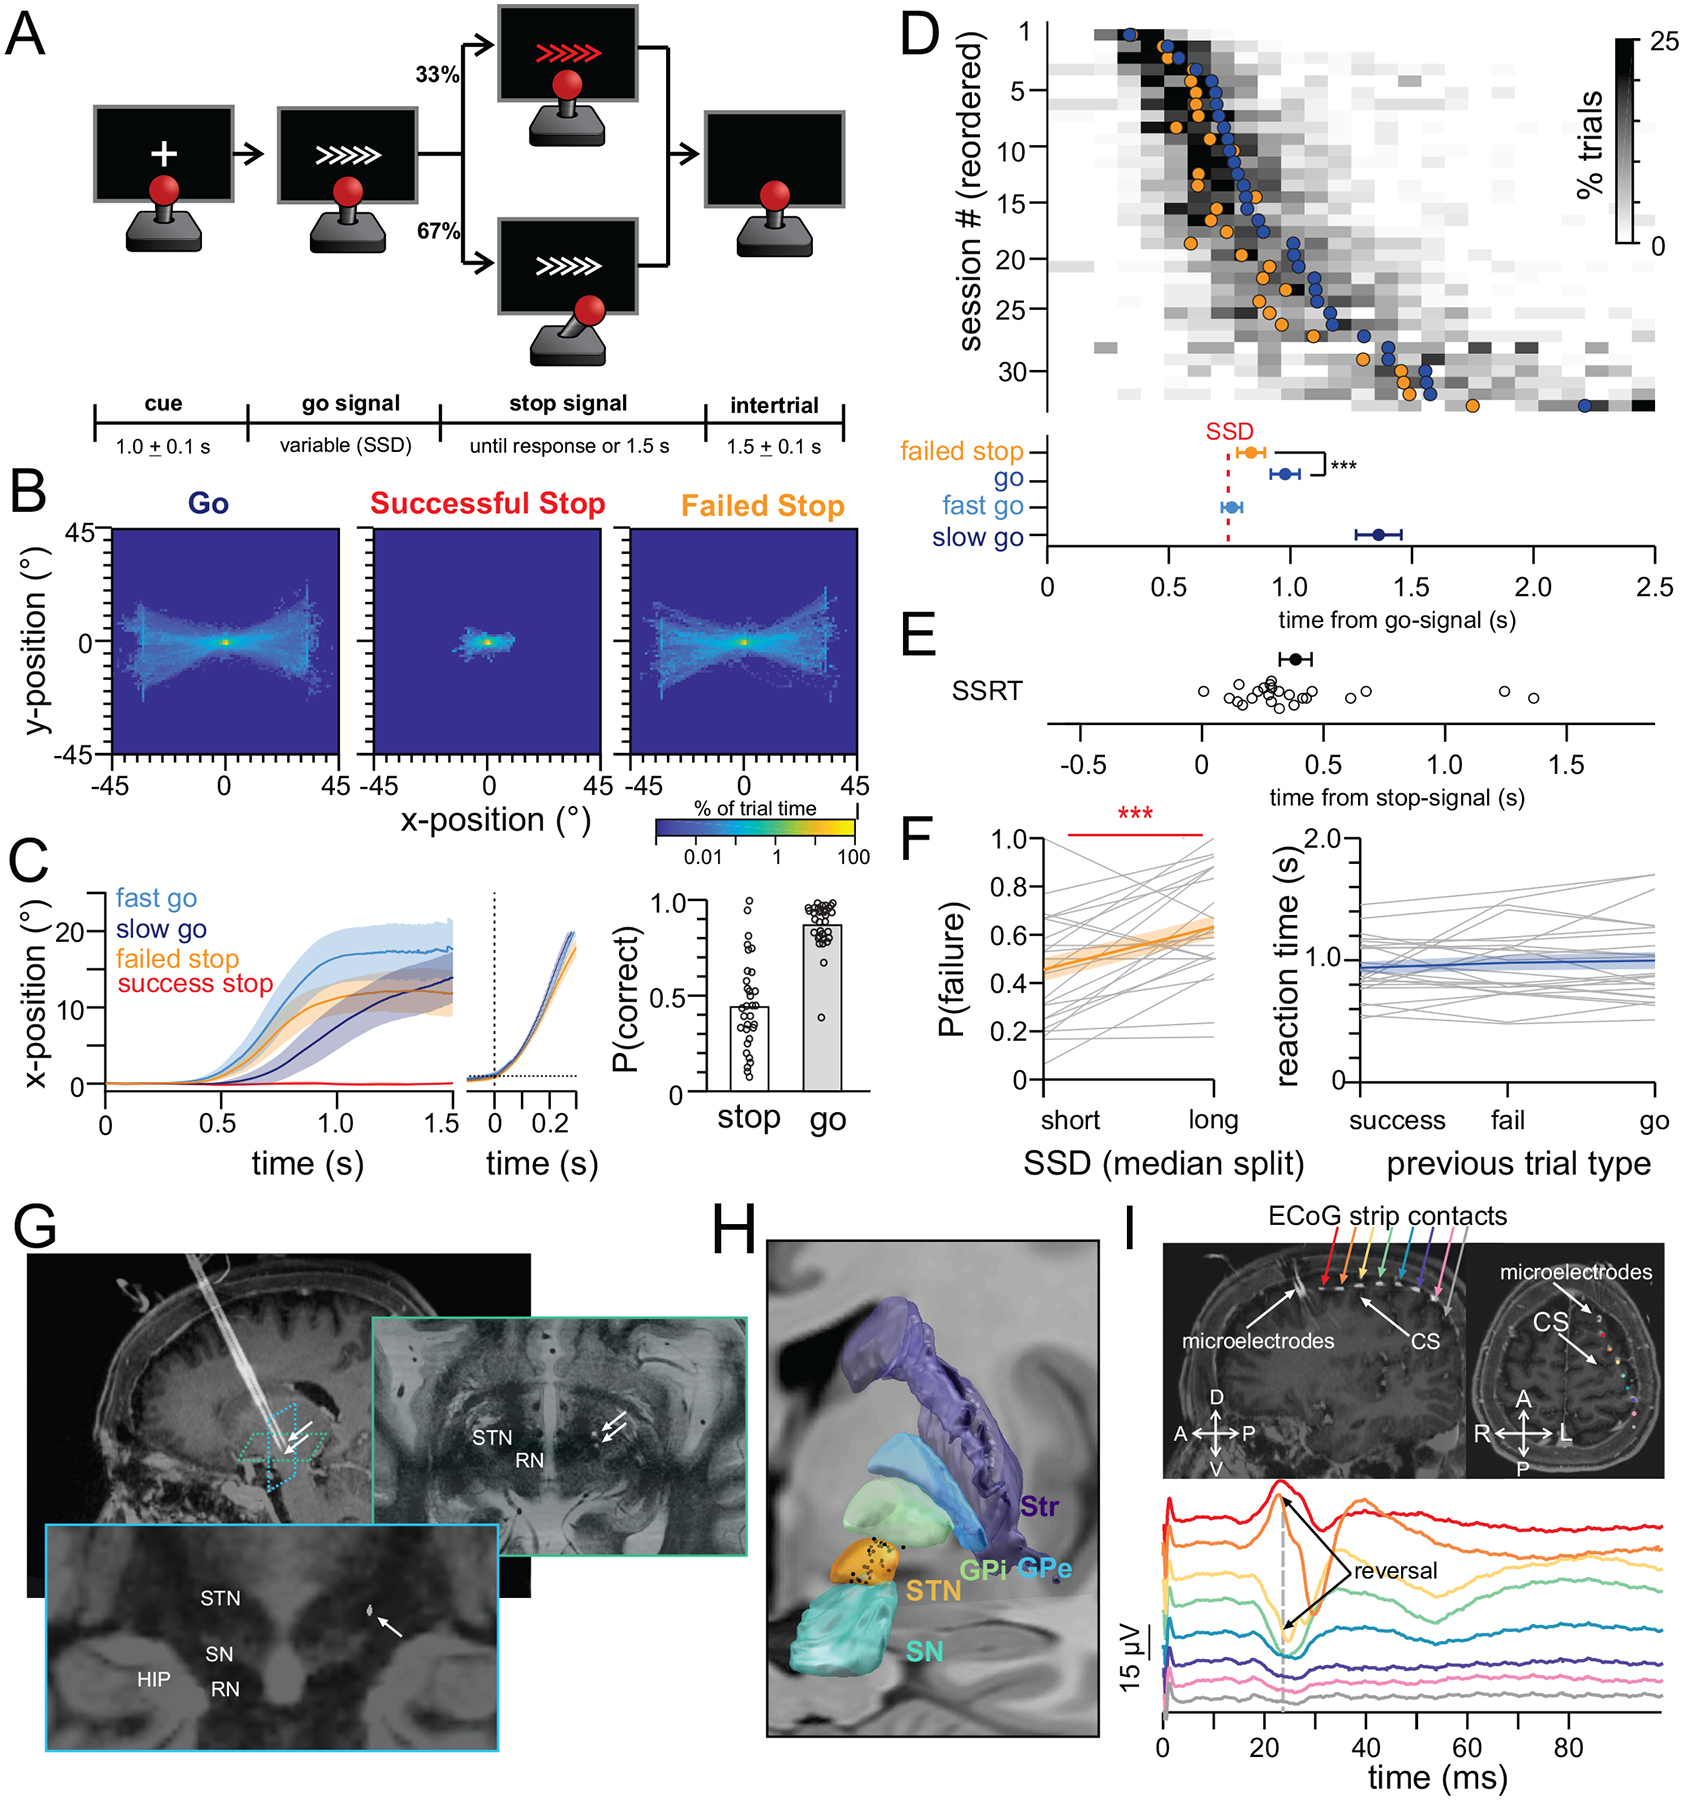
(A) Task. (B) Heatmap of joystick position across all subjects (negative = left/down). (C) Time-course of joystick trajectory aligned to onset of go-signal (left) and movement (middle). Horizontal dotted line = threshold for movement detection. Bar plot shows probability of successfully stopping on a stop trial and probability of moving in the correct direction on a go trial (each dot is a session). (D) Distribution of reaction times. Each row is a session. Gray heatmap shows binned reaction times across all trials (histogram). Filled circles are mean response times on failed stop trials (orange) and on successful go trials (blue). Population averages and s.e.m. depicted at bottom for each trial type. (E) Distribution of the stop-signal reaction times (SSRT), each circle is a session. (F) (left) Inhibition functions. (right) Absence of sequence effects. Reaction time on go-trials that follow a successful stop, a failed stop, or another go-trial. Gray lines are individual subjects. Blue and orange lines depict mean ± s.e.m. (G-I) Recording setup. (G) Intraoperative CT scan fused with pre-operative MRI showing two microelectrodes. Arrows indicate microelectrode tip in STN. (H) Reconstruction of STN recording sites (black dots=neurons, atlas=Ewert et al., 2018). (I) Intraoperative CT scan fused with pre-operative MRI showing the ECoG strip placed over sensorimotor cortex. Traces are sensorimotor evoked potentials elicited by median nerve stimulation. Each color is a different ECoG contact. *p<0.05, **p<0.01, ***p<0.001
Under a race model of stopping, trials with short-latency activation of motor plans are more difficult to cancel than trials in which the motor plan is initiated more slowly. Confirming this prediction, reaction times on failed-stop trials were shorter than the average reaction time on go-trials (mean difference in reaction time=140±10 ms; paired t-test t(23)=−7.01 p=3.8 × 10⁻⁷) (Figure 1D). The two key parameters in race models are the SSD (“stop signal delay”, time between stimulus onset and onset of stop signal) and the SSRT (“stop signal reaction time”, the latency of the stop process). The average SSD across the sessions was 480±236 ms. Inhibition functions showed that long SSDs increased the probability of failing to stop, in line with a race model of action cancellation (Figure 1F, left panel, comparison of short vs long SSD: paired t-test t(22)=3.75, p=0.0011; average P(respond) for short SSD=0.46±0.23; average P(respond) for long SSD=0.63±0.22). Based on the distribution of reaction times and the rate of successful stopping, we estimated the stop-signal reaction time (SSRT) to be 361±334 ms (Figure 1E, integration procedure, see Methods; (Verbruggen et al., 2019)). Lastly, we tested whether reaction times depended on the behavior in the previous trial. We found no such dependence: subjects responded with similar reaction times on go-trials that followed successful or failed stop trials (Figure 1F, right panel, paired t-test for reaction times following successful vs. failed stop: t(23)=0.88, p=0.388 ; successful stop vs. go: t(23)=1.09, p=0.285; failed stop vs. go: t(23)=0.56, p=0.579).
Neurons in dorsal STN were activated by movement
We recorded n=83 well isolated and stable neurons in STN while subjects performed the stop-signal task (Figure 1G,H show recording sites, on average 2.5±2.4 cells per session; sorting quality metrics in Figure S1). The activity of n=32/83 neurons (39%) were modulated when subjects moved the joystick (see example units in Figure 2A) (significantly greater than the proportion from bootstrapped shuffled data=8±3%; p<1/500 shuffles). These “movement-related” neurons fired on average 13.2±17.3 Hz during baseline, responded robustly around movement onset (average peak firing rate: 18.3±19.4 Hz, mean effect size=0.37±0.29 s.d.) and the majority (30/32, 94%) signaled movement onset with an increase in firing rate. Subjects responded with variable latencies following the go-signal, allowing us to align the neural activity to either the onset of the go-signal or the onset of the movement to assess which event better predicted neural activity. On average the neural activity was better explained by movement onset (and not the go-signal), suggesting that these neurons play a role in movement selection, execution, or sensorimotor feedback (Figure 2B, paired t-test comparison of peak firing rate aligned to movement vs. target, t(31)=3.980, p=0.000387). Movement neurons were consistently recorded across multiple subjects and recording sessions (Table S1).
Figure 2: Single neuron responses during the stop signal task.

(A) Raster-plots and peri-stimulus time histograms (PSTHs) of two movement-neurons. t=0 is onset of the go-signal. Trials are grouped by fast (light blue) and slow (dark blue) response times. Bottom trace shows average horizontal joystick position. Colored circle is a label indicating that this neuron is a movement-neuron (panel D). (B) Average normalized firing rate of all movement neurons, aligned to onset of the movement (pink) or the go-signal (black). Inset shows peak firing rate attained for each neuron for the two temporal alignments. (C) Response latency of movement neurons. (left) Time of peak firing rate after go-signal on trials with fast (light blue) vs. slow (dark blue) reaction time. (right). Neural onset time (light pink) and peak firing rate time (dark pink) relative to movement onset. (D) Distribution of response profiles. Of 83 neurons, 32 are movement responsive (left). 47 of these neurons were eligible for stop-related analysis (right). Each circle represents a neuron and is colored by the neuron’s response type. SS=successful stop. FS=failed stop. SG=slow go. FG=fast go. (E) Example stop-signal responsive neurons. Raster plots, PSTH, and joystick position aligned to stop-signal onset for successful (red) and failed (orange) stop trials. Fast go (light blue) and slow go (dark blue) trials are aligned to the timepoint when the stop-signal would have appeared had the trial been designated a stop-trial. (F-H) Decoding results from entire population of n=47 recorded neurons included in stop trial analysis. (F) Confusion matrix for classifier trained to decode movement from neural firing rates. Trace shows the probability the decoder predicted movement during the trial for each trial type. (G) Performance of a classifier trained to discriminate stop-signal trials from go-trials (t=0 is onset of stop-signal. Contours outline significant periods. Confusion matrices at two example time periods (S=stop, G=go). Traces show the probability the decoder predicted a stop-signal at different time points during the trial. (H). Anatomical location of movement (blue) and stop signal neurons (red) in STN (yellow outline). triangles=stop neurons that respond on both successful and failed stop trials. Black “X” ‘s = location of recordings inferred from example intraoperative image (Figure 1I), connect with a dotted line to location estimated from post-surgical reconstruction. Error bars show mean and quartiles of dorsal-ventral location. (AP slice=−14.06 mm). *p<0.05, **p<0.01, ***p<0.001
Movement-related neurons responded similarly to movements to the left or right (paired t-test comparing mean firing rate on left vs right movements for population of movement neurons, t(31)=0.696, p=0.492). We also compared firing rates during abduction (movement away from the body, move left with left hand) and adduction (toward the body). Firing rates did not differ significantly between these conditions (t(31)=0.765, p=0.450). Thus, the responses of movement-neurons were not sensitive to movement direction.
The majority of movement-related neurons (25/32, 78%, Figure 2C right panel) began to fire before the earliest detectable movement of the joystick, suggesting a role in the early aspects of movement production, e.g., selection, planning, execution. If movement neurons play a role in producing movements their responses should differ on trials with fast vs. slow reaction times. But neither the firing rate at baseline (500 ms prior to target onset), the firing rate at movement onset, nor the peak firing rate during movement was predictive of reaction time (t-test comparing mean firing rates for fast vs. slow go trials; baseline: t(31)=0.238, p=0.814; movement onset t(31)=0.862, p=0.395; peak rate t(31)=0.738, p=0.466). However, the time-course of activation revealed that when reaction times were fast, movement-related neurons attained their peak firing rates earlier in the trial (paired t-test comparing response latencies on fast vs slow trials: t(31)=3.876, p=0.000523, mean difference in neural response time=364±250ms) (Figure 2C, left panel). Models of action selection suggest that movement-related neurons ramp to a threshold required for movement activation; when neurons ramp to this threshold more quickly the movement is executed earlier (Hanes and Schall, 1996; Schall, 2019). Indeed, neurons ramped to threshold faster on trials with fast reaction times (t-test comparing the rising slope of the PSTH on fast and slow trials for movement-neurons, t(24)=2.458, p=0.022) (Figure S2). This time-course of activity suggests that the movement-related neurons played a role in selecting or executing movements, a feature of the go pathway.
Stop-signals activated neurons in ventral STN and reduced the activity of movement-related neurons.
Of the 83 recorded STN neurons, 47 neurons met criteria for stop-related analysis (at least 5 successful-stop and 5 failed-stop trials; Figure 2D). We first examined the subset of these neurons (23/47 (49%)) that satisfied criterion as movement-neurons (described above). As expected of neurons that play a role in action selection/execution, movement neurons reduced their firing rate when subjects successfully stopped (paired t-test comparing mean firing rate on successful stop vs. slow go trials: t(23)=2.34, p=0.028). In contrast, their firing rate did not differ significantly between failed stop trials and fast go trials (paired t-test comparing mean firing rate on failed stop vs. fast go trials: t(23)=1.39, p=0.177), consistent with a role in movement. Indeed, a population decoder trained on the activity of all recorded neurons (n=47) accurately predicted when movement occurred, and when it was cancelled (Figure 2F, 66 % accuracy, significantly better than chance; chance performance based on shuffled bootstrapped labels= 50+1%; p<1/1000 shuffles). This decoder predicted movement on all trials (indicative of a plan to move), but only switched to predicting no movement when a subject successfully stopped (Figure 2F, red trace).
We next examined whether any neurons responded to the stop-signal, as would be required if the STN plays a role in action cancellation. Of the 47 neurons, 10 (22%) significantly changed their firing rate following the onset of the stop signal compared to a pre-stop signal baseline (Figure 2E shows examples, significantly greater than chance=5+3%; 500 shuffled data trials, p<1/500). The onset of activity for these “stop-signal responsive neurons” was 391±279 ms after the appearance of the stop signal, which is within the timeframe of the SSRT (mean SSRT= 361±334 ms; two sample t-test comparing stop-signal response latencies and SSRTs: t(33)=0.253, p=0.802). Five neurons (11%) met the strict criteria of significantly differentiating both successful stop trials from slow go trials and failed stop trials from fast go trials (first three examples in Figure 2E) (significantly greater than chance=1+1%; 500 shuffled data trials, t(499)=9.5, p=1.9 × 10⁻¹⁹, 4/5 of these neurons also met classification for stop-signal responsive). These five neurons registered a stop-signal regardless of trial outcome (success or failure to stop), a property expected from neurons in the stop pathway. Many of the stop-signal responsive neurons (n=7/10) were also movement responsive, suggesting an interaction between the stop and go-pathways within the STN (a property we address in the Discussion and Figure 5). In most instances, the modulation of activity by movement was weak relative to that by the stop signal (see Figure 2E, Cells 96.1.2350 and 102.2.995 for examples), where in the remainder the modulation by movement was strong (see Figure 2E, cells 65.1.2061 and 68.1.8346). The distribution of stop response profiles is illustrated in Figure 2D. Stop-signal neurons were identified across multiple subjects and sessions (see Table S1).
Figure 5: Proposed mechanism of action selection and cancellation in STN.

(left) STN supports action selection by inhibiting motor programs that compete with the desired action (blue pathway in center-surround). (right) During cancellation, frontal cortex activates a subset of STN neurons (red pathway) some of which are in the surround and others that are in the center (gray neuron), causing rapid inhibition of all motor programs (For simplicity, pallidal and nigral connections are not shown in these plots and only the net effect on thalamus is displayed).
We next trained a single-trial classifier on the entire population of neurons (n=47) to differentiate between trials with and without a stop signal. Figure 2G (left) shows the performance of the decoder with contour lines outlining areas where the decoder performed significantly better than chance (see Methods). The decoder differentiated stop trials from go trials during an early (less than 500 ms) and late period (> 1 s) after the appearance of the stop-signal. During the early period, the probability of decoding a stop signal rapidly increased, regardless of the outcome (success or fail) of the stop trial (Figure 2G, right side, top traces). This result suggests that the STN registered stop-signals, irrespective of the eventual motor output, which is a signal required to initiate cancelling actions. In contrast, the late component (Figure 2G, right side, bottom traces) differentiated successful stop trials from other trial types, marking the termination of the stopping process.
Last, we compared the anatomical position of movement and stop-signal neurons to test the hypothesis that different parts of STN participate in different behaviors. Stop-signal responsive neurons in the STN were located significantly more ventrally in the STN than movement-related neurons (Figure 2H; dorsal-ventral MNI coordinate of stop signal neurons= −7.6±1.5 mm; movement-related neurons= −6.4±1.4 mm; two-sample t-test t(40)=2.57 p=0.0139). This anatomical localization was robust for up to 3 mm (in units of s.d. of a normal distribution) in registration error (Figure S3A–C). These data support the hypothesis that processes of action selection (movement) and action cancellation (stop-signal) are supported by neural populations located in distinct parts of the STN.
Beta bursting occurs late in the stopping process
Simultaneously with the single neuron recordings in STN we recorded local field potentials (LFPs) from the microelectrode tip in STN and iEEG signals from sensorimotor central sulcus (central sulcus identified by sensorimotor evoked potentials, see Methods, Figure 1I). As expected, single neurons in STN fired at a beta rhythm (Shimamoto et al., 2013; Yang et al., 2014), especially during bursts of beta activity in STN and sensorimotor central sulcus (Figure 3A,B). 21/83 (25%) neurons showed significant beta peaks in their autocorrelogram of the spike train (see methods; (Amirnovin et al., 2004; Raz et al., 2000)). Overall, movement and stop-signal neurons had a similar propensity to fire at beta throughout the course of the experiment (7/32 (22%) movement neurons; 2/10, (20%) stop-neurons). However, during timepoints when a beta burst occurred in motor central sulcus, only movement neurons showed increased entrainment to the beta rhythm (Figure 3C; t-test comparing average beta spike-train power during vs. outside beta bursts: movement neurons: t(31)=2.9, p=0.006; stop-signal neurons t(9)=1.56, p=0.15; non-responsive neurons: t(47)=1.18,p=0.24). This result suggests that motor cortical beta bursts are specifically linked to beta firing in movement neurons. Interestingly, the only two stop-signal neurons with significant beta firing also happened to be movement-responsive and reduced their firing during stopping (Figure 2E, two example stop-signal neurons shown at far right).
Figure 3: Beta activity of STN neurons changes after SSRT.

(A) Autocorrelogram of the spike train of an example STN neuron during beta bursts in motor cortex (purple) or in the absence of beta bursts (gray). (B) Average difference in the power spectrum of all neuron spike trains (n=83) during beta bursts vs. outside beta bursts. (purple) motor cortex beta bursts, (black) STN beta bursts. Bars denote significance from 0; p<0.05) (bottom). (C) The mean spike-train beta power for different types of neurons (gray=non-responsive, blue=movement-related, red=stop-signal). Power calculated inside vs. outside beta bursts for motor cortex (left) and STN (right). (D) Probability of a beta burst in motor cortex (left) or STN (right) during the task. Horizontal bars = timepoints when beta burst probability significantly differed between successful stop trials and other trial types. Shading=s.e.m. (E) Differential latency analysis comparing the response time of stop-signal neurons and beta bursting on successful stop trials vs. latency matched slow go trials. Shading=s.e.m.
The observation that beta field activity is elevated when subjects are not moving has led to the hypothesis that beta firing could be a mechanism of stopping (Cagnan et al., 2019; Feingold et al., 2015; Torrecillos et al., 2018; Wessel, 2020). In line with other studies, we found that the probability of beta bursts in STN and sensorimotor cortex increased after stop-signals on successful stop trials (Alegre et al., 2013; Benis et al., 2016; Wessel et al., 2016) (Figure 3D, Figure S4). However, the time at which beta bursting increased on stop-trials was relatively late (Figure 3E), thereby calling into question whether this beta activity played a role in initiating stopping. We determined the earliest detectable onset of increased beta burst activity after the stop-signal (cluster-wise comparison, see methods, (Maris and Oostenveld, 2007)) to be 1,018±662 ms in STN and 984±819 ms in cortex, significantly later than the mean SSRT and the response latencies of stop-signal neurons (two-sample t-test comparing latencies of stop neurons vs. STN beta: t(42)=4.26, p=0.00011; latencies of stop neurons vs. ECoG beta: t(16)=2.15, p=0.047; latencies of STN beta vs SSRT: t(35)=5.13, p=0.000011; latencies of ECoG beta vs SSRT: t(31)=3.11, p=0.004). Since the earliest detectable onset could not be detected for every neuron we, in addition, used a binless differential latency method. This method (Xiang & Brown, 1998; Rutishauser et al., 2015) similarly revealed that stop-signal neurons began to fire 372 ms after the stop-signal, whereas the probability of an increase in motor cortex beta burst was significantly later at 1,349 ms (Figure 3E). It is generally thought that the stopping process needs to be initiated before the SSRT. Since our results indicate that beta burst increased significantly later than the SSRT, we conclude that modulations in beta activity were unlikely to be the mechanism that initiated stopping. Instead, we hypothesize that the stopping process was initiated by the stop-signal neurons we described, whose response starts within the timeframe of the SSRT.
Neural spike train features predict recording location in STN.
The average anatomical location of stop-signal neurons was more ventral than movement neurons (Figure 2H), suggesting that if a neuron’s location is known, one might be able to predict its response type. But what about the reverse? Can an individual neuron’s firing properties be used to decode its location? We calculated a variety of firing features, including each neuron’s synchrony with beta field potentials and modulation by the task and used classifiers to predict recording location (see Methods).
First, we reduced the dimensionality of the feature space with principal component analysis and varimax rotation. The first 4 principal components (PCs) explained 71% of the variance in the features (Figure 4A). Feature weights showed that spike-train features mapped onto PCs 1 and 4 (PC1= rate, LV and CV; PC4=burstiness and waveform), while task and field-synchrony features mapped onto PCs 2 and 3. PC 3 described movement features and beta spike-field synchrony, while PC 2 described stop-related features (Figure 4A).
Figure 4: Spike-train characteristics of STN neurons vary along a dorsolateral-ventromedial anatomical axes through the STN.

(A) First four principle components of PCA applied to single unit firing features. (rate=mean firing rate; waveform=narrow or wide; LV=local variation; CV=coefficient of variation; burstiness=burst index based on autocorrelogram; beta firing=power of spike-train in beta range; move, stop-signal, stop-success, and stop-fail= effect sizes of neural firing rate changes during the task) (B) (left) Correlation between the factor scores of the neurons and their position along different anatomical axes through the STN. (right) Anatomical axis corresponding to PCs 2 and 3 (red and blue lines). Arrows indicate direction of increasing component scores. White lines = trajectory of each microelectrode. (C) Values of each feature (mean±SEM) in the dorsolateral or ventromedial region of STN (D) (left) Performance (confusion matrix) of an SVM classifier trained to discriminate DL from VM locations of neurons based on (C), tested on left out neurons. (right) The average feature weights of the SVM classifier.
To identify which, if any, of the PCs described anatomical space in STN we correlated the component scores of the neurons with their location along anatomical axes through STN (see Methods). Two anatomical axes significantly correlated with PCs 2 and 3, the task related components (linear regression, p<0.05) (Figure 4B). The scores along the movement axes (PC3) decreased from dorsolateral-to-ventromedial along this anatomical axis, whereas the scores along the stop axes (PC2) increased (Fig. 4B). Intriguingly, these anatomical axes that described stop and movement activity, ran approximately perpendicular to the tracts traversed by recording electrodes (white lines, Figure 4B, right; Video S1). This indicates that the depth along the recording track is not necessarily a good differentiator between these two types of STN functions.
The PCA-based analysis implies that firing features of neurons could be used to predict anatomical recording location. Indeed, a classifier trained on firing features predicted with 79% accuracy whether a neuron was in dorsolateral or ventromedial STN (Figure 4CD; chance=50±11%, p<1/1000). Importantly the classifier was specific to the optimal axes through the STN and performed at chance when a different dorsal-ventral axis was used (Figure S3DE).
Together, these set of analysis suggest that neuronal firing features describe anatomical subfields in STN with dorsolateral regions playing a role in motor function and ventromedial regions playing a role in stopping.
Parkinsonian state
Patients with low (21±8) and high (47±16) UPDRS III scores, a standard neurological test of motor control, performed similarly on the task. They did not differ in their behavioral response, their SSRTs, or their response accuracy (Table S2). There was an equal likelihood of recording movement neurons in patients with low or high UPDRS scores (P(movement neuron)= low: 0.35±0.20; high= 0.41+0.22; t(14)=0.441, p=0.67), as well as stop-signal neurons (P(stop signal neuron)=0.17+0.26; 0.19+0.27; t(11)=0.06, p=0.95). None of the firing rate features of the neurons, the spike-field beta synchrony, or the task responsiveness significantly varied among the two groups (Table S2). These results suggest that the behavioral responses and the neural responses during the stop task were unlikely to be explained by Parkinsonian state.
Discussion
The discovery of hyperdirect pathways has sparked a breadth of new research positing a broad role of the STN in selecting (Frank, 2006; Zaghloul et al., 2012; Herz et al., 2016), canceling (Aron and Poldrack, 2006; Chen et al., 2020; Pasquereau and Turner, 2017; Schmidt et al., 2013), switching (Isoda and Hikosaka, 2008; Jantz et al., 2017; Pasquereau and Turner, 2017), and pausing actions (Dutra et al., 2018; Fife et al., 2017) through activation of a stop pathway. Here, we show that the human STN participates in selecting and cancelling movements at the level of single neurons. The properties of these neurons vary systematically along a dorsal-ventral axis of the STN. We further show that stop-related activity occurs sufficiently quickly to play an active role in stopping, whereas the typically hypothesized increases in beta activity do not.
Race models of action cancellation propose that activity in a “stop-pathway” rapidly increases after a stop-signal (Boucher et al., 2007; Schmidt et al., 2013; Wiecki and Frank, 2013). Here we identified neurons in the STN with response properties consistent with the stop pathway. Stop-signal neurons fired shortly after the appearance of the stop-signal regardless of success in stopping. Similar neurons have been observed in the STN of mice (Schmidt et al., 2013) and macaques (Pasquereau and Turner, 2017), but have so far not been shown in humans. This across-species commonality suggests a shared mechanism of stopping, a fact supported by the observation that different species exhibit similar behaviors during the stop-signal task (Kornylo et al., 2003; Middlebrooks and Schall, 2014). Nevertheless, different species exhibit different reaction times. For example, in highly-trained monkeys, stop-signal neurons fire about 250 ms earlier than in humans (Pasquereau and Turner, 2017) vs. present study).
Neurons that are activated by stop-signals have been previously reported in humans (Bastin et al., 2014; Benis et al., 2016). However, these cells were only activated by successful (and not failed) stop trials, a profile of a response not compatible with neurons in the stop pathway. In contrast, in our data, only 2% of neurons met these criteria of only being activated by successful stop trials; a larger portion (11%) registered the appearance of a stop signal regardless of whether subjects stopped or not. Note that while we recorded relatively few stop-signal related cells (10/83), this proportion is expected given the tendency for recordings to be in more dorsal STN (where such neurons are more rare) and is similar to the proportion of such cells observed in macaque STN (n=14 stop cells in monkeys, 8% of the recorded population in the study of (Pasquereau and Turner, 2017)). Together with this prior study, our data indicate that these stop-neurons are rare compared to other types of STN activity.
Although models of stopping emphasize the role of the STN in the “stop pathway” (Schmidt et al., 2013; Wiecki and Frank, 2013), here we also observed neurons involved in movement. These neurons are part of the “go pathway” (Georgopoulos et al., 1983; Lipski et al., 2017; Pasquereau and Turner, 2017; Pötter-Nerger et al., 2017). Most of our movement-related neurons began to fire prior to movement onset, supporting a role in the “go-pathway”. The majority of these neurons didn’t achieve peak firing rates until after the movement started. From the point of view of a threshold-model of action selection/execution, this pattern of activity is unexpected. However, most threshold-models are based on a ballistic movement, e.g., a saccadic eye-movement or button press. In contrast, our subjects used a joystick to respond. The early response of movement-related neurons might thus reflect a role in action selection while later responses might reflect proprioceptive feedback and/or updating of the motor plan, a hypothesis that will have to be verified in future experiments. Our data support the view that “stop” and “go pathways” in the STN are intermixed, e.g., as in an interactive race model (Boucher et al., 2007; Calabresi et al., 2014).
An increase in beta activity in the local field potential is thought to be a mechanism to implement stopping (Alegre et al., 2013; Bastin et al., 2014; Ray et al., 2012; Wessel et al., 2016). Contrary to this prediction, we found that increases in beta activity appeared too late to be able to initiate stopping. We conclude that the elevated beta activity seen during successful stopping reflects either the termination of the stop process or maintenance of the stop process rather than the detection of the stop signal itself. Instead, only the activity of stop-signal neurons was fast enough to be able to initiate stopping. This observation is in line with results reported by Chen et al. (2020), where beta activity only increased after the stop process has been enacted (estimated as the stop-signal reaction time). Instead, they found a short-latency evoked response that was a hallmark of stopping, which is thought to be triggered by input through the hyperdirect pathway originating in frontal cortex. We hypothesize that this evoked response represents the summed activity of the synchronous synaptic input to the stop-signal neurons in STN reported in our study. Indeed, Fischer et al (2017) demonstrated that gamma activity, a potential signature of synchronous neural firing, rapidly increases in STN after a stop-signal with no changes in STN beta bursting.
How can an increase in firing rate in the STN, which is a nucleus with exclusively excitatory output (Smith and Parent, 1988; though it does contain inhibitory interneurons (Lévesque and Parent, 2005)), cause both moving and stopping? One possibility is that neurons in STN project to different targets, e.g., stop-related neurons might directly excite SNr/GPi, while movement-related neurons might excite GPe (DeVito et al., 1980; Jantz et al., 2017; Joel and Weiner, 1997; Parent and Smith, 1987). Another possibility is that the activity of movement-neurons doesn’t reflect the excitation of the desired motor program, but instead reflects inhibition of competing motor programs, which in turn aids in the selection of the desired program (Figure 5). In this center-surround model of STN function (Mink, 1996; Nambu et al., 2002), increased activity of the STN reflects the “surround” inhibition of competing programs while those in the direct pathway (bypassing STN) reflect the “center” excitation of the desired program. Compatible with this view, we found that movement-related neurons in STN were insensitive to movement direction. When stop-signal neurons fire, they may specifically inhibit the originally intended motor program or, as recently proposed, globally inhibit all motor programs (including the desired one) (Wessel and Aron, 2017; Wessel et al., 2016). This latter view explains why some stop-signal neurons are activated by movement while others are not. A stop-neuron in the “surround” will inhibit competing motor programs during action selection and cancellation, while a stop-neuron in the “center” will only inhibit the desired program during cancellation and is not activated during movement.
Tract tracing studies in monkeys have revealed that different parts of the STN receive hyperdirect input from distinct cortical regions (Haynes and Haber, 2013). A tripartite model divides STN into motor, associative, and limbic regions that are thought to play distinct roles in action selection, cognition, and emotion (Ewert et al., 2018; Greenhouse et al., 2011, 2013; Mallet et al., 2007; Nassery et al., 2016). Our data provide support at the single-neuron level for such a parcellation in humans. In line with other studies (Starr et al., 2003; Theodosopoulos et al., 2003), movement-related neurons predominantly clustered in dorsal STN. Stop-signal neurons were localized more ventrally, similar to macaques (Pasquereau and Turner, 2017). Inputs from right inferior frontal gyrus, the most likely cortical candidate for cancelling actions (Aron et al., 2016), is thought to terminate in STN more ventrally (Chen et al., 2020; Haynes and Haber, 2013).
We did not observe significant differences in the behavior or the single neuron activity in patients with high vs. low UPDRS III scores. While at first surprising, other studies have shown that DBS, which typically lowers UPDRS scores, can lead to widely different patterns of reaction times and SSRTs in the stop signal task (Ray et al., 2009; van den Wildenberg et al., 2006). While a UPDRS III score does not necessarily differentiate the dominant motor features of disease in each individual, given the fluctuating nature of Parkinson disease, the variable use of medications by patients before surgery, and similar variables, the UPDRS III score provides a reasonable single metric to suggest that the underlying disease itself had relatively little impact on our findings. Future experiments with a different patient population (e.g., cervical dystonia) are needed to reveal the extent to which STN firing properties vary among different subject pools.
Single unit studies in STN have suggested that movement-related firing features (Starr et al., 2003), oscillatory firing patterns (Shimamoto et al., 2013), or bursty firing features (Kaku et al., 2019; Seifried et al., 2012) vary between subfields of the STN and can therefore be used to guide placement of DBS electrodes that provide therapy for motor disorders. Our classifier was able to predict the recording location of a single neuron based on firing features and task parameters. In addition to the task-related responses, non-task related features also contributed to the prediction of location. These features could thus be used to help better target electrodes (e.g. Zhang et al., 2020), especially since the axis that explains the most variance in neural firing is almost orthogonal to the trajectories of our electrodes. Of note, the location of neurons in the most ventromedial region of STN (which were non-responsive during the stop-signal task) could be accurately decoded. Based on a hyperdirect parcellation of STN, these neurons might represent the limbic domain. Future experiments are needed to determine whether these neurons are activated by tasks such as error monitoring, reward valuation, emotion, and anxiety (Fu et al., 2019; Gourisankar et al., 2018; Wagenbreth et al., 2019). More broadly, from a clinical perspective, the anatomical variation we have shown along the dorsolateral-ventromedial direction may explain why stimulation in ventral STN improves tremor in Parkinson Disease but also results in impulsive behavior (Ballanger et al., 2009; Hershey et al., 2010; Voon et al., 2017).
STAR Methods
Resource Availability
Lead Contact
Further information and requests for resources should be directed to the Lead Contact, Ueli Rutishauser (ueli.rutishauser@cshs.org).
Materials Availability
This study did not generate new unique reagents.
Data and Code Availability
The data generated in this study will be made available on Open Science Framework (https://osf.io/jd5uc) upon publication (DOI 10.17605/OSF.IO/JD5UC).
Experimental Model and Subject Details
Electrophysiological signals were recorded intraoperatively from patients with Parkinson Disease undergoing surgery for the implantation of a Deep Brain Stimulating device. A total of 19 subjects (33 sessions/surgeries) volunteered to participate in this study (see Tables S1 for demographics, age at time of recording = 68±7 years, UPDRS III score off medication, pre-DBS treatment: 33±18, n=8 females). Subjects often performed two sessions of the task, during surgery for each side of the brain leading to 33 total sessions. 5 sessions were excluded from analysis because the patient was unable to complete the task (n=1) or we were unable to isolate stable neural recordings (n=4), leaving 28 sessions for analysis. Subjects were off their Parkinson medication for at least 12 hours prior to surgery. All subjects gave informed consent and all protocols were approved by the Institutional Review Board of Cedars-Sinai Medical Center.
Method Details
Task
Subjects performed a stop-signal task (Aron and Poldrack, 2006; Verbruggen et al., 2019). On each trial the go-signal (white arrows) appeared on a computer monitor instructing the subject to move a joystick (Thrustmaster T16000M, Thrustmaster, Hilsboro OR) left or right (Figure 1A). Subjects performed the task with the hand contralateral to the recording site. On a random subset of 33% of trials a stop signal appeared (red arrows) following the go signal at a variable delay. The stop signal delay (SSD) was initially set to 300 ms and was then automatically titrated using an adaptive staircase method to achieve a ~50% rate of successful stopping. If a subject was successful on a stop trial, the SSD was increased by 50 ms on the subsequent stop trial; if they failed to stop the SSD was reduced by 50 ms. During the experimental recording, a trial was registered as a movement if it exceeded a pre-defined threshold (20 degrees of the total extent of the joystick). On go trials, the trial turned to a blank screen after 1.5 seconds or after a movement was detected, whichever came first. On stop trials, the trial was terminated after 1.5 seconds if no movement was detected. At the termination of a trial, the screen went blank and was followed by a 1 s intertrial interval. No trial-by-trial feedback was provided. Subjects were trained to perform the task pre-operatively (20–30 trials). They were instructed to “move the joystick in the direction of the white arrows as quickly as possible and, if the arrows turned red, to treat it like a stop-light and attempt to stop performing the movement.” Subjects performed 120 trials during surgery (40 stop trials total, a break was given midway through the session). The task was implemented in MatLab (Mathworks, Natick MA) using Psychtoolbox (Brainard, 1997)_.
Electrophysiology
Micro-electrode recordings of single neuron activity were performed during anatomical mapping of the STN during surgical implantation of a Deep Brain Stimulating device (for surgical details and target mapping see (Kamiński et al., 2018). Micro-electrodes (Alpha Omega microelectrodes, STR--009080-00) contained a micro-wire at the tip and a larger macro-contact 3 mm above the tip. Throughout the paper we analyze the single unit activity and local field potentials from the micro-wire. In each session, 1 microelectrode was placed along the target trajectory and a second electrode was placed in a Bengun array either 2 mm medial/lateral or anterior/posterior. Electrodes were grounded and referenced to the guide cannulae placed 25 mm above the target site. The broadband 2 Hz–44 kHz signal was recorded using an NeuroOmega system (Alpha Omega Inc.). The two microelectrodes were advanced simultaneously in 1 mm steps while monitoring single neuron activity and comparing it to the expected trajectory determined by surgical imaging. Upon approach to the STN, the speed of the electrode was reduced to 0.1–0.5 mm/step and single neurons were monitored. When we detected single unit spiking on at least one of the micro-electrodes we waited at least one minute to ensure the spike amplitude remained stable before beginning the experiment. Following the experiment, the electrode was further advanced below target to identify the location of the substantia nigra pars reticulate (SNr), a lower boundary of STN. We used electrical stimulation of SNr (30 uAmp train at 200 Hz), which reliably leads to a pause in firing rate to further confirm the lower boundary of the STN (see Kamiński et al., 2018; Lafreniere-Roula et al., 2009).
An ECoG strip (AdTech IS08RSP10X-0T1, 8 contacts, 10mm contact spacing,) was inserted subdurally as published previously (Kaminski et al., 2018) to record intracranial EEG signals over sensorimotor cortex. ECoG recordings were referenced to a needle placed in the skin over the mastoid process and grounded with a surface electrode at the same location. iEEG signals were recorded with a 2–350 Hz bandpass filter, simultaneously with the recordings obtained from the mircoelectrode. We refer to recordings made from the subdural strip electrodes as iEEG.
Electrode localization
Recording locations of single neurons were determined by fusing pre-surgical MRIs with a post-surgical CT scans to visualize the location of the DBS electrode. First, the post-surgical CT scan was co-registered with the pre-operative MRI scan (6DOF transformation using BRAINS registration, 3D slicer (Fedorov et al., 2012). The tip of the DBS electrode was marked manually on the CT-scan (last CT trace with visible contrast) and traced along each slice of the axial CT. This generated a cloud of points that marked the trajectory of the DBS electrode. We fit a line to this cloud of points by using principal component analysis: PCA was applied to the marked locations, the marked locations were projected onto the first principal component to identify the main axis, and we constructed a normal vector along this axis with its origin at the electrode tip. This normal vector describes the axis of the DBS electrode. The recording electrode is along the same trajectory as this normal vector but may be driven to a different depth or placed at a different medial-lateral or anterior-posterior location in the ben gun array (notes were made during surgery to record this offset). To determine the medial-lateral position we calculated a second normal vector that was orthogonal to both the DBS electrode vector and to the plane that defines patient midline. A third normal vector that was orthogonal to both these vectors described the anterior-posterior position and completed the basis used to determine the microelectrode recording sites. The position of a neuron in electrode space (e.g. 1 mm deep relative to the DBS electrode and 2 mm lateral) is multiplied by this basis to determine its position in native patient space. To co-register data across patients, we used an MNI coordinate system. The patients MRI was aligned to the 2009b NLIN Asym ICBM template brain (Fonov et al., 2009) using an affine transformation followed by a symmetric image normalization (SyN) diffeomorphic transform (Freesurfer, Dale et al., 1999, http://surfer.nmr.mgh.harvard.edu/). We then applied these transforms to the neuron coordinates in native patient space to obtain the coordinates in MNI space. Locations of neurons are plotted together with the DISTAL atlas specialized for subcortical structures targeted in DBS surgery (Ewert et al., 2018; Horn and Kühn, 2015; Lead DBS). All analysis related to anatomical location of recorded neurons was performed in standardized MNI space.
During the recordings, iEEGs from the ECoG strip were referenced to an electrode placed in the skin near the mastoid process. The location of the electrodes in the brain was determined by identifying a reversal in the polarity of the evoked potential in the iEEG caused by stimulation of the median nerve of the contralateral hand (20 – 30 mA, Cadwell Elite system). This method (Allison, 1987; de Hemptinne et al., 2013; Kamiński et al., 2018) has previously been used to reliably identify the orientation of contacts anterior to and posterior to the central sulcus. For analysis, we performed bipolar referencing by calculating the difference in the signal recorded by adjacent pairs of contacts. We refer to the bipolar pair where the reversal took place as the central sulcus (CS) (e.g. if the reversal occurred between electrodes 2 and 3 during the recording, as in Figure 1I, the bipolar pair 2–3 was labeled CS). The pair immediately anterior to the CS was identified as motor cortex.
Quantification and Statistical Analysis
Behavior
Trials were categorized as “successful stop” trials if the joystick remained within the detection threshold for at least 1.5 seconds. Stop trials where movement was detected were considered “failed stop trials”. During our analysis we noticed that sometimes subjects moved the joystick on stop trials but returned the joystick to center before reaching the detection threshold set in the experiment (20 degrees). We decided that these trials with a small amount of movement should be considered failed stop trials post-hoc for analysis purposes. For analysis we thus set the threshold to a lower value (11 degrees) based on the distribution of joystick values at trial start time (99.5% of the horizontal joystick positions are <11 at rest during the first 250 ms following the go-signal). On go-trials and failed-stop trials, reaction times were measured as the point of time after the go-signal when the joystick position first significantly exceeded its position at rest (two standard deviations).
In each session we calculated the percent of stop trials in which the subject successfully cancelled the action (i.e. did not move past the 11 degree threshold). For all stop-related analysis we only used sessions where the subject performed at least 5 successful and 5 failed stop trials. 24/33 sessions met these conditions. The remaining sessions had distributions that were skewed toward the tail end of the stopp (mean stopping accuracy: 14±12% for subjects with <5 successful stops, 90±13% for subjects with <5 failed stops). In the remaining sessions, subjects successfully stopped on 45±19% of stop trials and chose the correct direction on 91±7% of go trials
We calculated the stop-signal reaction (SSRT) time for each session using the integration method (Verbruggen et al., 2019). Briefly, this method involves first calculating the cumulative distribution function for the reaction times across all trials (including all go trials and failed stop trials) and then identified the latency L at which P(latency<L)= P(stop success rate | stop trial). Go-trials with reaction times <L are considered fast go-trials. Thus, if P(stop success rate | stop trial)=0.5, go-trials are split into fast and slow-go trials as a median split. According to the integration method, SSRT = L − mean(SSD on stop trials). We calculated the inhibition function for each session by dividing trials into those with short and long SSDs (median split) and calculating the percent of failed-stop trials for each.For stop-related analysis we calculated fast- and slow-go trials using the integration method described above. For movement-related analysis (Figure 2A–C) we defined fast and slow-go trials using a median split in reaction time to maximize the number of neurons available for analysis.
Spike detection and sorting
Broadband signals were filtered in the 300–3,000 Hz band using a zero-phase lag filter (four-pole Butterworth filter). Spikes were detected and sorted using the semi-automated template-matching algorithm OSort (Rutishauser et al., 2006). Each single unit was manually evaluted and verified based on the following features: (1) the spike waveform, (2) the percentage of interspike intervals (ISIs) less than 3 ms, (3) the ratio of the waveform extremum and the standard deviation of the noise, (4) the pairwise projection distance in the clustering space between all isolated neurons on the same microwire, and (5) the coefficient of variation of the ISI (spike quality metrics, Figure S1). To account for instabilities in neural recordings, we manually selected a lower and upper time limit during which a neuron achieved firing stability and only analyzed these trials. 26 neurons (31%) were stable for all 120 trials of the recording (15–20 minutes), whereas the remainder was stable only for a subset of trials. On average, the neurons were stable for 89±21% (89 ± 37 trials) of the recording.
Spike waveform analysis
We calculated the average spike waveform of each neuron and quantified three width features of the waveforms: the trough-to-peak width (time from the spike trough to the next peak, corresponding to the after hyperpolarization), the half-width (the width of the spike at half the spikes amplitude) and the repolarization time (the time elapsed from the peak hyperpolarization to the time this peak is at its half amplitude) (for detailed methods on how these widths are calculated see (Mosher et al., 2020). Plotting these three width features revealed two clusters of neurons, a narrow and a broad spiking group (Figure S5). We used a published classifier that differentiates between narrow and broad spiking neurons (Mosher et al., 2020) to determine if a neuron belonged to a narrow or broad cluster.
Identification and analysis of movement-related neurons
A neuron was classified as “movement-related” if it exhibited a difference in firing rate during movement compared to a pre-target baseline. On each trial, firing rate was calculated in a 200 ms sliding window with 1 ms overlap. A non-parametric Wilcoxon rank sum test compared each bin during movement (−250 to 500 ms aligned to movement onset) to all bins at baseline (−500 ms to 0 ms before target). This identified bins during movement with potentially significant differences in firing rate from baseline (p<0.05). To correct for multiple comparisons, we performed a cluster-correction analysis (Maris and Oostenveld, 2007). In this procedure a cluster is defined as a set of adjacent time bins with potentially significant firing rates. We sum the test-statistic (z-value Wilcoxon rank test statistic) across the bins in a given cluster to give a “cluster-wise statistic”. We repeated the analysis 500 times but randomly shuffled bins that occur during baseline and movement. If the cluster-wise test-statistic of the data exceeded 95% of the cluster-wise values obtained from shuffled data, the neuron was said to be significantly movement responsive.
In addition to aligning the neural spike times to movement onset, we aligned spikes to the onset of the go-signal (Figure 2B). We determined if the response of a neuron was more tightly locked to movement or the appearance of the go-signal by identifying the peak firing rate (200 ms binned PSTHs, 1 ms sliding window) after aligning to either time point and then compared the peak firing rate in the two conditions with a paired t-tests (Figure 2B inset).
Movement neurons had a ramp like response in firing rate leading up to movement onset. To measure this phenomenon, we binned firing rate (200 ms bins, 1 ms overlap) and fit a line using least squares regression to these rates from the timepoint when the neuron started to change its firing rate (cluster method, see above) to the timepoint of movement onset. Neurons with firing rate onsets that began after movement onset were excluded from this analysis.
We determined whether the population activity across all recorded neurons differed between periods of movement and periods when the subject was stationary using a single-trial decoder. We based this analysis on a pseudopopulation. First, we set aside one trial of each type (fast go, slow go, success stop, failed stop) for each neuron. These trials were later used for testing. We then calculated the mean firing rate on every trial during movement (1000 ms window following movement onset) and rest (1000 ms window, beginning 1500 ms before movement onset). For each neuron, we normalized the firing rates (z-score) across all trials. We randomly selected 60 trials from each neuron and created an n × m × 2 matrix of firing rates (n=neuron number, m=trial, 2=rest or movement period). We trained a linear SVM classifier on these firing rates to decode rest from movement and tested this classifier to the left out trials. We repeated this entire procedure 1,000 times. To examine the time course of this decoder throughout the trial, we binned the firing rates of the left-out trial data (200 ms bins, 50 ms overlap) and applied the decoder to each bin. The trace in Figure 2F shows the probability that the decoder predicts movement correctly as a function of time. As a control, we repeated this entire procedure 1,000 times but shuffled the rest and movement labels across trials. This generated a distribution of performance values expected by chance. To assess significance, we subtracted the performance value of the true decoder from the performance of each shuffled decoder. If the distribution was significantly different from 0 (t-test), the decoder was said to perform significantly better than shuffled data.
Identification and analysis of stop-signal responsive neurons
A neuron was classified as “stop-signal responsive” if it’s firing rate following the onset of a stop-signal was significantly different from the pre-stop baseline. We used the same binning, test-statistics, and clustering procedure as we did for selecting movement neurons (see above, rank sum tests, cluster-correction technique), but instead aligned to onset of the stop-signal. A cell was considered stop signal responsive if any bin in the 1000 ms following a stop-signal was significantly different from the firing rates observed in the window 500 ms immediately preceding the stop-signal. Cells for which less than 5 successful or failed stop trials were available were not included in this analysis.
The above selection criteria does not require stop-signal responsive neurons to differentiate between trial outcome (success or failure to stop). To determine if neurons responded to stop-signals regardless of trial outcome we in addition applied a stricter criterion with two statistical tests. First we compared the binned firing rate on successful stop trials to latency matched slow go trials (same 200 ms bins, statistical test is Wilcoxon rank sum as used previously for classifying stop-signal responsive and movement neurons, go trials were aligned to the time when the stop-signal would have appeared). Second, we compared the binned firing rate on failed stop trials to fast go trials. If the firing rate in any bin within 1000 ms after stop-signal onset significantly differentiated successful stop trials from slow go trials and failed stop trials from fast go trials, the cell was said to have met this strict stop-signal criterion.
For each neuron we calculated the effect size of the stop-signal on neural firing (Cohen’s D). We compared the effect of the stop-signal relative to baseline (mean rate in 500 ms window before stop signal compared to 500 ms window after stop signal). We also compared the effect of successful stop vs. slow go trials and failed stop vs. fast-go trials (rate 500 ms after stop signal onset, or the time when the stop signal would have appeared on a go-trial).
To better understand how the population of neurons in the STN might detect stop-signals we trained single-trial population decoders, similar to the movement decoder described above. We first calculated the firing rate in 200 ms bins with a 50 ms sliding window for every trial and every neuron. Then, like with the movement decoder, we randomly set aside one trial from each trial type (fast go, slow go, successful stop, failed stop) for later testing. We next randomly selected 30 stop-signal and 30 go-signal trials. In the movement decoder, we trained using the firing rate at different time points within the same trial (movement vs. pre-movement period). In the stop-signal decoder we compare across different trial types. For each neuron, we normalized the firing rate at a given time (z-score, normalized across both go and stop-signal trials). We then trained a linear SVM classifier on these normalized firing rates at a given time bin and tested on all time bins for left-out trial. We repeated this train and test procedure for all bins spanning 1,000 ms before to 2,000 ms after the stop signal. This generated a matrix of decoder performance for a single pseudopopulation of neurons. We repeated this procedure 1,000 times with different left out data and different training subsets and robust composite classifiers each composed of 1,000 classifiers trained on different subsets of data and tested on left-out data. To assess whether any of these classifiers performed better than chance, we repeated the entire procedure on data with shuffled labels for stop and go-signal trials (1,000 shuffled bootstrap). To determine if the real data was significantly different from the shuffled data we z-scored the performance of the classifiers to these bootstrapped values and detected every time bin that performed better than chance (p<0.05). We applied a 2D cluster analysis to account for multiple comparisons. First, we identified adjacent time points in 2d space (train x test matrix) with significant z-scores and summed their z-scores to give a cluster-wise statistic. We repeated the procedure on the 1,000 shuffled decoders, identifying all clusters and summing the values. If a clusterwise statistic exceeded 95% of the shuffled cluster statistics, the cluster was regarded as having a decoder performance significantly better than chance. The heatmap in Figure 2G shows the difference in decoder performance on true vs. shuffled data, contours outline significant clusters.
Beta bursts and beta-firing rhythms
Beta bursts were detected using a thresholding method (as in Tinkhauser et al., 2018; Torrecillos et al., 2018). We filtered the LFP/iEEG in the 13–30 Hz band using a zero-lag bandpass filter (Hamming, order=140, 3x the median beta frequency 21.5 Hz). We then applied the Hilbert transform to the signal and detected periods when the power exceeded a threshold equal to 75% of the distribution of all power values at all time-points during the task. A beta burst was detected if the power exceeded this threshold for at least 93 ms (2 cycles of a beta rhythm, median frequency of the beta band=21.5 Hz). In Figure 3 we identify periods when no beta bursts occur as timepoints when beta power was less than 25% of the distribution of power during the task maintained for at least 93 ms.
To calculate spike-field coherence between STN spikes and beta oscillations we used pairwise phase-consistency (PPC) as a metric (Vinck et al., 2010). Field potentials (recorded from microelectrode tip on STN electrode or from contacts on ECoG electrode) were filtered in the 13–30 Hz frequency band. We then applied the Hilbert transform to the signal and calculated the phase of the signal. We then calculated the PPC using the phase at the time of the spike (Vinck et al., 2010).
For each neuron we calculated the autocorrelogram (5 ms bins, −300 to 300 ms centered on spike) and the power of the spike train during motor cortical beta bursts and in the absence of beta bursts (Thomson multi-taper power spectrum, time-bandwidth product 1.25, with the minimum frequency resolution of ~10.2 Hz given beta burst are defined to be at least two cycles or ~100 ms; pmtm function in Matlab). We standardized the power-spectrum to account for differences in power by dividing by the area under the power spectrum. In Figure 3 we compare the standardized power spectrum during and outside beta bursts for all neurons (and the mean power in the 13–30 Hz band for different types of neurons. We identified neurons with significant peaks in the beta band using the method of Raz et al., 2000: the spike train power spectrum is first normalized by subtracting the mean power spectrum in the 5–40 Hz band and dividing by the standard deviation. Second, if the maximum standardized value in the beta band (3–13 Hz) exceeded 3 standard deviations then the cell was said to significantly fire at a beta rhythm (Amirnovin et al., 2004; Raz et al., 2000). We also compared the maximum power in the beta band (13–30 Hz) during vs outside beta bursts (Figure 3, t-tests).
Latency of neural responses
The onset times of movement- and stop-signal responsive neurons were calculated as the first significant time bin (200 ms bin, 1 ms sliding window, Wilcoxon rank sum test) that survived clusterwise-correction (see above sections on quantification of movement and stop-signal responses).
The probability of a beta bursts increased after a stop-signal on successful stop trials. The onset of this beta activity was calculated as the first time point (1 ms resolution) where the probability of a beta burst was significantly higher than in the 500 ms preceding the onset of the stop-signal (two-sample t-test, clusterwise correction).
To compare the response onset of stop-signal neurons to beta activity we also used a binless differential latency approach (Figure 3E). For each stop-signal neuron, we calculated the cumulative number of spikes elicited on each trial from 0–3 seconds after the stop-signal (1 ms resolution). We then calculated, at each time point, the difference in the average cumulative spiking on successful stop and slow go trials. We compared, at every timepoint, these difference across the population of stop-signal neurons (t-test) and calculated a cluster-wise test statistic (sum of all t-values that occur adjacent in time and p<0.05). We repeated this procedure 1,000 times with randomly shuffled labels to generate a null distribution of cluster-wise statistics. The response latency of the neuron was identified as the first timepoint whose cluster-wise statistic exceeded 95% of the shuffled data (Rutishauser et al., 2015; Xiang and Brown, 1998).
Classification of STN recording location based on firing features
For each neuron we calculated several features of the spike train and used these features to predict recording locations. The feature space consisted of (1) mean firing rate, (2) Coefficient of Variation and Local Variation (metrics of spike train variability, CV=standard deviation ÷ mean, LV, (Shinomoto et al., 2003), (3) burst index (the average value of the autocorrelation function in a window 3–20 ms after each spike), (4) the degree to which a neuron spikes at a beta rhythm (average value of the spike-train power spectrum in the 13–30 Hz frequency band), (5) the effect of movement on neural firing rate (comparison of mean firing rate during movement compared to pre-target baseline, measured as Cohen’s d), (6) the effect of stopping on neural firing rate (comparison of mean firing rate during successful stop trials and slow-go trials, measured as Cohen’s d), (7) the spike-field synchrony between STN neurons and local STN beta rhythm (PPC between STN spikes and beta-filtered LFP from STN, see above section on beta), and (8) the spike-field synchrony between STN neurons and motor cortex iEEG beta (PPC between STN and motor cortex). All values are normalized and reported as z-scores (Figure 4C). Note that not all features could be calculated for every neuron (e.g. in some recordings there were not a sufficient number of successful stop trials to calculate the stop effect size; some recordings did not have an SSEP reversal so we could not localize electrodes to motor cortex and calculate the motor related PPC). For this analysis, 40/47 neurons were included (including those not classified as either stop-signal or movement neurons)
For the unsupervised classification, we performed principal component analysis on the firing feature space and identified 4 components that together explained 75% of the variance (Figure 4A). We applied varimax rotation to the components to maximize the feature loading of each feature onto a single component. To test how the PCA axis mapped onto anatomical axes, we took the (x,y,z) anatomical position of each neuron and correlated it with the score of each component. We performed this in standard stereotaxic space (Figure S3E) and also for a rotated set of anatomical axis (axes were rotated along the x, y z, axis in 16 equally spaced rotations from 0 to pi). The rotated axis that best correlated with the scores of a component (maximal R-squared for linear correlation) was identified as the optimal axes for explaining that components variance.
For the supervised classification, we partitioned the subthalamic nucleus into two segments along the optimal axis (median split) and used these as labels to train a linear SVM classifier. We trained on a randomly selected subset of neurons (n= 20 neurons per region to give 40 total neurons; leaving out 1 neuron each for training) and tested on left-out data. We performed this procedure 1,000 times on different random subsets to obtain the average classification accuracy (chance=50%). To assess which features contributed the most to the classification we report the beta-coefficients of the SVM classifier.
Supplementary Material
Video S1: Three-dimensional view of STN axis, Related to Figure 4. The axes through STN that best defines stop (red-line) and movement-related activity (blue line, as shown in Figure 4B). The trajectory of recording electrodes from each session are shown in white. Yellow=STN, Red= red nucleus, aqua=substantia nigra, green=internal segment of globus pallidus, blue=external segment of globus pallidus, purple=striatum, atlas from (Ewert et al., 2018).
Key Resources Table
| REAGENT or RESOURCE | SOURCE | IDENTIFIER |
|---|---|---|
| Software and Algorithms | ||
| MATLAB 2017b | MathWorks https://www.mathworks.com/ | SCR_001622 |
| Psychophysics toolbox PTB3 | (Brainard, 1997) http://psychtoolbox.org/ | SCR_002881 |
| OSort spike sorting algorithm | (Rutishauser et al., 2006) http://rutishauserlab.org/osort/ | SCR_015869 |
| Freesurfer | (Dale et al., 1999) https://surfer.nmr.mgh.harvard.edu/ | SCR_001847 |
| 3D Slicer | https://www.slicer.org/ | SCR_005619 |
| Lead DBS | (Horn et al., 2014) https://www.lead-dbs.org/ | SCR_002915 |
| Other | ||
| Ad-Tech 8-contact ECog strips | Ad-Tech Medical https://adtechmedical.com/ | Cat#IS08RSP10X-0T1 |
| Alpha Omega Neuro Omega | Alpha Omega https://www.alphaomega-eng.com/ | Cat# NOM-000000-00 |
| Alpha Omega Hybrid Microelectrodes | Alpha Omega https://www.alphaomega-eng.com/ | Cat# STR-009080-00 |
| Deposited Data | This Manuscript | https://osf.io/jd5uc |
Highlights.
Neurons in the dorsal STN of humans are activated when planning to move.
Neurons in ventral STN of humans are rapidly activated in response to stop-signals.
Changes in beta-band field potentials occur late in the stopping process.
Neural firing features predict anatomical location within STN.
Acknowledgements
We thank Michele Tagliati for patient referrals, the staff and physicians of the Movement Disorders Program at Cedars-Sinai for support; Robert Zelaya, Lori Scheinost, Andy Nguyen, and Cody Holland for assistance with intraoperative recordings; Jan Kaminski, Jeong Woo Choi, Vasileios Christopoulos and Steven Errington for discussion and feedback on the manuscript; Adam Aron for advice and for contributing to writing the grant that partially funded this work. This work was supported by the BRAIN initiative through grants from the NINDS (U01NS103792 to UR and AM, U01NS098961 to NP and UR).
Footnotes
Publisher's Disclaimer: This is a PDF file of an unedited manuscript that has been accepted for publication. As a service to our customers we are providing this early version of the manuscript. The manuscript will undergo copyediting, typesetting, and review of the resulting proof before it is published in its final form. Please note that during the production process errors may be discovered which could affect the content, and all legal disclaimers that apply to the journal pertain.
Declaration of Interests
The authors declare no competing interests.
References
- Alegre M, Lopez-Azcarate J, Obeso I, Wilkinson L, Rodriguez-Oroz MC, Valencia M, Garcia-Garcia D, Guridi J, Artieda J, Jahanshahi M, et al. (2013). The subthalamic nucleus is involved in successful inhibition in the stop-signal task: a local field potential study in Parkinson’s disease. Exp. Neurol 239, 1–12. [DOI] [PubMed] [Google Scholar]
- Allison T (1987). Localization of sensorimotor cortex in neurosurgery by recording of somatosensory evoked potentials. Yale J Biol Med 60, 143–150. [PMC free article] [PubMed] [Google Scholar]
- Amirnovin R, Williams ZM, Cosgrove GR, and Eskandar EN (2004). Visually Guided Movements Suppress Subthalamic Oscillations in Parkinson’s Disease Patients. J. Neurosci 24, 11302–11306. [DOI] [PMC free article] [PubMed] [Google Scholar]
- Aron AR, and Poldrack RA (2006). Cortical and Subcortical Contributions to Stop Signal Response Inhibition: Role of the Subthalamic Nucleus. J. Neurosci 26, 2424–2433. [DOI] [PMC free article] [PubMed] [Google Scholar]
- Aron AR, Fletcher PC, Bullmore ET, Sahakian BJ, and Robbins TW (2003). Stop-signal inhibition disrupted by damage to right inferior frontal gyrus in humans. Nature Neuroscience 6, 115–116. [DOI] [PubMed] [Google Scholar]
- Aron AR, Robbins TW, and Poldrack RA (2014). Inhibition and the right inferior frontal cortex: one decade on. Trends Cogn. Sci. (Regul. Ed.) 18, 177–185. [DOI] [PubMed] [Google Scholar]
- Aron AR, Herz DM, Brown P, Forstmann BU, and Zaghloul K (2016). Frontosubthalamic Circuits for Control of Action and Cognition. J. Neurosci 36, 11489–11495. [DOI] [PMC free article] [PubMed] [Google Scholar]
- Ballanger B, Eimeren T van, Moro E, Lozano AM, Hamani C, Boulinguez P, Pellecchia G, Houle S, Poon YY, Lang AE, et al. (2009). Stimulation of the subthalamic nucleus and impulsivity: Release your horses. Annals of Neurology 66, 817–824. [DOI] [PMC free article] [PubMed] [Google Scholar]
- Bastin J, Polosan M, Benis D, Goetz L, Bhattacharjee M, Piallat B, Krainik A, Bougerol T, Chabardès S, and David O (2014). Inhibitory control and error monitoring by human subthalamic neurons. Transl Psychiatry 4, e439. [DOI] [PMC free article] [PubMed] [Google Scholar]
- Benis D, David O, Piallat B, Kibleur A, Goetz L, Bhattacharjee M, Fraix V, Seigneuret E, Krack P, Chabardès S, et al. (2016). Response inhibition rapidly increases single-neuron responses in the subthalamic nucleus of patients with Parkinson’s disease. Cortex 84, 111–123. [DOI] [PubMed] [Google Scholar]
- Boucher L, Palmeri TJ, Logan GD, and Schall JD (2007). Inhibitory control in mind and brain: an interactive race model of countermanding saccades. Psychol Rev 114, 376–397. [DOI] [PubMed] [Google Scholar]
- Brainard DH (1997). The Psychophysics Toolbox. Spat Vis 10, 433–436. [PubMed] [Google Scholar]
- Cagnan H, Mallet N, Moll CKE, Gulberti A, Holt AB, Westphal M, Gerloff C, Engel AK, Hamel W, Magill PJ, et al. (2019). Temporal evolution of beta bursts in the parkinsonian cortical and basal ganglia network. PNAS 116, 16095–16104. [DOI] [PMC free article] [PubMed] [Google Scholar]
- Calabresi P, Picconi B, Tozzi A, Ghiglieri V, and Di Filippo M (2014). Direct and indirect pathways of basal ganglia: a critical reappraisal. Nat. Neurosci 17, 1022–1030. [DOI] [PubMed] [Google Scholar]
- Chen W, de Hemptinne C, Miller AM, Leibbrand M, Little SJ, Lim DA, Larson PS, and Starr PA (2020). Prefrontal-Subthalamic Hyperdirect Pathway Modulates Movement Inhibition in Humans. Neuron. [DOI] [PMC free article] [PubMed] [Google Scholar]
- Dale AM, Fischl B, and Sereno MI (1999). Cortical surface-based analysis. I. Segmentation and surface reconstruction. Neuroimage 9, 179–194. [DOI] [PubMed] [Google Scholar]
- DeLong MR, Crutcher MD, and Georgopoulos AP (1985). Primate globus pallidus and subthalamic nucleus: functional organization. Journal of Neurophysiology 53, 530–543. [DOI] [PubMed] [Google Scholar]
- DeVito JL, Anderson ME, and Walsh KE (1980). A horseradish peroxidase study of afferent connections of the globus pallidus in Macaca mulatta. Experimental Brain Research 38, 65–73. [DOI] [PubMed] [Google Scholar]
- Dutra IC, Waller DA, and Wessel JR (2018). Perceptual Surprise Improves Action Stopping by Nonselectively Suppressing Motor Activity via a Neural Mechanism for Motor Inhibition. J. Neurosci 38, 1482–1492. [DOI] [PMC free article] [PubMed] [Google Scholar]
- Ewert S, Plettig P, Li N, Chakravarty MM, Collins DL, Herrington TM, Kühn AA, and Horn A (2018). Toward defining deep brain stimulation targets in MNI space: A subcortical atlas based on multimodal MRI, histology and structural connectivity. Neuroimage 170, 271–282. [DOI] [PubMed] [Google Scholar]
- Fedorov A, Beichel R, Kalpathy-Cramer J, Finet J, Fillion-Robin J-C, Pujol S, Bauer C, Jennings D, Fennessy F, Sonka M, et al. (2012). 3D Slicer as an image computing platform for the Quantitative Imaging Network. Magn Reson Imaging 30, 1323–1341. [DOI] [PMC free article] [PubMed] [Google Scholar]
- Feingold J, Gibson DJ, DePasquale B, and Graybiel AM (2015). Bursts of beta oscillation differentiate postperformance activity in the striatum and motor cortex of monkeys performing movement tasks. Proc. Natl. Acad. Sci. U.S.A 112, 13687–13692. [DOI] [PMC free article] [PubMed] [Google Scholar]
- Fife KH, Gutierrez-Reed NA, Zell V, Bailly J, Lewis CM, Aron AR, and Hnasko TS (2017). Causal role for the subthalamic nucleus in interrupting behavior. ELife 6, e27689. [DOI] [PMC free article] [PubMed] [Google Scholar]
- Fischer P, Pogosyan A, Herz DM, Cheeran B, Green AL, Fitzgerald J, Aziz TZ, Hyam J, Little S, Foltynie T, et al. (2017). Subthalamic nucleus gamma activity increases not only during movement but also during movement inhibition. ELife 6, e23947. [DOI] [PMC free article] [PubMed] [Google Scholar]
- Fonov V, Evans A, McKinstry R, Almli C, and Collins D (2009). Unbiased nonlinear average age-appropriate brain templates from birth to adulthood. NeuroImage 47, S102. [Google Scholar]
- Frank MJ (2006). Hold your horses: a dynamic computational role for the subthalamic nucleus in decision making. Neural Netw 19, 1120–1136. [DOI] [PubMed] [Google Scholar]
- Fu Z, Wu D-AJ, Ross I, Chung JM, Mamelak AN, Adolphs R, and Rutishauser U (2019). Single-Neuron Correlates of Error Monitoring and Post-Error Adjustments in Human Medial Frontal Cortex. Neuron 101, 165–177.e5. [DOI] [PMC free article] [PubMed] [Google Scholar]
- Georgopoulos P, Delong R, and Crutcher D (1983). NUCLEUS OF THE BEHAVING. The Journal of Neuroscience 3, 13. [Google Scholar]
- Gourisankar A, Eisenstein SA, Trapp NT, Koller JM, Campbell MC, Ushe M, Perlmutter JS, Hershey T, and Black KJ (2018). Mapping movement, mood, motivation and mentation in the subthalamic nucleus. R Soc Open Sci 5. [DOI] [PMC free article] [PubMed] [Google Scholar]
- Greenhouse I, Gould S, Houser M, Hicks G, Gross J, and Aron AR (2011). Stimulation at dorsal and ventral electrode contacts targeted at the subthalamic nucleus has different effects on motor and emotion functions in Parkinson’s disease. Neuropsychologia 49, 528–534. [DOI] [PubMed] [Google Scholar]
- Greenhouse I, Gould S, Houser M, and Aron AR (2013). Stimulation of contacts in ventral but not dorsal subthalamic nucleus normalizes response switching in Parkinson’s disease. Neuropsychologia 51, 1302–1309. [DOI] [PMC free article] [PubMed] [Google Scholar]
- Hanes D, and Schall J (1996). Neural Control of Voluntary Movement Initiation. Science (New York, N.Y.) 274, 427–430. [DOI] [PubMed] [Google Scholar]
- Haynes WIA, and Haber SN (2013). The Organization of Prefrontal-Subthalamic Inputs in Primates Provides an Anatomical Substrate for Both Functional Specificity and Integration: Implications for Basal Ganglia Models and Deep Brain Stimulation. J Neurosci 33, 4804–4814. [DOI] [PMC free article] [PubMed] [Google Scholar]
- de Hemptinne C, Ryapolova-Webb ES, Air EL, Garcia PA, Miller KJ, Ojemann JG, Ostrem JL, Galifianakis NB, and Starr PA (2013). Exaggerated phase-amplitude coupling in the primary motor cortex in Parkinson disease. Proc. Natl. Acad. Sci. U.S.A 110, 4780–4785. [DOI] [PMC free article] [PubMed] [Google Scholar]
- Hershey T, Campbell MC, Videen TO, Lugar HM, Weaver PM, Hartlein J, Karimi M, Tabbal SD, and Perlmutter JS (2010). Mapping Go–No-Go performance within the subthalamic nucleus region. Brain 133, 3625–3634. [DOI] [PMC free article] [PubMed] [Google Scholar]
- Herz DM, Zavala BA, Bogacz R, and Brown P (2016). Neural Correlates of Decision Thresholds in the Human Subthalamic Nucleus. Current Biology 26, 916–920. [DOI] [PMC free article] [PubMed] [Google Scholar]
- Horn A, and Kühn AA (2015). Lead-DBS: A toolbox for deep brain stimulation electrode localizations and visualizations. NeuroImage 107, 127–135. [DOI] [PubMed] [Google Scholar]
- Isoda M, and Hikosaka O (2008). Role for Subthalamic Nucleus Neurons in Switching from Automatic to Controlled Eye Movement. J. Neurosci 28, 7209–7218. [DOI] [PMC free article] [PubMed] [Google Scholar]
- Iwamuro H, Tachibana Y, Ugawa Y, Saito N, and Nambu A (2017). Information processing from the motor cortices to the subthalamic nucleus and globus pallidus and their somatotopic organizations revealed electrophysiologically in monkeys. Eur J Neurosci 46, 2684–2701. [DOI] [PMC free article] [PubMed] [Google Scholar]
- Jahanshahi M, Obeso I, Baunez C, Alegre M, and Krack P (2015a). Parkinson’s Disease, the Subthalamic Nucleus, Inhibition, and Impulsivity. Movement Disorders 30, 128–140. [DOI] [PubMed] [Google Scholar]
- Jahanshahi M, Obeso I, Rothwell JC, and Obeso JA (2015b). A fronto-striato-subthalamic-pallidal network for goal-directed and habitual inhibition. Nat. Rev. Neurosci 16, 719–732. [DOI] [PubMed] [Google Scholar]
- Jantz JJ, Watanabe M, Levy R, and Munoz DP (2017). Evidence for a task-dependent switch in subthalamo-nigral basal ganglia signaling. Nat Commun 8. [DOI] [PMC free article] [PubMed] [Google Scholar]
- Joel D, and Weiner I (1997). The connections of the primate subthalamic nucleus: indirect pathways and the open-interconnected scheme of basal ganglia-thalamocortical circuitry. Brain Research. Brain Research Reviews 23, 62–78. [DOI] [PubMed] [Google Scholar]
- Kaku H, Ozturk M, Viswanathan A, Shahed J, Sheth SA, Kumar S, and Ince NF (2019). Unsupervised Clustering Reveals Spatially Varying Single Neuronal Firing Patterns in the Subthalamic Nucleus of Patients with Parkinson’s Disease. BioRxiv 863464. [DOI] [PMC free article] [PubMed] [Google Scholar]
- Kamiński J, Mamelak AN, Birch K, Mosher CP, Tagliati M, and Rutishauser U (2018). Novelty-Sensitive Dopaminergic Neurons in the Human Substantia Nigra Predict Success of Declarative Memory Formation. Curr. Biol 28, 1333–1343.e4. [DOI] [PMC free article] [PubMed] [Google Scholar]
- Keuken MC, Uylings HBM, Geyer S, Schäfer A, Turner R, and Forstmann BU (2012). Are there three subdivisions in the primate subthalamic nucleus? Front Neuroanat 6. [DOI] [PMC free article] [PubMed] [Google Scholar]
- Kornylo K, Dill N, Saenz M, and Krauzlis RJ (2003). Canceling of Pursuit and Saccadic Eye Movements in Humans and Monkeys. Journal of Neurophysiology 89, 2984–2999. [DOI] [PubMed] [Google Scholar]
- Kühn AA, Trottenberg T, Kivi A, Kupsch A, Schneider G-H, and Brown P (2005). The relationship between local field potential and neuronal discharge in the subthalamic nucleus of patients with Parkinson’s disease. Experimental Neurology 194, 212–220. [DOI] [PubMed] [Google Scholar]
- Lafreniere-Roula M, Hutchison WD, Lozano AM, Hodaie M, and Dostrovsky JO (2009). Microstimulation-induced inhibition as a tool to aid targeting the ventral border of the subthalamic nucleus. J. Neurosurg 111, 724–728. [DOI] [PubMed] [Google Scholar]
- Lévesque J-C, and Parent A (2005). GABAergic interneurons in human subthalamic nucleus. Movement Disorders 20, 574–584. [DOI] [PubMed] [Google Scholar]
- Lipski WJ, Wozny TA, Alhourani A, Kondylis ED, Turner RS, Crammond DJ, and Richardson RM (2017). Dynamics of human subthalamic neuron phase-locking to motor and sensory cortical oscillations during movement. J Neurophysiol 118, 1472–1487. [DOI] [PMC free article] [PubMed] [Google Scholar]
- Logan GD, and Cowan WB (1984). On the ability to inhibit thought and action: A theory of an act of control. Psychological Review 91, 295–327. [DOI] [PubMed] [Google Scholar]
- Mallet L, Schüpbach M, N’Diaye K, Remy P, Bardinet E, Czernecki V, Welter M-L, Pelissolo A, Ruberg M, Agid Y, et al. (2007). Stimulation of subterritories of the subthalamic nucleus reveals its role in the integration of the emotional and motor aspects of behavior. PNAS 104, 10661–10666. [DOI] [PMC free article] [PubMed] [Google Scholar]
- Maris E, and Oostenveld R (2007). Nonparametric statistical testing of EEG- and MEG-data. J. Neurosci. Methods 164, 177–190. [DOI] [PubMed] [Google Scholar]
- Middlebrooks PG, and Schall JD (2014). Response inhibition during perceptual decision making in humans and macaques. Atten Percept Psychophys 76, 353–366. [DOI] [PMC free article] [PubMed] [Google Scholar]
- Mink JW (1996). THE BASAL GANGLIA: FOCUSED SELECTION AND INHIBITION OF COMPETING MOTOR PROGRAMS. Progress in Neurobiology 50, 381–425. [DOI] [PubMed] [Google Scholar]
- Mosher CP, Wei Y, Kaminski J, Nandi A, Mamelak AN, Anastassiou CA, and Rutishauser U (2020). Cellular classes in the human brain revealed in vivo by heartbeat-related modulation of the extracellular action potential waveform. (Accepted for Publication in Cell Reports). [DOI] [PMC free article] [PubMed]
- Nambu A, Takada M, Inase M, and Tokuno H (1996). Dual somatotopical representations in the primate subthalamic nucleus: evidence for ordered but reversed body-map transformations from the primary motor cortex and the supplementary motor area. J. Neurosci 16, 2671–2683. [DOI] [PMC free article] [PubMed] [Google Scholar]
- Nambu A, Tokuno H, and Takada M (2002). Functional significance of the cortico–subthalamo–pallidal ‘hyperdirect’ pathway. Neuroscience Research 43, 111–117. [DOI] [PubMed] [Google Scholar]
- Nassery A, Palmese CA, Sarva H, Groves M, Miravite J, and Kopell BH (2016). Psychiatric and Cognitive Effects of Deep Brain Stimulation for Parkinson’s Disease. Curr Neurol Neurosci Rep 16, 87. [DOI] [PubMed] [Google Scholar]
- Obeso I, Wilkinson L, Casabona E, Speekenbrink M, Luisa Bringas M, Álvarez M, Álvarez L, Pavón N, Rodríguez-Oroz MC, Macías R, et al. (2014). The subthalamic nucleus and inhibitory control: impact of subthalamotomy in Parkinson’s disease. Brain 137, 1470–1480. [DOI] [PubMed] [Google Scholar]
- Parent A, and Smith Y (1987). Organization of efferent projections of the subthalamic nucleus in the squirrel monkey as revealed by retrograde labeling methods. Brain Research 436, 296–310. [DOI] [PubMed] [Google Scholar]
- Pasquereau B, and Turner RS (2017). A selective role for ventromedial subthalamic nucleus in inhibitory control. ELife 6, e31627. [DOI] [PMC free article] [PubMed] [Google Scholar]
- Pötter-Nerger M, Reese R, Steigerwald F, Heiden JA, Herzog J, Moll CKE, Hamel W, Ramirez-Pasos U, Falk D, Mehdorn M, et al. (2017). Movement-Related Activity of Human Subthalamic Neurons during a Reach-to-Grasp Task. Front. Hum. Neurosci 11. [DOI] [PMC free article] [PubMed] [Google Scholar]
- Pouratian N, Thakkar S, Kim W, and Bronstein JM (2012). Deep brain stimulation for the treatment of Parkinson’s disease: efficacy and safety. Degener Neurol Neuromuscul Dis 2012. [DOI] [PMC free article] [PubMed] [Google Scholar]
- Ray NJ, Jenkinson N, Brittain J, Holland P, Joint C, Nandi D, Bain PG, Yousif N, Green A, Stein JS, et al. (2009). The role of the subthalamic nucleus in response inhibition: Evidence from deep brain stimulation for Parkinson’s disease. Neuropsychologia 47, 2828–2834. [DOI] [PubMed] [Google Scholar]
- Ray NJ, Brittain J-S, Holland P, Joundi RA, Stein JF, Aziz TZ, and Jenkinson N (2012). The role of the subthalamic nucleus in response inhibition: Evidence from local field potential recordings in the human subthalamic nucleus. NeuroImage 60, 271–278. [DOI] [PubMed] [Google Scholar]
- Raz A, Vaadia E, and Bergman H (2000). Firing Patterns and Correlations of Spontaneous Discharge of Pallidal Neurons in the Normal and the Tremulous 1-Methyl-4-Phenyl-1,2,3,6-Tetrahydropyridine Vervet Model of Parkinsonism. J. Neurosci 20, 8559–8571. [DOI] [PMC free article] [PubMed] [Google Scholar]
- Rodriguez-Oroz MC, Rodriguez M, Guridi J, Mewes K, Chockkman V, Vitek J, DeLong MR, and Obeso JA (2001). The subthalamic nucleus in Parkinson’s disease: somatotopic organization and physiological characteristics. Brain 124, 1777–1790. [DOI] [PubMed] [Google Scholar]
- Rutishauser U, Schuman EM, and Mamelak AN (2006). Online detection and sorting of extracellularly recorded action potentials in human medial temporal lobe recordings, in vivo. J. Neurosci. Methods 154, 204–224. [DOI] [PubMed] [Google Scholar]
- Rutishauser U, Ye S, Koroma M, Tudusciuc O, Ross IB, Chung JM, and Mamelak AN (2015). Representation of retrieval confidence by single neurons in the human medial temporal lobe. Nat. Neurosci 18, 1041–1050. [DOI] [PMC free article] [PubMed] [Google Scholar]
- Schall JD (2019). Accumulators, Neurons, and Response Time. Trends in Neurosciences 42, 848–860. [DOI] [PMC free article] [PubMed] [Google Scholar]
- Schall JD, Palmeri TJ, and Logan GD (2017). Models of inhibitory control. Philos. Trans. R. Soc. Lond., B, Biol. Sci 372. [DOI] [PMC free article] [PubMed] [Google Scholar]
- Scherrer S, Smith AH, Gowatsky J, Palmese CA, Jimenez-Shahed J, Kopell BH, Mayberg HS, and Figee M (2020). Impulsivity and Compulsivity After Subthalamic Deep Brain Stimulation for Parkinson’s Disease. Front Behav Neurosci 14, 47. [DOI] [PMC free article] [PubMed] [Google Scholar]
- Schmidt R, Leventhal DK, Mallet N, Chen F, and Berke JD (2013). Canceling actions involves a race between basal ganglia pathways. Nature Neuroscience 16, 1118–1124. [DOI] [PMC free article] [PubMed] [Google Scholar]
- Seifried C, Weise L, Hartmann R, Gasser T, Baudrexel S, Szelényi A, van de Loo S, Steinmetz H, Seifert V, Roeper J, et al. (2012). Intraoperative microelectrode recording for the delineation of subthalamic nucleus topography in Parkinson’s disease. Brain Stimulation 5, 378–387. [DOI] [PubMed] [Google Scholar]
- Shimamoto SA, Ryapolova-Webb ES, Ostrem JL, Galifianakis NB, Miller KJ, and Starr PA (2013). Subthalamic Nucleus Neurons Are Synchronized to Primary Motor Cortex Local Field Potentials in Parkinson’s Disease. Journal of Neuroscience 33, 7220–7233. [DOI] [PMC free article] [PubMed] [Google Scholar]
- Shinomoto S, Shima K, and Tanji J (2003). Differences in spiking patterns among cortical neurons. Neural Comput 15, 2823–2842. [DOI] [PubMed] [Google Scholar]
- Smith Y, and Parent A (1988). Neurons of the subthalamic nucleus in primates display glutamate but not GABA immunoreactivity. Brain Research 453, 353–356. [DOI] [PubMed] [Google Scholar]
- Starr PA, Theodosopoulos PV, and Turner R (2003). Surgery of the Subthalamic Nucleus: Use of Movement-related Neuronal Activity for Surgical Navigation. Neurosurgery 53, 1146–1149. [DOI] [PubMed] [Google Scholar]
- Theodosopoulos PV, Marks WJ, Christine C, and Starr PA (2003). Locations of movement-related cells in the human subthalamic nucleus in Parkinson’s disease. Movement Disorders 18, 791–798. [DOI] [PubMed] [Google Scholar]
- Tinkhauser G, Torrecillos F, Duclos Y, Tan H, Pogosyan A, Fischer P, Carron R, Welter M-L, Karachi C, Vandenberghe W, et al. (2018). Beta burst coupling across the motor circuit in Parkinson’s disease. Neurobiol. Dis 117, 217–225. [DOI] [PMC free article] [PubMed] [Google Scholar]
- Torrecillos F, Tinkhauser G, Fischer P, Green AL, Aziz TZ, Foltynie T, Limousin P, Zrinzo L, Ashkan K, Brown P, et al. (2018). Modulation of Beta Bursts in the Subthalamic Nucleus Predicts Motor Performance. J. Neurosci 38, 8905–8917. [DOI] [PMC free article] [PubMed] [Google Scholar]
- Verbruggen F, Aron AR, Band GP, Beste C, Bissett PG, Brockett AT, Brown JW, Chamberlain SR, Chambers CD, Colonius H, et al. (2019). A consensus guide to capturing the ability to inhibit actions and impulsive behaviors in the stop-signal task. Elife 8. [DOI] [PMC free article] [PubMed] [Google Scholar]
- Vinck M, van Wingerden M, Womelsdorf T, Fries P, and Pennartz CMA (2010). The pairwise phase consistency: a bias-free measure of rhythmic neuronal synchronization. Neuroimage 51, 112–122. [DOI] [PubMed] [Google Scholar]
- Voon V, Droux F, Morris L, Chabardes S, Bougerol T, David O, Krack P, and Polosan M (2017). Decisional impulsivity and the associative-limbic subthalamic nucleus in obsessive-compulsive disorder: stimulation and connectivity. Brain 140, 442–456. [DOI] [PMC free article] [PubMed] [Google Scholar]
- Wagenbreth C, Kuehne M, Voges J, Heinze H-J, Galazky I, and Zaehle T (2019). Deep Brain Stimulation of the Subthalamic Nucleus Selectively Modulates Emotion Recognition of Facial Stimuli in Parkinson’s Patients. J Clin Med 8. [DOI] [PMC free article] [PubMed] [Google Scholar]
- Wessel JR (2020). β-Bursts Reveal the Trial-to-Trial Dynamics of Movement Initiation and Cancellation. J. Neurosci 40, 411–423. [DOI] [PMC free article] [PubMed] [Google Scholar]
- Wessel JR, and Aron AR (2017). On the Globality of Motor Suppression: Unexpected Events and Their Influence on Behavior and Cognition. Neuron 93, 259–280. [DOI] [PMC free article] [PubMed] [Google Scholar]
- Wessel JR, Ghahremani A, Udupa K, Saha U, Kalia SK, Hodaie M, Lozano AM, Aron AR, and Chen R (2016). Stop-related subthalamic beta activity indexes global motor suppression in Parkinson’s disease. Movement Disorders 31, 1846–1853. [DOI] [PMC free article] [PubMed] [Google Scholar]
- Wiecki TV, and Frank MJ (2013). A computational model of inhibitory control in frontal cortex and basal ganglia.Psychol Rev 120, 329–355. [DOI] [PubMed] [Google Scholar]
- van den Wildenberg WPM, van Boxtel GJM, van der Molen MW, Bosch DA, Speelman JD, and Brunia CHM (2006). Stimulation of the Subthalamic Region Facilitates the Selection and Inhibition of Motor Responses in Parkinson’s Disease. Journal of Cognitive Neuroscience 18, 626–636. [DOI] [PubMed] [Google Scholar]
- van Wouwe NC, Pallavaram S, Phibbs FT, Martinez-Ramirez D, Neimat JS, Dawant BM, D’Haese PF, Kanoff KE, van den Wildenberg WPM, Okun MS, et al. (2017). Focused stimulation of dorsal subthalamic nucleus improves reactive inhibitory control of action impulses. Neuropsychologia 99, 37–47. [DOI] [PMC free article] [PubMed] [Google Scholar]
- Xiang JZ, and Brown MW (1998). Differential neuronal encoding of novelty, familiarity and recency in regions of the anterior temporal lobe. Neuropharmacology 37, 657–676. [DOI] [PubMed] [Google Scholar]
- Yang AI, Vanegas N, Lungu C, and Zaghloul KA (2014). Beta-Coupled High-Frequency Activity and Beta-Locked Neuronal Spiking in the Subthalamic Nucleus of Parkinson’s Disease. Journal of Neuroscience 34, 12816–12827. [DOI] [PMC free article] [PubMed] [Google Scholar]
- Yelnik J, and Percheron G (1979). Subthalamic neurons in primates: A quantitative and comparative analysis. Neuroscience 4, 1717–1743. [DOI] [PubMed] [Google Scholar]
- Zaghloul KA, Weidemann CT, Lega BC, Jaggi JL, Baltuch GH, and Kahana MJ (2012). Neuronal Activity in the Human Subthalamic Nucleus Encodes Decision Conflict during Action Selection. J Neurosci 32, 2453–2460. [DOI] [PMC free article] [PubMed] [Google Scholar]
- Zhang S, Silburn P, Pouratian N, Cheeran B, Venkatesan L, Kent A, and Schnitzler A (2020). Comparing Current Steering Technologies for Directional Deep Brain Stimulation Using a Computational Model That Incorporates Heterogeneous Tissue Properties. Neuromodulation 23, 469–477. [DOI] [PMC free article] [PubMed] [Google Scholar]
Associated Data
This section collects any data citations, data availability statements, or supplementary materials included in this article.
Supplementary Materials
Video S1: Three-dimensional view of STN axis, Related to Figure 4. The axes through STN that best defines stop (red-line) and movement-related activity (blue line, as shown in Figure 4B). The trajectory of recording electrodes from each session are shown in white. Yellow=STN, Red= red nucleus, aqua=substantia nigra, green=internal segment of globus pallidus, blue=external segment of globus pallidus, purple=striatum, atlas from (Ewert et al., 2018).
Data Availability Statement
The data generated in this study will be made available on Open Science Framework (https://osf.io/jd5uc) upon publication (DOI 10.17605/OSF.IO/JD5UC).