Abstract
Rapid execution of motor sequences is believed to depend upon fusing movement elements into cohesive units that are executed holistically. We sought to determine the contribution of primary motor and dorsal premotor cortex to this ability. Monkeys performed highly practiced two-reach sequences, interleaved with matched reaches performed alone or separated by a delay. We partitioned neural population activity into components pertaining to preparation, initiation, and execution. The hypothesis that movement elements fuse makes specific predictions regarding all three forms of activity. We observed none of these predicted effects. Rapid two-reach sequences involved the same set of neural events as individual reaches but with preparation for the second reach occurring as the first was in flight. Thus, at the level of dorsal premotor and primary motor cortex, skillfully executing a rapid sequence depends not on fusing elements, but on the ability to perform two key processes at the same time.
Introduction
Decades of research have documented the events within motor cortex that accompany a voluntary movement. But what is ‘a movement’? The answer is unambiguous for a discrete behavior such as a reach. The subject begins at rest, moves, then returns to rest. ‘A movement’ is the action between periods of quiescence. But how does this conception extend to other behaviors? For example, how many movements are used to enter a four-digit bank code? If button presses are separated by considerable time, it seems reasonable to assume they are generated individually. Conversely, when a well-learned sequence is executed rapidly, it seems likely to be generated as a unified whole.
There is indeed considerable evidence that temporal separation between sequence elements relates to how that sequence is internally produced1–3. When practiced in a specific order, the time between elements becomes minimal, and they are said to form a functional unit: a ‘motor chunk’1,3,4. Chunk formation occurs spontaneously during long sequences, yielding subsets of swiftly executed elements with longer separations between subsets1,5. A specific chunk structure can be encouraged by manipulating the delay between elements5,6. Thus, a tendency to chunk facilitates rapid execution, and the need for rapid execution induces chunking.
The neural and computational basis of this phenomenon is less clear. Is chunking a ‘cognitive’ skill, relating to how actions are recalled and conveyed to downstream motor areas7,8? Or is chunking a motor skill, in which motor areas generate, holistically, actions that were originally generated separately? Studies of motor cortex report ‘sequence selectivity’: responses that reflect whether an action is performed within a sequence9–11 (although see12). Sequence selectivity concurs with the hypothesis that chunking is a motor phenomenon, with chunks executed differently from their component elements.
Yet sequence selectivity may arise for other reasons. Most simply, muscle activity can reflect whether an action is performed within a sequence. More subtly, sequence selectivity could result from overlapping execution- and preparation-related activity. If one element is prepared as the previous element is completing, a ‘new’ activity pattern, not observed during execution of any single element, will be produced. For these reasons, one wishes to compare neural activity not to a null hypothesis (identical responses regardless of whether an element occurs within a sequence) but to predictions made by competing hypotheses. One hypothesis is that rapid sequence production does not depend on anything ‘new’ at the level of motor cortex but simply reflects independent preparation and execution of each element. We refer to this as the independent strategy. The competing hypothesis is that elements are prepared and executed as a unified whole. We refer to this as the holistic strategy.
The maturing characterization of neural events during single reaches makes it possible to derive concrete predictions from these hypotheses. Reaching involves three distinguishable neural processes observable within primary motor and dorsal premotor cortex. The first is preparatory. Preparatory activity reflects the identity of the pending reach13–15 and is proposed to seed subsequent movement-generating neural dynamics16–18. The second is a putative ‘trigger signal’: a large change in neural state that is independent of reach specifics (and thus produces broadly tuned responses19) yet highly predictive of the moment of reach onset20–22. The third is execution-related: richly time-varying activity23,24 that arises ~10–20 ms before muscle activity begins25. If two elements are prepared and executed independently, each process should occur twice. If two elements are prepared and executed holistically, each should occur once. The hypotheses also make different predictions regarding the structure of neural activity during preparation and execution. For example, preparatory activity should reflect only the first element under the independent hypothesis, but should reflect both elements under the holistic hypothesis.
We recorded from motor cortex (dorsal premotor and primary motor cortex) in monkeys trained to execute two-reach sequences. Monkeys were required to modulate the timing between reaches, performing them either in rapid succession (compound reach) or separated by an imposed pause (delayed double-reach). As expected, the imposed pause produced clearly independent preparation and execution: the prepare-trigger-execute motif was observed twice. Unexpectedly, independent preparation and execution persisted during compound reaches. This was true even though the full sequence was known in advance, had been practiced tens of thousands of times, and unfolded so swiftly that muscle activity for the for the second reach began as the first ended. Neural responses revealed how this rapid pace was possible: preparation for the second reach occurred during execution of the first, yet did not disrupt ongoing execution. Thus, at the level of motor cortex, skilled performance depends not on fusing elements, but upon the ability to swiftly prepare one element while executing another.
Results
Task and Behavior
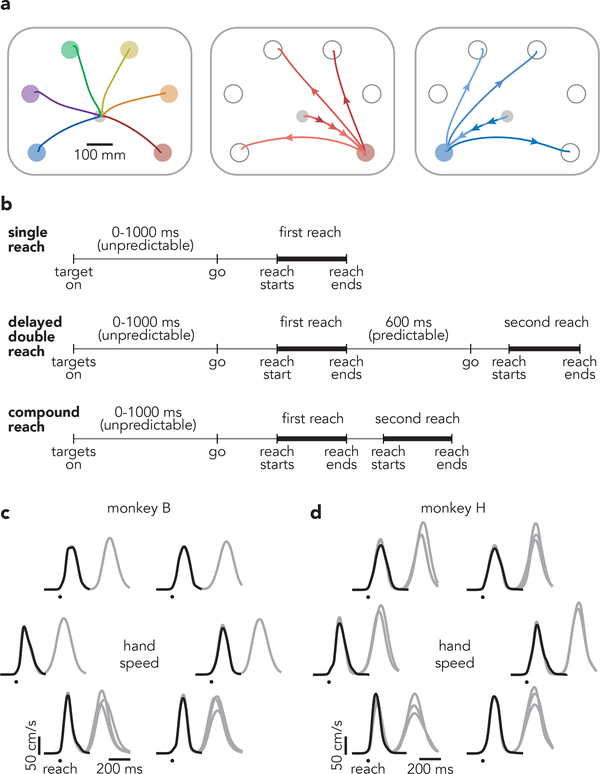
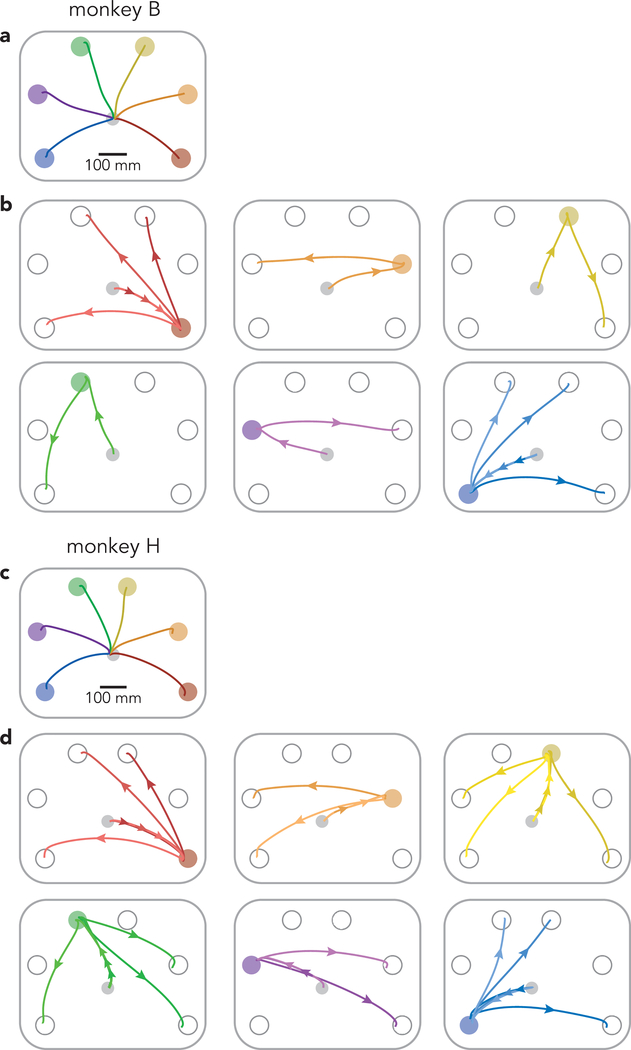
We trained two rhesus macaques (monkeys B and H) to perform a modified delayed-reach task (Fig. 1a,b). All trials began with a randomized (0–1000 ms) instructed delay period. Each trial required the monkey to make either a single reach, two reaches separated by an instructed pause (delayed double-reach), or two reaches with no pause between them (compound reach). All information was given during the instructed delay. Target color indicated reach order, and a salient visual cue indicated whether a pause was required. For monkey H, the pause between delayed double-reaches was always 600 ms. For monkey B, it was variable: 100, 300, or 600 ms (the last is used for most analyses). Representative hand trajectories are shown (Fig. 1a) for all single reaches, three compound reaches that began down-and-right, and three compound reaches that began down-and-left (Extended Data Fig. 1 shows all compound-reach trajectories).
Fig. 1 |. Task structure.
a, Mean hand paths for all single reach conditions and a subset of compound reach conditions. Left panel: single reaches. Middle panel: three compound reaches that began with a reach to the bottom-right target. Right panel: three compound reaches that began with a reach to the bottom-left target. b, Trial timing. All conditions employed a variable instructed delay period. Delayed double-reaches employed an instructed pause between reaches, the duration of which was indicated during the initial instructed delay. Compound reaches had no instructed pause and monkeys reached for the second target immediately after the first was touched. c, Mean hand speed for all single reach (black) and compound reach (grey) conditions. Traces are grouped according to the location of the first target. Every target location served as the first target for at least one compound reach condition; some were used for three. Averages were calculated across all trials and recording sessions. Data are for monkey B. Circles indicate the time of reach onset. d, Same as c but for Monkey H. Every target location served as the first target for two or three compound reach conditions.
Compound reaches were performed briskly; the hand stayed on the first target only briefly before moving to the second. Median dwell times on the first target were 119 ms (monkey B) and 137 ms (monkey H). Median duration for the full two-reach sequence was 561 ms (monkey B) and 645 ms (monkey H). This rapid pace resulted from extensive training over months, with each sequence performed tens of thousands of times. This pace exceeds that in other motor sequence tasks performed by non-human primates, where dwell times are typically >200 ms9,10,26.
To enable comparisons at the neural level, every compound reach condition shared the same first target with a matched single-reach condition. Ideally the reaches themselves (not just target locations) should be well-matched. This was indeed the case. Reach-speed profiles (Fig. 1c,d) were very similar for single reaches (black) and the first reach of compound reaches (gray); correlations were 0.99 ± 0.002 (mean ± standard deviation across conditions, monkey B) and 0.98 ± 0.03 (monkey H). The most noticeable difference was that the first reach of a compound reach tended to be slightly faster than the corresponding single reach, by 3 ± 2.8% and 3 ± 9.4% (monkey B and H, change in peak velocity, mean and standard deviation across conditions). We also examined the activity of the major upper-arm and shoulder muscles (Fig. 2a and Supplementary Fig. 1 show two such recordings). Muscle activity began changing ~100 ms before reach onset (circles). During the subsequent 275 ms, muscle activity was similar during compound reaches and single reaches to the same target (gray and black traces overlap). Mean correlations were 0.93 ± 0.15 and 0.93 ± 0.15 (monkey B and H, mean and standard deviation across muscles and conditions). Comparing compound reaches with matched single reaches, muscle activity magnitude was, on average, slightly lower for monkey B (2 ± 15%) and slightly higher for monkey H (8 ± 22%). Thus, behavior approached the desired ideal: an identical first reach regardless of a second reach. The match was even closer when comparing delayed double-reaches with single reaches, both for velocity (ρ = 0.99 ± 0.0004 and 0.99 ± 0.001 monkey B and H) and muscle activity (average ρ = 0.98 ± 0.05 and 0.99 ± 0.05).
Fig. 2 |. Potential strategies for generating compound reaches.
a, Mean EMG for single (black) and compound (grey) reach conditions. Data are from the anterior deltoid of Monkey B. Traces are grouped according to the location of the first target. Circles indicate the time of reach onset minus 100 ms (the approximate latency between EMG onset and reach onset). The vertical scaling of the traces is arbitrary but consistent across all traces. During compound reaches, EMG evolved continuously throughout the full sequence; there was no pause or plateau between reaches. b, Illustration of the holistic strategy. Under the holistic strategy, compound reaches are produced as single movements, which require only a single pattern of preparatory activity and a single trigger signal. c, Illustration of the independent strategy. Under the independent strategy, compound reaches are generated by preparation, triggering, and execution occurring twice in succession.
Compound and delayed double-reaches would ideally have identical muscle activity during second reaches, yet this cannot be perfectly achieved. During compound reaches there is no pause in muscle activity – the second reach is generated while activity is still in flux after the first. Consistent with this, second-reach muscle activity was strongly but imperfectly correlated between compound and delayed double-reaches: ρ = 0.90 ± 0.16 and 0.83 ± 0.25 (monkey B and H, mean and standard deviation across muscles and conditions).
Basic Properties of Neural Responses
We recorded well-isolated single neurons and high-quality multi-unit isolations (227 and 587 units from monkey B and H) from the arm region of motor cortex (dorsal premotor cortex and surface primary motor cortex, Supplementary Fig. 2) using 32-channel linear-array electrodes. Many units exhibited sequence selectivity9,10,27. Comparing delay-period activity before matched single versus compound reaches, 11% and 24% of recorded units (monkey B and H) showed significantly different responses during at least one pair of conditions (p < 0.001, Wilcox rank-sum test, adjusted for 10 and 16 comparisons for monkey B and H). These percentages grew when comparing movement-epoch activity: to 39% and 59% (when considering time-averaged activity) or 79% and 95% (when considering the full temporal pattern; see Methods).
Such differences are potentially consistent with a holistic strategy, which requires that an individual reach be generated ‘differently’ when part of a sequence. Yet the mere presence of significant differences does not discriminate between independent and holistic strategies. Small, but potentially significant, differences are likely unavoidable given that muscle activity also differs slightly. Furthermore, movement-epoch sequence selectivity is potentially expected even under the independent hypothesis: overlap of preparation for the second reach with execution of the first would create a ‘new’ pattern of activity not observed during any single reach. Thus, distinguishing between holistic and independent strategies requires testing more specific predictions.
Derivation of Predictions
Specific predictions are possible because of extensive prior characterization of neural activity in primary motor and premotor cortex during single reaches (for reviews see18,28–30). Reach generation is proposed to be subserved by neural dynamics reflecting three distinct processes: preparation, triggering, and execution25,31. Preparatory activity, typically observed during an instructed delay, has long been hypothesized to be a necessary precursor of voluntary movement13,14. Importantly, preparatory activity also occurs without an instructed delay14,22,25 and can develop rapidly25. Preparatory activity is proposed to seed execution-related activity and thus specify the identity of the upcoming reach. The transition from preparatory to execution-related activity coincides with a large condition-invariant change in the neural state, proposed to reflect movement-triggering input20,32,33.
This paradigm makes it possible to concretely specify competing hypotheses and derive their predictions. Under the holistic strategy (Fig. 2b), both elements of a compound reach are produced cohesively as a single movement. An appropriate preparatory state is established, a trigger signal arrives, and execution-related dynamics generate activity that produces a continuous pattern of muscle activity. Under the independent strategy (Fig. 2c), a compound reach is simply two distinct movements, prepared and executed sequentially. The first is prepared, triggered, and executed as if it were a single reach. Shortly thereafter, these three stages occur a second time. Continuous muscle activity results from the concatenated output.
The holistic and independent hypotheses yield three mutually exclusive predictions. First, preparatory activity should occur once for the holistic strategy and twice for the independent strategy. Second, under the holistic strategy, preparatory activity before a compound reach should differ from that before a corresponding single reach. In contrast, the independent strategy predicts that preparatory activity will be similar, because only the first reach is initially prepared. Third, the holistic strategy predicts a single trigger-related event. The independent strategy predicts each reach will be preceded by its own trigger-related event.
While it is hoped that observations will consistently obey all the predictions of one hypothesis, it is also possible for results to be mixed or fail to follow any of the above predictions. Thus, evaluating these predictions provides not only a test of the two hypotheses, but of the paradigm itself. Partly for this reason, our task also included delayed double-reaches as a reference. The imposed pause between the two reaches, instructed during the initial delay, should dissuade the use of a holistic strategy. Delayed double-reaches thus afford an opportunity to confirm the predictions of the independent strategy when it is likely to be used. This provides a foundation for asking what occurs when there is no pause and the holistic strategy becomes viable.
Single-Neuron Activity
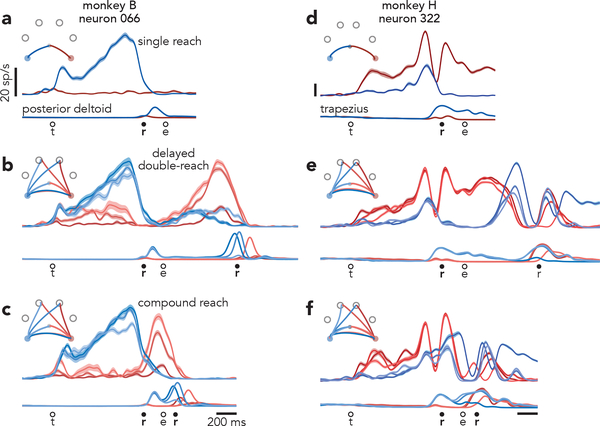
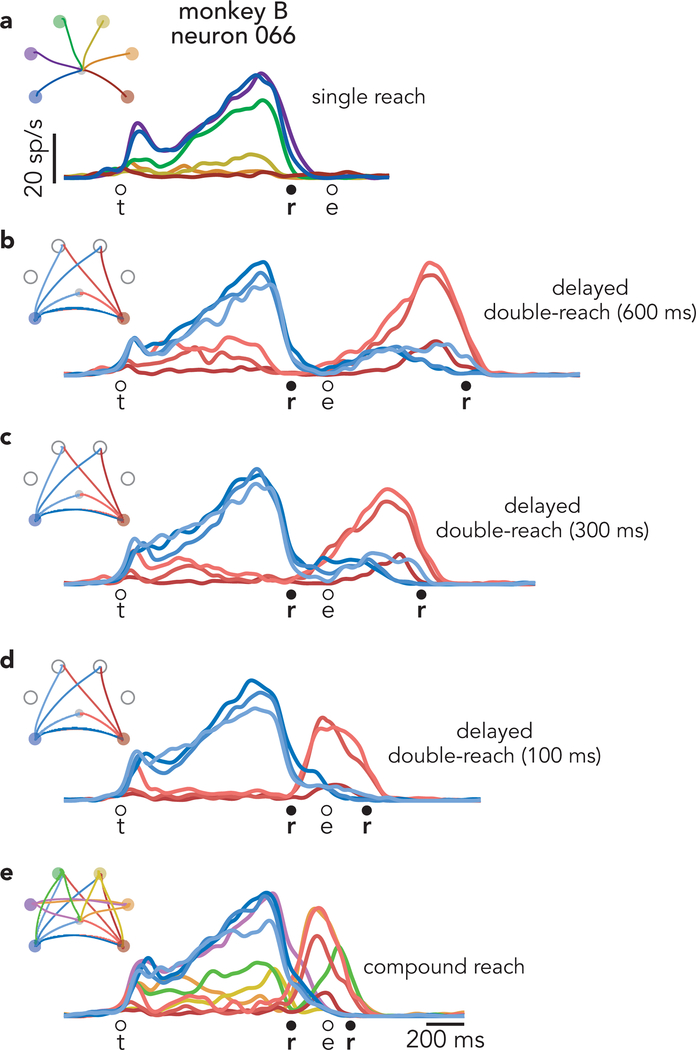
The above predictions must be tested at the population level because most neurons exhibit mixed preparation-related, triggering-related, and execution-related activity. Yet a small percentage of neurons displayed nearly ‘pure’ preparatory activity, allowing some tentative exploration. Consider the response illustrated in Figure 3a. For single-reach conditions, delay-period activity is strongly selective. Selectivity collapses as muscle activity emerges. This pattern held across all conditions (Extended Data Fig. 2) but for simplicity is shown for two target locations that each served as the first reach for three different compound / delayed double-reaches. This neuron’s response is consistent with participation in preparatory, but not execution-related processes. This interpretation is supported by responses during delayed double-reaches (Fig. 3b), where one expects the independent strategy: the first reach should be prepared during the initial instructed delay, and the second should be prepared during the imposed 600 ms pause. Consistent with expectations, this neuron was selectively active during the initial instructed delay, largely silent during the first movement, and active again during the pause (Fig. 3b).
Fig. 3 |. Single-neuron responses.
a, Activity of one neuron, recorded from monkey B during single reaches to bottom-right (red) and bottom-left (blue) targets. Envelopes around individual traces correspond to the standard error of the mean (n > 28 trials for all traces from this neuron). Thin traces at bottom plot the activity of the posterior deltoid. Circles indicate the time of target onset (t), reach onset (r), and reach end (e). All traces are trial-averages of data that have been aligned twice: once to target onset and once to reach onset. See Methods for a complete description of data pre-processing. b, Response of the same neuron and muscle during delayed double-reach conditions. Monkey B performed six such conditions, all of which are shown. For monkey B, delayed double-reaches used fewer combinations than compound reaches, to allow multiple inter-reach pause durations while maintaining reasonable trial-counts. c, Response of the same neuron and muscle during compound reaches. Trace color corresponds to the direction of the first reach. Monkey B performed ten compound reach conditions, but for illustration only those with corresponding delayed double-reach conditions are shown. Data for all conditions is plotted in Extended Data Fig. 2. d, Activity of one neuron, recorded from monkey H during single reaches. Same format as a (n > 19 trials for all traces from this neuron) Thin traces at bottom plot the activity of the trapezius. e, Activity of the same neuron and muscle during delayed double-reaches (same format as b). f, Activity of the same neuron and muscle during compound reaches. Responses during all tested conditions are plotted in Extended Data Fig. 3a.
Compound reaches were executed so rapidly that the two epochs of muscle activity fused (Fig. 3c, bottom). However, the neuron’s response did not shift to the pattern predicted by the holistic strategy. That hypothesis predicts that preparatory activity during the instructed delay should reflect the full two-reach sequence, and thus differ from the preparatory activity before single reaches. Instead, compound reaches that began in the same way shared similar delay-period firing rates. Furthermore, the neuron was active not only before the first reach, but again before second-reach onset, suggesting a second bout of preparation. More broadly, the response pattern during compound reaches (Fig. 3c) resembled that during delayed double-reaches (Fig. 3b) but with a much earlier second peak. Indeed, the compound-reach response lay on a continuum with responses during delayed double-reaches of different pause durations (Extended Data Fig. 2). These observations suggest that the independent strategy, employed during delayed double-reaches, continues to be employed during compound reaches.
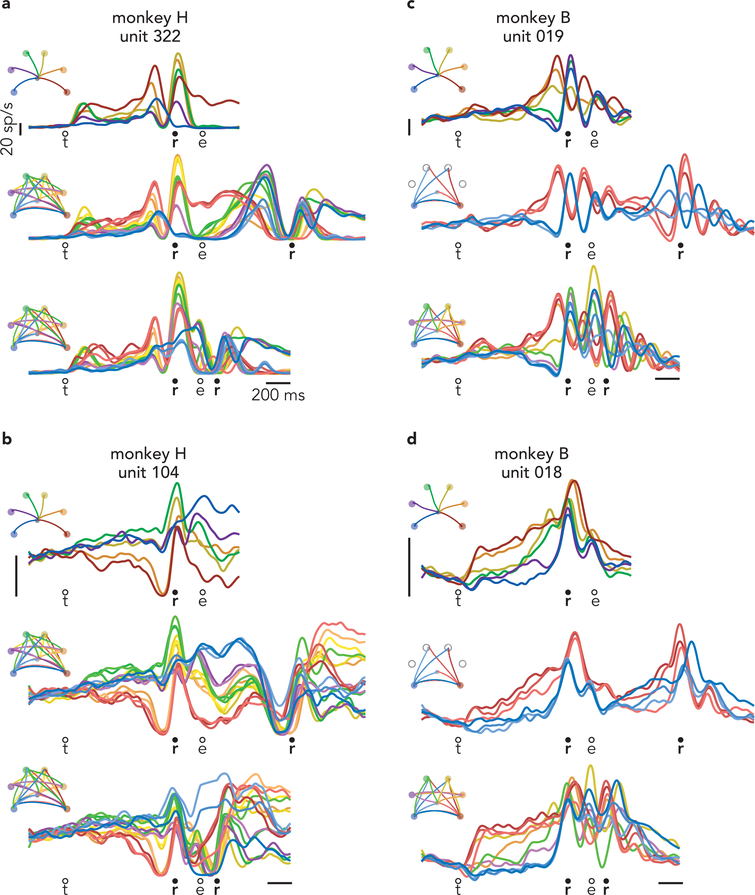
Of course, little can be concluded from the response of one neuron; its response could be unrepresentative, and it allows examination of a minority of predictions. A challenge when considering all neurons is that most are active during both preparation and execution. Responses are typically complex even during single reaches (Fig. 3d) and more so during delayed double-reaches (Fig. 3e) and compound reaches (Fig. 3f). When considering all conditions, most neurons have bafflingly complex responses (Extended Data Fig. 3) making it impossible to draw conclusions via inspection. Testing the competing predictions of the independent and holistic strategies therefore requires leveraging population-level analyses.
Time-course of Preparatory Activity
Preparatory and execution-related signals were recently shown to be separable via projection onto orthogonal dimensions25,34. Identifying those dimensions requires leveraging task epochs where preparation occurs without execution and vice versa. In our task, there is no movement during the instructed delay or during the pause between delayed double-reaches. Yet the pending reach is presumably prepared at these times. Conversely, execution is (by definition) occurring during single reaches, each delayed double-reach, and the final reach of compound reaches – times when preparation is unlikely because there is no immediately pending movement. We used activity from these epochs to define 20 preparatory and 20 execution dimensions. This approach carries a caveat: dimensions optimized to capture preparation before one set of reaches (e.g., slow reaches) may sub-optimally capture preparation before different reaches (e.g., fast reaches). Our preparatory dimensions were optimized to capture preparation for single reaches and the second delayed double reach. None of these reaches are identical, at the level of muscle activity, to the second compound reach (though the latter comes close). Thus, preparatory dimensions may not perfectly capture any preparation before second compound reaches. This limitation is acceptable if one is conservative when interpreting measures of variance captured.
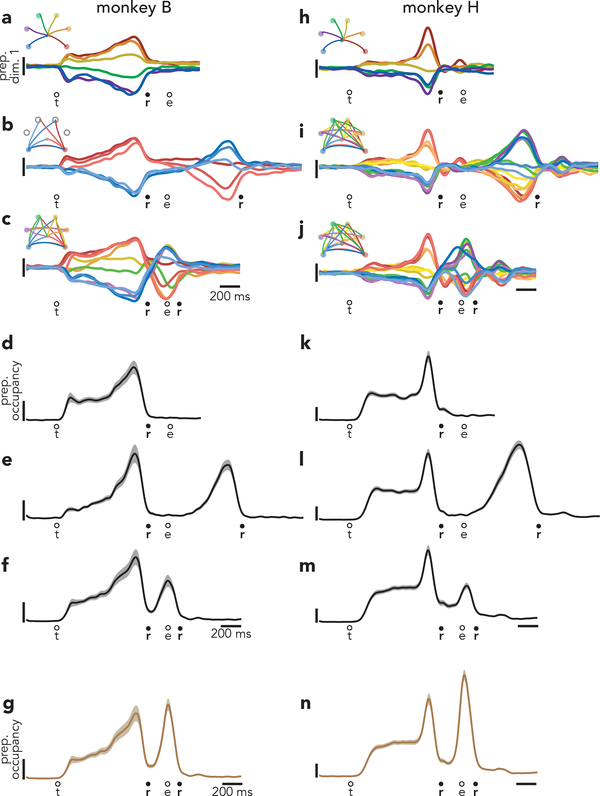
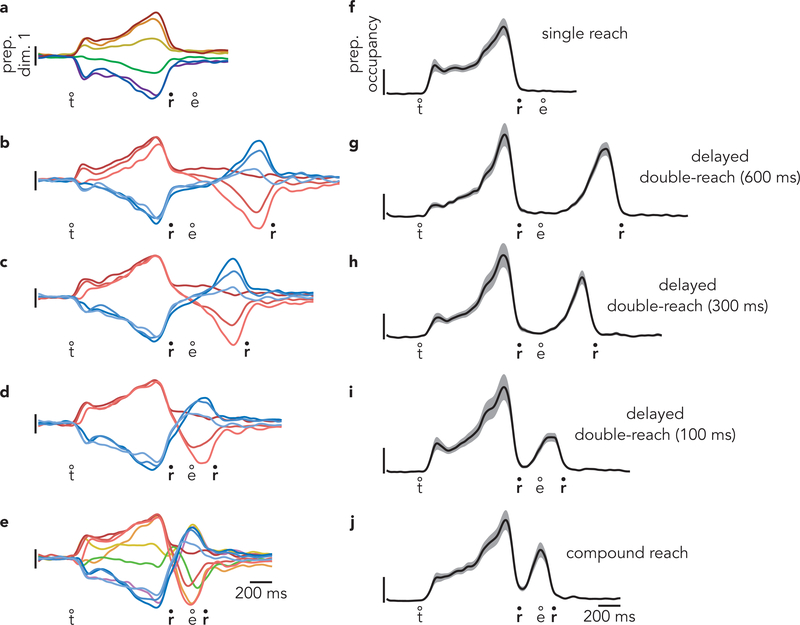
Projecting population data onto the first preparatory dimension (Fig. 4a–c) yields a response similar to a single-neuron PSTH (with greater symmetry due to mean-centering during preprocessing, Methods). This resemblance is expected: the patterns captured by these dimensions are building blocks of single-neuron responses. For example, the first preparatory dimension was the primary contributor to the response of the example neuron in Fig. 3a–c. As expected, during delayed double-reaches, activity obeyed predictions of the independent strategy (Fig. 4b). There were two bouts of strong selectivity: one before each reach. Activity before the first reach was similar to that before the corresponding single reach. Red traces cluster together and resemble the response before a single down-and-right reach. Blue traces cluster together and resemble the response before a single down-and-left reach. During the second bout of preparation, the order of the traces largely inverts, in agreement with the physical reversal of the reach (when the first was rightwards, the second had a leftwards component).
Fig. 4 |. Time-course of activity in preparatory dimensions.
a, Projection of population activity, during single reaches, onto the first preparatory dimension. Data are from monkey B. Unlike in Fig. 3, data are shown for all conditions. Vertical scaling is arbitrary and conserved across panels. Circles indicate the time of target onset (t), reach onset (r), and reach end (e). b, The same projection for delayed double-reaches. c, The same projection for compound reaches. Note that monkey B performed four fewer 600 ms delay double-reach conditions than compound reach conditions. d, Preparatory subspace occupancy (for all 20 dimensions) during single-reach conditions. Shaded regions indicate the standard deviation of the sampling error (equivalent to the standard error of the mean) estimated by resampling individual units (n = 1000 resampled populations). Because occupancy is a measure of normalized firing rates, the units are arbitrary. e, Preparatory subspace occupancy during delayed double-reaches. f, Preparatory subspace occupancy during compound reaches. g, Same as f, but preparatory dimensions were found using an expanded range of times that included activity during the brief dwell-period between compound reaches. h-j, Same as a-c but for monkey H. Note that monkey H performed more two-reach conditions than monkey B. k-n, Same as d-g but for monkey H. Occupancy just prior to the second reach in compound reach conditions (f,m) was significantly greater than the occupancy during the same time period of single reaches for both monkeys (p < 0.001 for both monkeys via a bootstrap procedure; see Methods).
During compound reaches, activity in the first preparatory dimension (Fig. 4c) obeyed predictions of the independent strategy and violated predictions of the holistic strategy. There were two bouts of preparatory subspace activity. The first occurred during the instructed delay, and the second peaked just as the first reach ended. There was no evidence that the first bout of preparation reflected the two-reach sequence. The ten traces in Fig. 4c are color-coded by first-reach identity. The pattern of preparatory activity before the first reach was nearly identical to that before single reaches (Fig 4a).
More broadly, the pattern of activity in this dimension during compound reaches was very similar to that during delayed double-reaches, with the exception of timing. For delayed double-reaches, the second bout of preparation occurred when the hand was stationary during the imposed pause. For compound reaches, the second bout of preparation occurred essentially contiguously with the decline of the first bout, and developed while the hand was in flight. Because monkey B performed delayed double-reaches with multiple instructed pauses, we could ask whether activity during compound reaches lay on a continuum with those conditions. This was indeed the case (Extended Data Fig. 4). Thus, activity in the first preparatory dimension was consistent with the hypothesis that, during compound reaches, only the first reach is prepared during the instructed delay period and the second reach is then prepared as the hand is in flight.
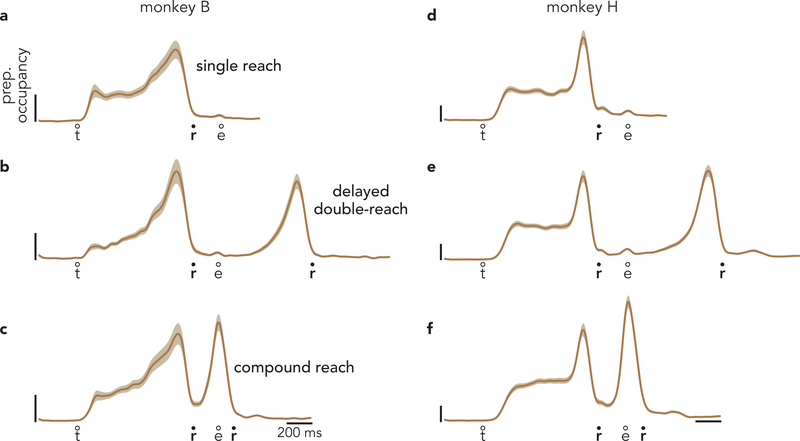
To assess activity across all preparatory dimensions, we computed preparatory subspace occupancy: the across-condition variance of the neural state. For single-reach conditions (Fig. 4d) the preparatory subspace was occupied during the instructed delay but not during the reach22,25,34. For delayed double-reaches (Fig. 4e; Extended Data Fig. 4g,h,i), the preparatory subspace was occupied twice, once before each reach. This continued to be true for compound reaches (Fig. 4f), consistent with the results observed above. For compound reaches, the second peak was smaller than the first. This might seem to suggest that the second bout of preparation is weaker. However, a smaller second peak is expected for technical reasons. To be conservative, activity before the second compound reach was not used when optimizing preparatory dimensions (see above). If one allows optimization to include that epoch, the two peaks are of comparable size (Fig. 4g, Extended Data Fig. 5).
Results were similar for monkey H (Fig. 4h–n). Compound reaches involved two bouts of preparation (Fig. 4j,m,n). During the first bout, selectivity matched that before single reaches and before delayed double-reaches (compare order of colored traces across panels h-j).
Patterns of Preparatory Activity
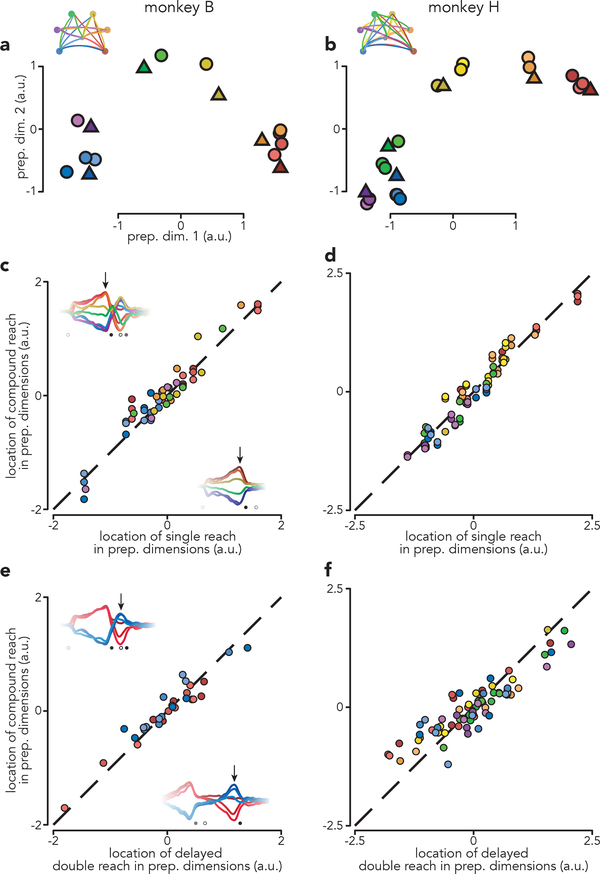
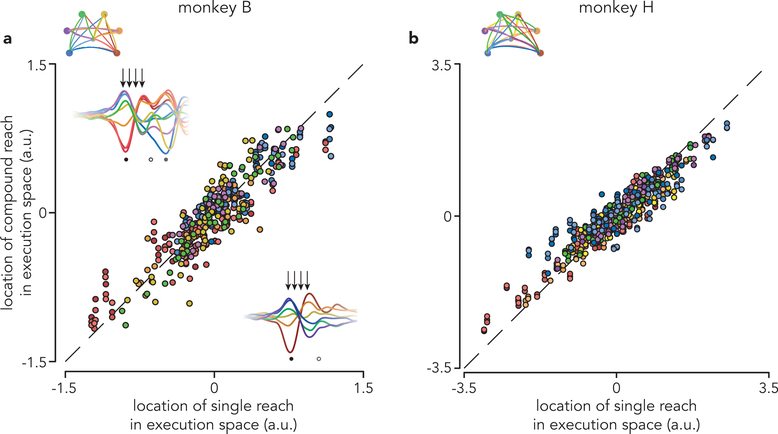
The analysis above indicates that delay-period activity before compound reaches is similar to that before corresponding single reaches. To quantitatively assess similarity, we considered the pattern of preparatory subspace activity 120 ms before first-reach onset. This time corresponds to when preparatory activity is hypothesized to influence execution-related activity25 and is approximately when it reaches peak strength. In the top two preparatory dimensions, the pattern of neural states resembled the spatial layout of the reach targets (Fig. 5a,b). This was true even though preparatory activity is not a literal representation of target location16. For compound reaches (circles) preparatory states clustered according to first-reach identity. For example, blue circles correspond to three compound reaches that all begin with a down-and-left reach. These cluster near the state before a single down-and-left reach (blue triangle), despite involving dissimilar second reaches. Across the top five preparatory dimensions and all conditions, the location of the preparatory state before a compound reach was always similar to that before the corresponding single reach (Fig. 5c,d; ρ = 0.96 for both monkeys; p < 0.0001 for both). Subsequent patterns of first-reach execution-related activity were also very similar (ρ = 0.91 and 0.93, monkey B and H, p < 0.0001 for both; Extended Data Fig. 6).
Fig. 5 |. Patterns of preparatory activity.
a, Projections of population activity, just before first-reach onset, onto the top two preparatory dimensions. Triangles represent single reach conditions. Circles represent compound reach conditions. Marker colors indicate first-reach direction. Data are from monkey B. b, Same as a but for monkey H. Monkey H performed more compound reach conditions than monkey B. c, Comparison of preparatory activity, before first-reach onset, between compound and single reaches. Each circle plots the location of activity before one compound reach versus that for the corresponding single reach. Each such comparison yields five datapoints, one for each of the top five preparatory dimensions. Dashed line indicates unity slope. Data are for monkey B. Arrows on each inset indicate when preparatory subspace activity was assessed, 120 ms before reach onset. Results were virtually identical when we used times earlier in the delay: the correlation was ρ = 0.96 regardless of whether preparatory activity was assessed 120 ms, 220 ms, or 320 ms prior to reach onset (p<0.0001 in each case).d, same as c but for Monkey H. Again, results were insensitive to the exact time when preparatory activity was assessed: ρ = 0.96, 0.97 and 0.95 for the three times (p<0.0001 in each case). e, Comparison of preparatory activity, prior to the second reach, between compound reaches and matched delayed double-reaches. Arrows on each inset indicate when preparatory subspace activity was assessed. f, same as e but for monkey H.
These results are consistent with the independent strategy, which hypothesizes that only the first reach is prepared during the instructed delay. Although preparatory activity before single and compound reaches was not identical (correlations were 0.96, not unity) it was as similar as could be expected given that the reaches themselves were not truly identical (muscle-activity correlations were 0.93, see above). The similarity of preparatory patterns would not be expected under the holistic strategy, which predicts that preparatory activity, before the first reach, should take into account the full sequence. A related prediction of the holistic strategy is that the ability to predict preparatory activity, from the parameters of the first reach alone, should be compromised for compound reaches. Instead, preparatory activity was equally well-predicted from first-reach muscle activity for single and compound reaches (Extended Data Fig. 7).
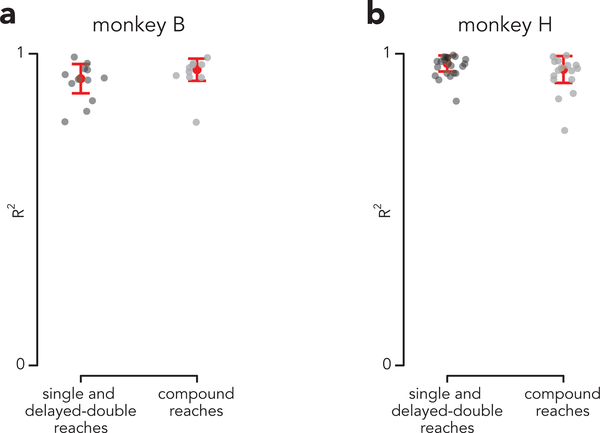
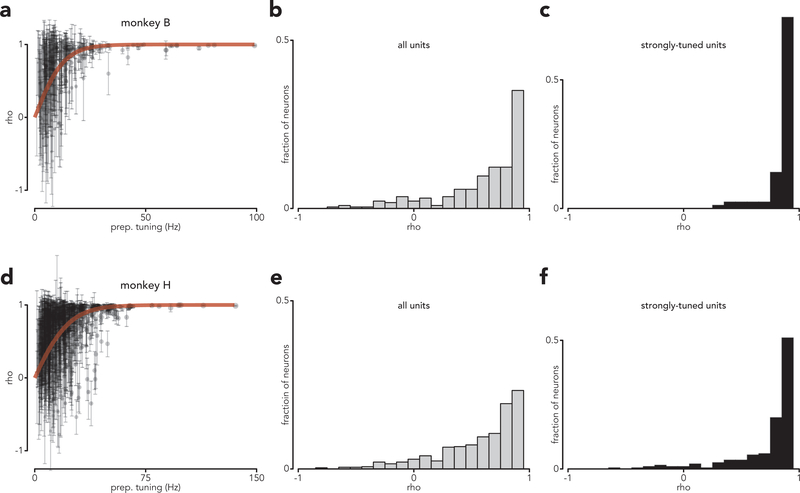
The above analysis focused on the top five dimensions because each of the additional fifteen captured, on its own, little variance. Results were nearly identical when extended to all twenty preparatory dimensions: ρ = 0.92 and 0.92 for both monkeys (p < 0.0001 for both). Because these dimensions capture the majority of response variance, what holds in that subspace should hold for individual neurons (with the caveat that single-neuron measurements will be noisier). This was indeed the case. The distribution of correlations had a mode near one, and correlations asymptotically approached unity as a function of the strength of preparatory tuning (Extended Data Fig. 8).
Under the independent strategy, not only should compound reaches involve two bouts of preparation, the second bout should reflect the second reach much as if it were performed in isolation. Put differently, it should matter little whether second-reach preparation occurs with the hand stationary or still in flight. This prediction can be tested because muscle activity was fairly similar (though not identical) during the second half of compound and delayed double-reaches. The independent hypothesis thus predicts considerable similarity between the corresponding preparatory states. This was indeed the case (Fig. 5e,f; ρ = 0.96 and 0.90, monkeys B and H, p < 0.0001, both monkeys).
Trigger-Related Signals
The dominant aspect of the motor cortex response is a ‘condition invariant signal’ (CIS) that begins ~150 ms before reach onset and is highly predictive of the moment of reach onset20,21. A similar CIS occurs in recurrent networks trained to produce reach-related muscle activity31, and relates to the triggering of output-generating dynamics. In agreement, the dominant response component in mouse motor cortex during reaching depends upon thalamic inputs, whose silencing interrupts execution32,33. Under the assumption that the CIS relates to movement triggering, there should be a monophasic CIS if compound reaches are generated holistically and a biphasic CIS if they are generated sequentially.
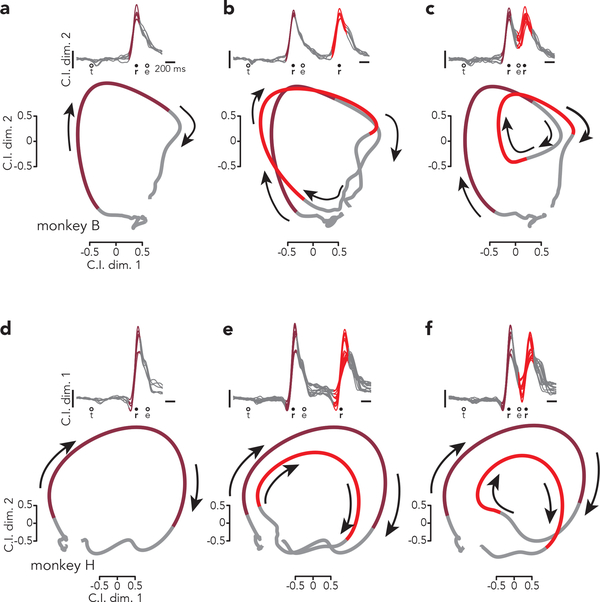
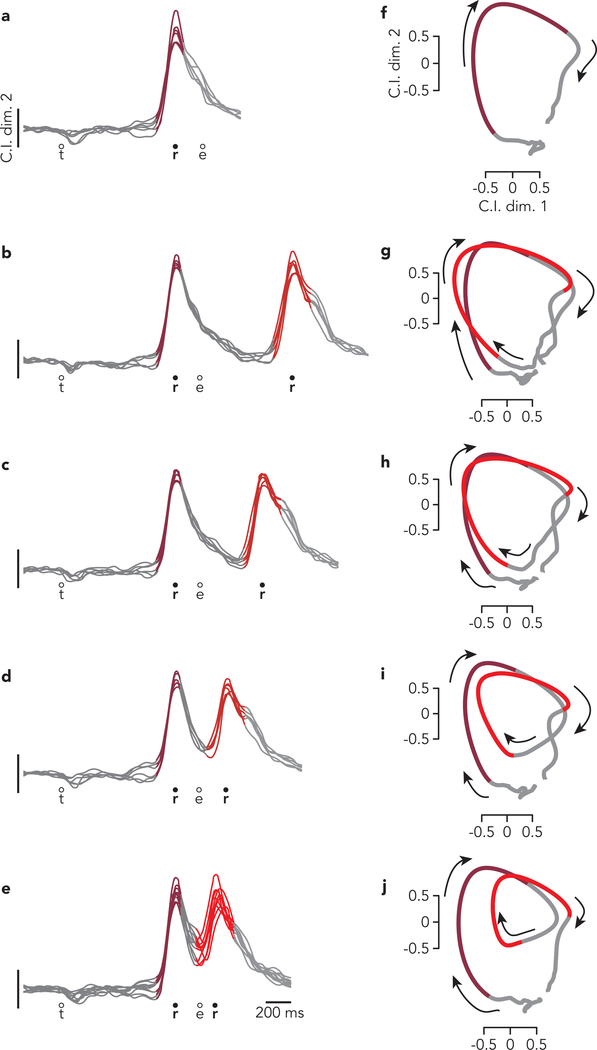
We identified two condition-independent (CI) dimensions where activity was time-varying but largely independent of reach direction (88% and 82% condition-invariant structure, monkey B and H). We first consider the projection onto one such dimension (Fig 6., top sub-panels). During single reaches there was a large change in the neural state beginning ~150 ms before reach onset and peaking around reach onset (Fig. 6a,d). There were two peaks during delayed double-reaches (Fig. 6b,e) and also during compound reaches (Fig. 6c,f).
Fig. 6 |. Evolution of the condition-invariant signal.
a, Top: Projections of population activity from all single-reach conditions onto one condition-invariant dimension (the second, which best captured the rapid rise). The colored region of each trace highlights peri-reach activity (from 150 ms before reach onset until 150 ms before reach end). Circles indicate the time of target onset (t), reach onset (r), and reach end (e). Bottom: State-space projections of the same activity onto two condition-invariant dimensions. Because the projection is similar for all conditions, the average is shown to simplify presentation. As above, trace color highlights peri-reach activity. Arrows indicate the temporal evolution of activity. b, Same as a but for delayed double-reaches. The two colored regions indicate peri-reach activity for the two reaches. c, Same as b but for compound reaches. d-f, Same as a-c but for monkey H.
In prior studies20,21, state-space visualizations employed one CIS dimension, with the other dimensions capturing condition-specific structure. Here, to concentrate on CIS-related predictions, we employ a state-space spanned by both CI dimensions and plot a single condition-averaged trajectory (colored trajectory segments indicate peri-reach times). Activity in the CIS dimensions returns, after a reach, close to its location before the reach (Fig. 6a,d). This forms a loop, but should not be interpreted as reflecting the rotational dynamics that describe condition-specific activity31,35; those dynamics unfold in dimensions orthogonal to those shown here. During single reaches (Fig. 6a,d) the looping CIS trajectory was traversed once. There were two loops during delayed double-reaches (Fig 6b,e). Because there was time for the trajectory to relax to baseline between reaches, the second loop simply began from the same region as the first. During compound reaches, the trajectory also displayed two loops (Fig 6c,f), with the second loop beginning before the first had fully relaxed. This timing lay on a continuum with that observed for delayed double-reaches with different pause durations (Extended Data Fig. 9).
M1 and PMd Both Obey Predictions of the Independent Strategy
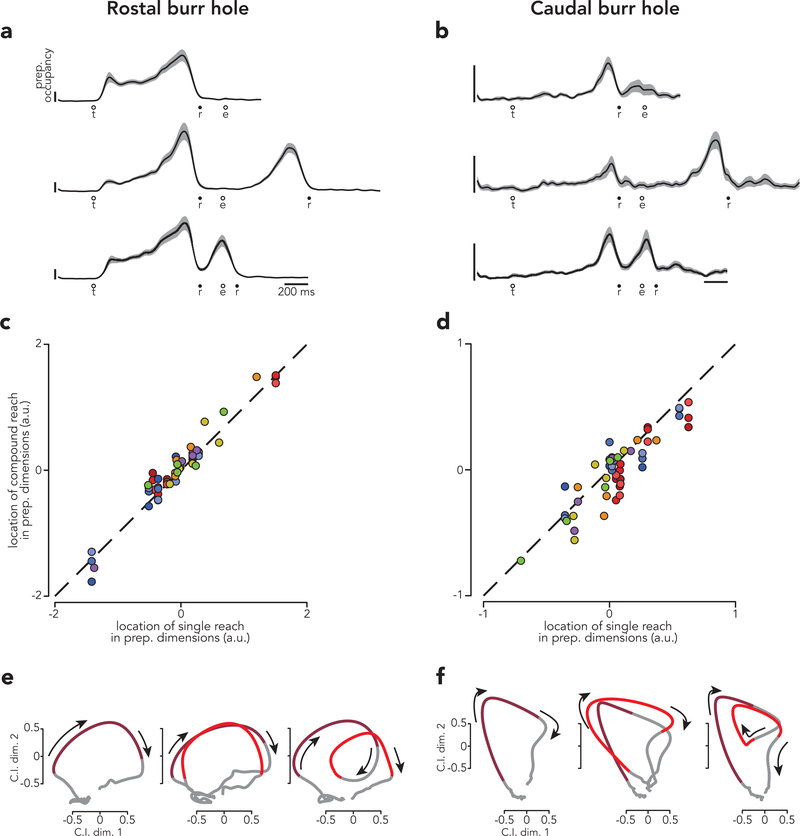
Might there be anatomical differences not revealed by the above analyses? Might PMd obey the predictions of the holistic strategy while M1 obeys the predictions of the independent strategy? For monkey B, recordings spanned a considerable rostro-caudal range, allowing us to divide neurons into rostral and caudal populations, enriched with PMd units and M1 units, respectively. Both populations unambiguously obeyed the predictions of the independent strategy (Extended Data Fig. 10). The most notable difference was expected: relatively weaker preparatory activity in the caudal population14,36.
An RNN that Generates Compound Reaches
The empirical results universally agreed with the predictions of the independent hypothesis. We found this surprising. Not only did we expect that motor cortex would holistically generate compound reaches, it seemed implausible that it could do otherwise. Given the rapid pace of execution, the independent strategy requires that preparation for the second reach occur during execution of the first. That overlap has some precedent: preparatory and execution-related activity overlap during reach initiation (the former wanes as the latter emerges25) and also during corrections22. However, in these cases the proposed purpose of preparatory activity is a near-immediate impact on execution-related activity. This accords with the proposal that a mechanistic purpose of preparatory activity is to seed execution-related activity16,17,35. How can preparatory activity do so for the second reach without disrupting the ongoing first reach?
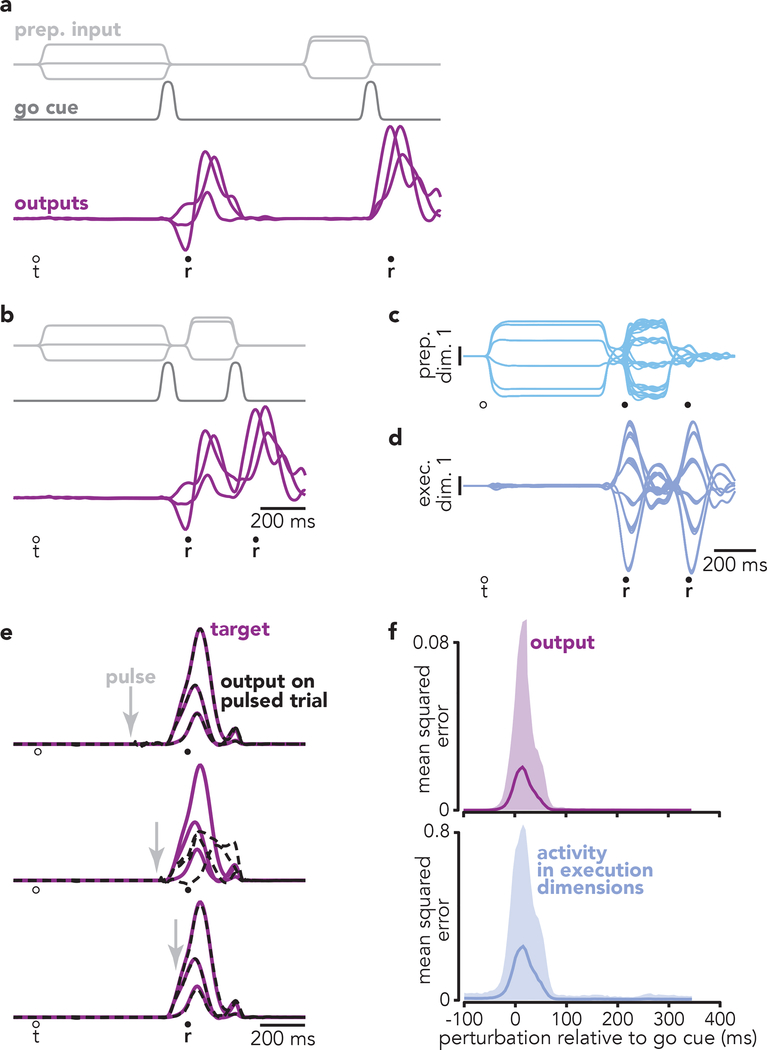
To address this question, we trained a recurrent neural network to produce patterns of reach-related muscle activity (Fig. 7). As in Sussillo et al.31, the network received two input types. The first was a three-dimensional preparatory input specifying reach identity (light gray traces). The second was a condition-independent ‘go cue’ (dark gray trace) which prompted the network to produce the muscle-activity pattern for that reach (purple traces). We trained the network to generate two reaches on each trial, driven by two bouts of preparatory inputs and two go cues. Go-cue separation was variable and could be relatively long (Fig. 7a) or as short as 300 ms (Fig. 7b). In the latter case, the second set of preparatory inputs arrived while the network was still generating muscle activity for the first reach.
Fig. 7 |. A recurrent network trained to generate reach sequences.
a, On each trial, the network was required to produce two ‘blocks’ of output (purple traces), each consisting of the empirical reach-related activity of six muscles (only three of which are plotted for clarity). Muscle activity was recorded from monkey B. The network received both a three-dimensional condition-specific ‘preparatory’ input (light gray traces) and a one-dimensional condition-invariant go cue (dark gray trace). On this example trial, the network was required to produce the two blocks of output (two ‘reaches’) with a long pause between. b, Example trial where the inputs required the network to produce a ‘compound reach’: two blocks of output with no pause between them. c, Projections of network activity onto the first preparatory dimension. Each trace plots activity for one of 36 compound reaches. Preparatory and execution dimensions were found using the same method applied to the neural data. d, Projections of network activity onto the first execution dimension. e, Impact of perturbations (brief pulses) applied to the inputs that normally convey preparatory signals. Each subpanel plots the target (purple) and actual (black dashed) output. Three (of six) output dimensions are shown for simplicity. Arrows indicate the time when the perturbation was delivered. Same time-scale as a and b. f, Top: Impact of perturbations on network output as a function of perturbation time. Mean squared error (between normal and actual network output) was calculated over a 200 ms window beginning at perturbation onset. Shaded region indicates the range into which 95% of effects fell (n = 1000 perturbations). Bottom: same but for the impact on activity in the execution dimensions.
By design, the network had to employ the independent strategy – the second reach was not specified until the arrival of the second preparatory input. We expected this scenario might be challenging and that the network might fail or adopt an idiosyncratic strategy. In fact, the network readily produced the target muscle-activity patterns (R2 > 0.99) even for short go-cue separations. Projections of network activity onto preparatory and execution dimensions (Fig. 7c,d) revealed that the second bout of preparatory activity did indeed overlap with execution-related activity for the first reach. Despite that overlap, the first-reach output was generated just as it would have been without a second reach.
To determine how the network accomplished this, we employed brief input pulses that transiently perturbed activity in the preparatory dimensions. Because preparatory dimensions are ‘muscle-null’, their influence on the output occurs via the rest of the network and is amenable to modulation. Perturbations allowed us to probe at what times, relative to the go cue, preparatory activity influenced network output. Perturbations coinciding with the go cue disrupted network output (Fig. 7e, middle) while earlier or later perturbations had no effect. As a result, the influence of preparatory activity on network output was restricted to a narrow window around the go cue (Fig. 7f). Critically, that influence was negligible by ~80 ms after the go cue (Fig. 7f, top), as was any impact on execution-related dimensions (Fig. 7f, bottom). Thus, not only is preparatory activity muscle-null, it is ‘dynamically-null’37 except during a brief window opened by the go cue. This allowed the network to develop preparatory activity, appropriate for the second reach, while the first reach was still being generated.
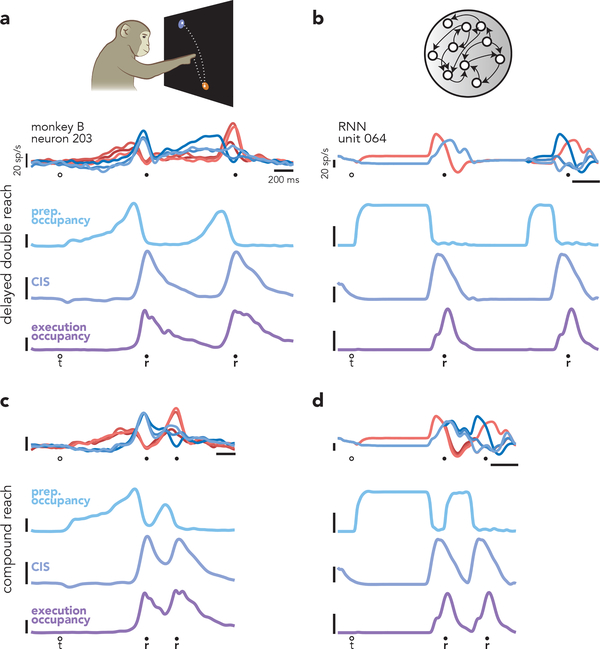
Many of the basic features of the empirical data were replicated by the network model. Like empirical neurons (Fig. 8a), model units exhibited complex responses with mixed preparation-related and execution-related activity (Fig. 8b). Despite such mixing, preparatory and execution-related activity in the model occupied orthogonal subspaces, making it possible to plot projections that captured nearly pure preparatory (Fig. 7c) or execution-related (Fig. 7d) activity. Such orthogonality is noteworthy because it is a consistent feature of empirical data, but is not typically observed in networks trained to produce only single reaches31,34. For both data and model, a given reach involved a stereotyped set of events: preparatory-subspace occupancy increased, a CIS developed, and execution occupancy immediately followed. These events were consistent with the independent strategy, both when reaches were temporally separated (Fig. 8a,b) and when they occurred in rapid succession (Fig. 8c,d).
Fig. 8 |. Similarities between motor cortical activity and network activity.
a, Summary of motor cortical activity during delayed double-reach conditions. Although preparatory-, triggering-, and execution-related signals are mixed at the level of single neurons (top) these signals occur in orthogonal dimensions. Before each reach, preparatory dimensions are the first to become occupied (light blue trace). Preparatory occupancy falls ~150 ms before reach onset. At approximately the same time, a condition-invariant signal (violet trace) occurs and occupancy of execution dimensions (dark purple trace) increases. This same pattern is repeated prior to the second reach. Vertical scale is arbitrary but is preserved in panel c. b, A similar sequence of events occurred in the network, which was trained to produce the empirical patterns of muscle activity from monkey B. The most notable difference between motor cortex and the network is the shape of the temporal envelope of preparatory occupancy. For the network, this results from the envelope of the network inputs; a more realistic pattern could be produced simply by altering that envelope, with essentially no change in network output. c, During compound reaches, motor cortex displayed the same sequence of events as during delayed double-reaches, but with the second instance of the prepare-trigger-execute motif occurring soon after the first. d, Similarly, the network produced compound reaches via the same sequence of events that produced delayed double-reaches.
Discussion
The Independent Strategy Can Produce Rapid Movement Sequences
Motor sequences have been studied for over one hundred years38, yet the contribution of low-level computations has remained unclear. Does a rapidly unfolding motor sequence require individual elements to be fused into larger cohesive units? Or can motor cortex leverage a unified strategy to generate sequences at different paces?
In our task, compound reaches potentially appeared to be holistically generated at the level of the muscles: muscle activity formed one continuous pattern spanning the full compound reach. Nevertheless, motor cortical activity revealed that component reaches were prepared and executed independently. Thus, rapid execution of compound reaches depends not on generating the sequence holistically, but on the ability to rapidly and accurately achieve the correct preparatory state for the next reach while the current reach is still underway. Practice presumably facilitates skillful sequence production by promoting this rapid and accurate preparation39 and by allowing an individual to learn the subtle ways in which the muscle activity required for a given movement may depend on the state of the plant following the previous movement.
Our results accord with the conclusion that practice-related improvements in sequence performance derive from factors other than fusing movement elements8. Yet neither our results, nor those behavioral results, imply that it is impossible to holistically generate a multi-element movement. Indeed, an RNN will readily implement a holistic strategy if trained to do so (data not shown). Our goal was not to determine whether the holistic strategy is possible, but whether a holistic strategy is essential to the rapid production of motor sequences. Based on our findings, it is clear that a holistic strategy is not necessary for motor cortex to generate rapid sequences, nor does it emerge from extensive practice.
Reconciling the Independent Strategy with Sequence Selectivity
Multiple studies9–11, have found motor and premotor cortex neurons with sequence selectivity. Yet a recent fMRI study12 found that the M1 BOLD signal does not show evidence of sequence-specific activity. The greater prevalence of sequence selectivity in single-neuron responses likely has two sources. First, with sufficient trial counts, responses will inevitably show significant differences between movements performed alone versus within a sequence, simply because behavior cannot be perfectly matched. Second, electrophysiology studies defined ‘sequence selectivity’ broadly: any response that depends upon the presence or identity of the next movement. Such dependence will be common when preparation and execution overlap. In12, ‘sequence encoding’ was defined as a departure from the linear sum of activity during constituent movements. A linear sum more accurately captures expectations under the independent strategy. The lack of sequence selectivity in12 thus agrees with our findings; overlapping preparation and execution would not (assuming linearity) produce sequence selectivity under that stricter definition.
Extending the Prepare-Trigger-Execute Model
The prepare-trigger-execute paradigm was developed in the context of single reaches and how they could be generated by networks with strong dynamics arising from intra-area recurrence, between-area recurrence, and/or sensory feedback. This framework was not guaranteed to generalize to more complicated behavior. The data could have agreed with some predictions of one hypothesis and some of the other, or with neither, indicating that the paradigm must be reevaluated. Instead, the data invariably obeyed the predictions of the independent strategy. These results serve not only to support one hypothesis and reject the other, but also to demonstrate the utility of the paradigm used to couch the hypotheses and generate the predictions.
Our results also help extend the prepare-trigger-execute paradigm. Preparation has historically been considered a time-consuming process17,36,40 and thus to contribute to the longer time between sequence elements at chunk boundaries5. This made it reasonable to assume that minimizing temporal separation required a holistic strategy. Yet preparation can be remarkably swift for well-practiced movements25,41. The present results confirm this swiftness, and illustrate that preparation can overlap execution without interference. Given this, preparation need not prevent one movement from following another with zero latency, or even negative latency, as has been proposed to occur during corrective movements42.
Relatedly, Ames et al.22 found that preparatory dimensions become occupied during movement when a jumping target required an immediate correction, and Stavisky et al.43 found that the response to an unexpected visual perturbation occurs first in an output-null space before flowing into an output-potent space. In both these situations, the presumed goal of preparatory-subspace activity was to immediately impact motor output. The present findings show that it is also possible for the preparatory subspace to be occupied without altering an ongoing movement. This presumably depends upon the orthogonality of preparation and execution-related dimensions. Such orthogonality naturally appeared when we pushed networks at a pace that required preparation and execution to overlap, providing a possible explanation for a consistent feature of the empirical population response. Additionally, the orthogonality of preparatory and execution dimensions may relate to optimal control of preparatory activity44.
Generating Sequences of Actions
The use of the independent strategy by motor cortex implies that sequence generation requires close coordination between motor cortex, which produces low-level motor commands, and upstream regions, which specify the identity and timing of each individual action. Prior work suggests that upstream computations are distributed across a range of cortical12,45,46 and subcortical47,48 areas. The nature of those computations remains an open question. Under competitive queuing models, each element is encoded simultaneously prior to sequence initiation, with order determined by the relative strength of each element’s representation47,49. Alternatively, sequences (or long, continuous actions) could be guided by time-evolving trajectories through neural state-space50. It is plausible that both strategies are used but by different brain areas.
Although skillfully and rapidly performing a sequence does not depend on a holistic strategy at the level of motor cortex, there are cases where skilled action depends on replacing elements with a new movement4. For example, when learning to sign their name, a person transitions from writing each letter deliberately to producing the entire signature in fewer, smoother strokes. Of course, the shape of individual letters changes throughout this process, as do the patterns of muscle activity that produce them. There is thus an important distinction between learning to more rapidly link elements (but preserving the elements themselves) and replacing one set of actions with an entirely new one that serves a similar high-level goal but is otherwise a different movement45. The former can be driven by an independent strategy while latter requires a holistic strategy by definition.
Methods
Subjects and Task
Subjects were two adult, male macaques (monkeys B and H, Macaca mulatta, 15 and 9 years old, respectively). Animal protocols were approved by the Columbia University Institutional Animal Care and Use Committee (AC-AAAM2550). Experiments were controlled and data collected under computer control (Speedgoat Real-time Target Machine). During experiments, monkeys sat in a customized chair with the head restrained via a surgical implant. Stimuli were displayed on an LCD monitor in front of the monkey, and a tube dispensed juice rewards. The left arm was comfortably restrained, and the task was performed with the right arm.
Hand position was monitored using an infrared optical system (Polaris; Northern Digital) to track (~0.3 mm precision) a reflective bead temporarily affixed to the third and fourth digits. Each trial began when the monkey touched and held a central touch-point. After holding for 400–600 ms (randomized) targets appeared – one for single reach conditions and two for delayed double-reach and compound reach conditions. There were six possible target locations, arranged radially 140 mm from the touch-point. Targets were round and had to be hit with within 25 mm of their center. A condition was defined by target location(s) and whether success required a single reach, a delayed double-reach, or a compound reach. Conditions were interleaved using a block-randomized design. Within a block of trials, each condition was presented once. The order of the conditions within a block was random.
For single reach conditions, a 20 mm diameter green target appeared at one of the six locations. After a variable delay period (0–1000 ms), the target doubled in size and the central touch point disappeared. These events served as salient go cue, instructing the monkey to reach. Reaches were successful if they were initiated 100–500 ms after the go cue, lasted <500 ms, and stayed on the target for 600 ms with minimal hand motion. These requirements were conserved across all conditions.
For compound reach conditions, two targets appeared simultaneously. Target color indicated the first (green) and second (blue) targets. After a variable delay period (0–1000 ms) both targets grew in size and the touch point disappeared, providing the go cue. The monkey then captured the first target and was immediately given a juice reward. After capturing the second target (and holding for 600 ms) the monkey was given a second juice reward. During compound reach conditions, we encouraged the monkey to capture the second target as quickly as possible after capturing the first. We used a speed threshold (70 mm/sec, roughly 5% of peak velocity) to determine when the first target was captured. As soon as hand velocity fell below this threshold, the second target began to shrink rapidly, such that it disappeared (and the trial was aborted) after 350 ms. Shrinking stopped when the second reach began, providing incentive to do so quickly. In practice, monkeys reached considerably faster than required, with a median pause between reaches of 119 ms (monkey B) and 137 ms (monkey H).
Delayed double-reach and compound reach conditions began similarly, with both targets displayed simultaneously. The key difference was that, for delayed double-reaches, the first target was colored green only in its center (the rest was white). The diameter of the green center indicated the duration of the imposed pause between reaches. Diameters of 8 mm, 14 mm, and 18 mm indicated pauses of 600 ms, 300 ms, and 100 ms. The imposed pause began when the hand reached the first target. At that moment, the green center began to grow at a constant rate. The monkey’s hand was required to remain within the target with minimal movement until the target was all green. Immediately after becoming all green, the first target disappeared and the second target instantly grew in size, indicating that the monkey was now permitted to reach towards the second target. A successful second reach required initiation within 500 ms (<100 ms reaction times were allowed here, as the time of the second go cue was predictable) and then holding the final target for 600 ms. Reward was delivered after both the end of the pause between reaches and at the end of the final hold period.
Compound reaches involved one of sixteen two-reach combinations. Ideally, all of these would also have been performed as delayed double reaches, each at multiple pause durations. To maintain reasonable trial-counts we employed a compromise. Monkey B experienced three pause durations (600, 300 and 100 ms) but only six delayed double-reach combinations. Monkey H experienced only a 600 ms pause duration, and performed sixteen delayed double-reach combinations.
Neural and Muscle Recordings
After initial training, we performed sterile surgery to implant a head restraint and cylindrical recording chamber, positioned to give access to the arm area of dorsal premotor cortex (PMd) and primary motor cortex (M1). Recordings were performed in the left hemisphere. Chamber positioning was guided by structural magnetic resonance imaging prior to implantation. We used intra-cortical microstimulation to confirm that recordings were from the forelimb region of motor cortex (biphasic pulses, cathodal leading, 250 ms pulse width delivered at 333 Hz for a total duration of 50 ms). Microstimulation typically evoked contractions of the shoulder and upper-arm muscles, with current thresholds between 20μA-200μA, depending on location and stimulation depth (a wide range of current thresholds is expected, as we recorded in both M1 and PMd and from a variety of depths). We recorded single-neuron responses using one or more 32-channel linear-array electrodes (S-probes; Plexon) lowered into cortex using a motorized microdrive (Narishige International). Neural signals were amplified, filtered, and saved using Blackrock Microsystems hardware, Neural Signal Processor (Blackrock Microsystems), and Central Suite (Blackrock Microsystems). Spikes were either sorted offline by hand (Plexon Offline Sorter) or automatically using KiloSort51. Spike clusters found by KiloSort were manually curated (Phy Template-gui software; Kwik Team). No attempt was made to screen for any response property. Across all recorded neurons, the average minimum trial-count per condition was ~20 trials.
As is typical when recording simultaneously using multi-electrode and/or multi-contact arrays, we included both well-isolated single-units and ‘good’ multi-unit isolations. Good multi-unit isolations were defined as isolations with clear spike waveforms that could be individually detected (e.g., not simple threshold crossings) but where those waveforms likely came from more than one neuron and could not be consistently separated. We repeated – with identical results – key analyses using only those isolations judged to be true single units (Supplementary Fig. 3). This is expected given recent results52.
Units were excluded from all analyses if they exhibited either very low mean rates across all times, conditions, and trials (< 2 sp/s) or a low signal-to-noise ratio (< 2.5). The latter was calculated as the ratio of the unit’s dynamic range (range of the across-trial mean firing rate, calculated across all times and conditions) to the maximum standard error of the across-trial firing rate (maximum taken across all times and conditions). These thresholds were set prior to performing any analysis and excluded 11% and 13% of all recorded units for monkey B and monkey H, respectively.
In dedicated sessions, we recorded electromyogram (EMG) activity using intramuscular electrodes from the following muscles: trapezius, anterior, lateral, and posterior head of the deltoid, lateral head of the biceps, pectoralis, and brachialis. EMG signals were bandpass filtered (50–5kHz), digitized at 30 kHz, rectified, and smoothed with a Gaussian kernel with standard deviation 25 ms.
Data Pre-Processing
Photodetectors (Thorlabs) were used to synchronize commands from the behavioral control software with the 60 Hz refresh rate of the display, such that the timing of visual events was known with 1 ms accuracy. Hand position was sampled at 60 Hz. For analysis on a one millisecond timescale, values were interpolated and filtered. For analysis, movement onset and offset were estimated offline based on hand speed. Movement onset (for each reach) was defined as the time that hand speed first surpassed 5% of the peak speed for that reach. Similarly, movement end was defined as the time when hand speed first dropped below 5% of the peak reach speed.
In order to provide a clear view of preparatory activity during the instructed delay period, all analyses only included trials with instructed delays >500 ms. The spike data on each trial were aligned to both target onset and the onset of the first reach, concatenated, then smoothed with a 25 ms Gaussian kernel. Concatenation occurred 350 ms prior to the onset of the first reach (i.e., 550 ms after target onset). This procedure yielded, on each trial, a continuous (but noisy) estimate of firing rate as a function of time. Trial-averaging was used to obtain an accurate estimate of firing rates prior to further analysis. Trial-averaging requires a common time-base for all trials whose rates are averaged. We achieved this by adjusting the time-base of each trial. This was always done within a set of conditions that shared a temporal task structure (e.g., all compound reaches). Within such a set, timing was very similar but not identical. For example, the first-reach duration and the dwell-time varied slightly across trials. We scaled the time-base of each such that both the first-reach duration and the dwell-time matched the median values for that set of conditions. All variables of interest (firing rate, hand speed, EMG) were computed for each trial prior to alignment. Thus, alignment never alters the magnitude of these variables, it simply modifies slightly when they occur. Using an alternative alignment procedure that did not involve rescaling – concatenating data after aligning to target onset, first reach onset, and second reach onset – produced very similar results.
Identifying Preparatory and Execution Dimensions
As in previous work25,35 we employed two additional preprocessing steps prior to dimensionality reduction. First, we soft-normalized each neuron’s firing rate. The normalization factor was equal to that neuron’s firing rate range plus five spikes/s. This encouraged dimensionality reduction to capture the responses of all neurons, rather than just high firing-rate neurons. Second, within each set of conditions of the same duration (e.g., single reaches, compound reaches) we mean-centered the firing rate of each neuron, so that its average rate (across conditions) was zero at all times. This step ensures that dimensionality reduction focuses on dimensions where activity is selective across conditions. Dimensions capturing condition-invariant activity20,21 were identified separately (see below). We employed a recently developed dimensionality reduction approach22,25,34, which leverages the fact that motor cortex population activity occupies nearly orthogonal subspaces during preparation and execution34. Importantly, this remains true even for preparatory events that occur outside an instructed delay period22,25. Identifying those dimensions requires two sets of data: one where activity reflects only preparation and another where activity reflects only execution.
Preparation-only activity was obtained using task epochs where the hand was stationary but preparation was presumed to occur. Most basically this included a ‘delay-period’ epoch from 700 – 150 ms prior to the onset of single reaches. We similarly employed the delay-period epoch before compound reaches and delayed double-reaches. For the delayed double-reaches, we used trials with a 600 ms inter-reach pause (which was experienced by both monkeys). These same trials provided an additional ‘second-reach preparatory’ epoch: 300 ms – 150 ms prior to the onset of the second reach. We included this epoch because second reaches had trajectories that were different from first reaches (they moved from one peripheral target to the other, rather than from the center out) and we wished preparatory dimensions to capture preparation for both first and second reaches. To be conservative, our primary analysis did not use a second-reach epoch before compound reaches; one of the competing hypotheses predicted no preparatory activity at that time, and we wished to avoid any concern that our method might ‘build it in.’
Execution-only activity was obtained from a peri-reach epoch, −50 – 500 ms relative to reach onset. We used data only for reaches where it was unlikely that preparation overlapped execution. This included single reaches, both reaches for delayed double-reaches with a 600 ms pause (the longest pause we used), and the second reach of compound reaches. For all these reaches, any subsequent reach (either second reaches or the return to the center) is some distance in the future, such that any preparation for the next movement likely occurs after completion of the present reach.
Using activity from the above times, we constructed two matrices: P ∈ R N x Tprep which holds neural activity from preparatory epochs and E ∈ R N x Texec which holds neural activity from execution epochs. N is the number of recorded neurons, Tprep is the total number of times across all conditions and all preparatory epochs as defined above, and Texec is the total number of times across all conditions and all execution epochs as defined above. We sought a set of preparatory dimensions Wprep that maximally capture the variance in P, and an orthogonal set of dimensions Wexec that maximally capture the variance of E. To do so, we computed covariance matrices Cprep = cov(P) and Cexec=cov(E) and used numerical optimization to find:
where σprep(i) is the ith singular value of Cprep and σexec(i) is the ith singular value of Cexec. Tr(·) is the matrix trace operator. is the variance captured, across all preparatory epochs, by the preparatory dimensions. is the variance captured, across all execution epochs, by the execution dimensions. The optimization objective is normalized (by the singular values) to make it insensitive to differences in total preparatory versus execution variance. Using a dimensionality of 20, Wprep and Wexec captured 78% and 68% of the variance in all preparatory epochs for monkey B and monkey H, respectively and 68% and 70% of the variance in all execution epochs for monkey B and monkey H, respectively.
Some analyses, in particular those involving visualization, involved focusing on a subset of the dimensions within Wprep. To do so, we found Wprep_rotate, a set of dimensions spanning the same subspace but ordered so that the first dimension captures the most variance and so forth (as for PCA). To avoid this rotation being biased towards one type of reach, it was based on preparatory epoch activity from an equal number of times before first versus second reaches. This encouraged the first two dimensions to capture preparation-related activity before both first and second reaches (it did not ensure equal variance for both, but encouraged parity if indeed preparatory activity was of similar magnitude for both). To find Wprep_rotate, we employed a 200 ms window of activity before all six single reaches (starting 300 ms before reach onset) and a 200 ms window of activity before six delayed double-reaches (starting 300 ms before the onset of second reach) onto Wprep, yielding a matrix Q ∈ R 20 × 12T, where T was equal to 200. We performed PCA on Q, yielding a rotation matrix B ∈ R 20 × 20. Wprep_rotate was then Wprep B. All population analyses were performed by projecting population data onto Wprep_rotate. This rotation of the basis set was important when focusing on a subset of dimensions (one wishes to prioritize variance captured) but had no impact on analyses that employed all dimensions (e.g., Wprep and Wprep_rotate capture the same total variance).
Subspace Occupancy
We calculated occupancy as described in25,34. Computation of preparatory occupancy is described below. Execution occupancy was computed analogously. For a given time t and condition Φ, the projection of the population response onto the preparatory dimensions is: , where is a vector containing the response of each neuron for time t and condition ϕ. To measure subspace occupancy, we calculated:
Where varϕ indicates taking the variance across conditions and is the kth element of xprep.
Predicting Preparatory Activity from Early EMG
We employed a linear model:
Where P is a low-dimensional matrix of preparatory activity (P ∈ R C x Kprep, where C is the number of conditions and KPrep is the number of preparatory dimension) and Ereduced is a low-dimensional representation of muscle activity. Ereduced was found by using PCA to approximate a C x MT matrix of trial-averaged EMG (where M and T represent the number of muscles and number of time points, respectively) as the product of two matrices: a C x KEMG matrix of ‘scores’ (Ereduced) and a KEMG x MT matrix of principal components, where KEMG is the number of EMG dimensions. B was found via ridge regression and performance was assessed using generalization R2 (leave-one-out cross-validation). For each held-out condition, a single model was fit, using single, delayed-double, and compound reach conditions.
We chose KEMG, KPrep, and the tuning parameter for the regression (λ) by optimizing LOOCV performance on single and delayed-double reach conditions only. We then used these parameters to predict compound reach preparatory activity. For monkey B, KEMG = 3, KPrep = 9, and λ = 2, and for monkey H, KEMG = 5, KPrep = 9, and λ = 1.1.
Identifying Trigger Dimensions
We used dPCA53,54 to identify neural dimensions where activity varies primarily with time and not condition20. dPCA was applied to a matrix of firing rates, A ∈ R CT x N, where N is the number of neurons, C is the number of conditions, and T is the number of time-points per condition. The data in A was taken from a 300 ms window centered on reach onset. Data was included for all of the reaches from single-, compound-, and delayed double-reach-conditions – i.e., all reach directions and reach types. dPCA leverages labels assigned to each row of A that identify the condition and time. dPCA seeks a matrix WdPCA ∈ R N x k, where k is specified (we chose k to be 8), that produces a projection X = AWdPCA. Each column of WdPCA is a dimension and each column of X is thus a projection of the population response onto that dimension. Like PCA, dPCA optimizes dimensions to capture variance, such that . Unlike PCA, dPCA further optimizes WdPCA such that each column of X covaries strongly with only one label (i.e., time or condition). Our analysis of the condition-invariant signal employed those columns where activity varied primarily with time. We observed very similar results if compound reach conditions were omitted when finding WdPCA.
Training a Recurrent Neural Network to Generate Sequences of EMG
To determine whether a recurrent neural network (RNN) could readily use the independent strategy, we trained an RNN to reproduce the empirical patterns of muscle activity, largely following the procedure outlined in31. We used a network with dynamics:
where x is the network state for time t and condition c. The function f was a hyperbolic tangent linking each unit’s inputs to its firing rate, Ax captures the influence of network activity on itself via connection weights A, Bu represents the external inputs, brecurrent is a vector of offset biases, and the random vector w ∼ N(0,σwI ) adds a small amount of noise. We set σw to be 5×10⁻⁴. Network output was:
The parameters A, B, C, breadout, and breadout were optimized to minimize a loss function based on output error: the difference between y and a target, was based upon EMG recorded from six muscles during the six single-reach conditions. We created 36 idealized ‘conditions’ – each a two-reach combination – that the network had to perform. Each condition was generated by concatenating muscle activity from two reaches, separated by an interval where target output was 0. On each ‘trial’ the network performed one condition, with a random duration of that interval (0 – 600 ms). Thus, the model was asked to produce six-dimensional muscle activity for all 36 possible two-reach combinations, and to do so across a wide range of inter-reach pauses.
The loss function optimized during training was:
The first term is the error between the network output and the target. All other terms serve to regularize the network solution. The second and third terms penalize large recurrent and output weights, respectively. The fourth term penalizes large firing rates, and the final term discourages complex dynamics31:
This final term was not essential. Without it, networks still employed a similar solutions (i.e. placing preparatory, triggering, and execution activity in largely orthogonal sets of dimensions). However, as in31, regularization in general and the inclusion of RJ in particular encouraged network solutions that resembled those observed empirically. Regularization coefficients were chosen to be: λA = 10−7, λC = 10−7, λx = 10−8, and λJ = 5 × 10⁻⁵. The RNN was composed of 100 units, received 3 condition-specific inputs, and a single condition-independent ‘go cue’. In order to ensure that the network was truly producing an output in response to the go cue (and not implicitly time-locking to the start of simulation) we used a variable delay between condition-specific input onset and go cue onset; this delay varied randomly between 200 and 600 ms. The matrices A, B, and C were initialized as random orthonormal matrices, and the network was trained using TensorFlow’s Adam optimizer within a Jupyter Notebook.
We probed the function of trained networks using disruptive pulses delivered around the time of the go cue. Each pulse was delivered via the network inputs for 30 ms and was a scaled version of the input for one of the off-target reach directions. For example, if the network was originally instructed to generate a rightwards reach, the disruptive pulse was a scaled version of the input for one of the five other reach directions. The magnitude of each pulse was between 0.5 and 3 times that of the condition-specific input used to train the network. Each time-point in Fig.7f was probed 1000 times.
Statistics
No statistical methods were used to predetermine sample sizes, but our samples sizes are similar to those reported in previous publications22,25,35. Data collection and analysis were not performed blind to the conditions of the experiments.
We defined sequence selectivity in the traditional way: responses that were statistically different when a reach was part of a sequence versus performed alone. First reaches provided the most natural comparison, as they were physically similar when performed alone versus as part of a sequence. We thus asked whether activity before and during first reaches differed between the single-reach and compound-reach conditions. We computed the average firing rate on each trial during two epochs: the delay period and an ‘execution-epoch’ spanning the first reach. A Wilcox rank-sum test was used to ask whether, for each epoch, these differed for single versus compound reaches. For the execution epoch, we employed a second comparison that avoids the concern that differences might be missed when averaging across time-points. We compared, at each millisecond, firing-rates for single versus compound reaches, and took the average absolute difference. This was summed across conditions, yielding one comparison per neuron. We used a resampling test to determine if the summed difference was greater than expected given trial-to-trial variability. Resampling was performed by pooling all single and compound reach trials, and drawing two new ‘conditions’ (sampling with replacement). Differences were considered significant at the 0.001 level if the true difference was greater than 1000 resampled differences.
For analyses of occupancy, we employed a resampling procedure to estimate sampling error. We created 1000 surrogate neural populations by redrawing, with replacement, neurons from the original population. For each, we computed the preparatory dimensions and subspace occupancy, yielding a distribution of occupancies. That distribution was used to compute error bars and assess statistical significance. To determine whether preparatory subspace occupancy during the first compound reach was significantly higher than that during single reaches, we asked within a particular window (200 ms window ending with the onset of the second reach), how frequently (across surrogate populations) was preparatory occupancy higher for compound reaches than for single reaches. If compound reach occupancy was higher in 95% of comparisons, this would yield a p-value of 0.05.
Data availability
All relevant data are available from the authors upon reasonable request.
Code availability
The trained RNN used in Fig. 7,8 is available at gigantum.com/azimnik/rnn-sequence-model
Extended Data
Extended Data Fig. 1. Single and compound-reach conditions.
a, Reach paths for single reach conditions (same as in Fig. 1a) for Monkey B. Paths are averaged across all trials and sessions. b, Reach paths for all compound reach conditions performed by monkey B (a superset of those in Fig. 1a). Most first-target locations were used for only one compound reach condition, to maintain a reasonable trial-counts. This was necessary because monkey B performed delayed double-reach conditions using three instructed pauses, which added to the total number of conditions performed. For similar reasons, delayed double-reach conditions employed a subset of the two-target combinations (those in red and blue) that were employed during compound reaches. c, Same as a, but for monkey H. For monkey H, the bottom-right and top-right targets were shifted slightly to the right and left (respectively) compared to the locations used for monkey B. This shift was necessary to prevent the animal’s arm from blocking sight of the second target during certain conditions (the two monkeys were of different sizes and employed slightly different postures when reaching). d, Same as b, but for monkey H. Monkey H performed a greater number of compound reach conditions than monkey B.
Extended Data Fig. 2. Activity of neuron 066 (Monkey B) across all conditions.
a, Response during single-reach conditions, as in Fig. 3a, but for all single reaches. Circles indicate the time of target onset (t), reach onset (r), and reach end (e). b, Response during delayed double-reaches with a 600 ms instructed pause, as in Fig. 3b. c, Response during delayed double-reaches with a 300 ms instructed pause. d, Response during delayed double-reaches with a 100 ms instructed pause. e, Response during all compound reach conditions, as in Fig. 3c, but for all conditions.
Extended Data Fig. 3. Responses of four exemplar motor cortex units.
a, Response of neuron 322, recorded from Monkey H. Same as in Fig. 3d–f, but for all single reaches and all two-reach combinations. Circles indicate the time of target onset (t), reach onset (r), and reach end (e). b-d, Responses of three additional example units. As is typical, these units are active during both the delay and execution-epochs of single reaches. It is thus difficult to determine via inspection whether there is a second bout of preparation during compound reaches.
Extended Data Fig. 4. Time-course of activity in preparatory dimensions during all conditions, monkey B.
a, Projection of population activity, during single reaches, onto the first preparatory dimension. Data are from monkey B. Unlike in Fig. 3, data are shown for all conditions. Vertical scaling is arbitrary and conserved across panels. Circles indicate the time of target onset (t), reach onset (r), and reach end (e). b, The same projection for delayed double-reaches. c, The same projection for compound reaches. Note that monkey B performed four fewer 600 ms delay double-reach conditions than compound reach conditions. d, Preparatory subspace occupancy (for all 20 dimensions) during single-reach conditions. Shaded regions indicate the standard deviation of the sampling error (equivalent to the standard error of the mean) estimated by resampling individual units (n = 1000 resampled populations). Because occupancy is a measure of normalized firing rates, the units are arbitrary. e, Preparatory subspace occupancy during delayed double-reaches. f, Preparatory subspace occupancy during compound reaches. g, Same as f, but preparatory dimensions were found using an expanded range of times that included activity during the brief dwell-period between compound reaches. h-j, Same as a-c but for monkey H. Note that monkey H performed more two-reach conditions than monkey B. k-n, Same as d-g but for monkey H. Occupancy just prior to the second reach in compound reach conditions (f,m) was significantly greater than the occupancy during the same time period of single reaches for both monkeys (p < 0.001 for both monkeys via a bootstrap procedure; see Methods).
Extended Data Fig. 5. Defining the preparatory dimensions using all preparatory epochs.
Same analysis as in Fig. 4d,e,f,k,l,m, but identification of dimensions employed an epoch of dwell-period activity from compound reach conditions (activity within a 40 ms window beginning 140 ms before the onset of the second reach) in addition to the epochs contributed by single and delayed-double reaches. a, Occupancy (of 20 preparatory dimensions) during single reaches for monkey B. Circles indicate the time of target onset (t), reach onset (r), and reach end (e). Shaded regions indicate the standard deviation of the sampling error estimated by resampling individual units (n = 1000 resampled populations). b, Occupancy of the same preparatory dimensions during delayed double-reaches. c, Occupancy of the same preparatory dimensions during compound reaches. This panel plots the same data shown in Fig. 4g. d-f, Same as a-c, but for monkey H.
Extended Data Fig. 6. Patterns of execution-related activity.
Analysis is similar to that in Fig. 5, but was applied to activity during movement. a, Comparison between single and compound reaches. Each marker plots the activity (in 1 of 10 execution dimensions, at a single point in time) for a pair of conditions that share a first reach. Because execution activity (unlike preparatory activity) is strongly time-varying, we include activity from 4 time points (50 ms intervals, starting 25 ms before reach onset). Data are from monkey B. b, same but for monkey H.
Extended Data Fig. 7. The ability to predict preparatory activity from first-reach muscle activity does not differ for compound reaches, relative to single and delayed double-reaches.
The holistic hypothesis predicts that preparatory activity, during the instructed delay, should reflect the full compound reach. If so, it should not be readily predicted from the characteristics of the first reach alone. We thus asked whether the ability to predict preparatory activity from first-reach muscle activity was reduced for compound reaches. We used dimensionality reduction to summarize muscle activity via a small number of variables, and used these as regressors to predict the low-dimensional preparatory state (see Methods for full details). Prediction performance was quantified using cross-validation. a, Results for monkey B. Gray circles plot leave-one-out cross-validation performance for each individual condition. Red circles and error bars show the median and the median absolute deviation. Performance for compound reach conditions was not significantly lower than that for single and delayed-double reach conditions. Indeed it was slightly higher. Median R2 = 0.92 and 0.95 for single/delayed-double and compound reach conditions, respectively (p = 0.92, Mann-Whitney one-tailed test; n = 12 and 10). b, Same as a, but for monkey H. Performance for compound reach conditions was not significantly lower than that for single and delayed-double reach conditions. Median R2 = 0.97 and 0.95 for single/delayed-double and compound reach conditions, respectively (p = 0.07, Mann-Whitney one-tailed test; n = 22 and 16).
Extended Data Fig. 8. Individual-unit delay-period activity is similar before compound reaches and corresponding single reaches.
a, The trial-averaged firing rate of each unit, for each condition, was calculated during a 100 ms window, beginning 170 ms prior to reach onset. For each recorded unit, we then correlated the firing rates before compound reaches with those before corresponding single reaches. A unity correlation indicates that firing rates depended only on the identity of the first reach. A correlation less than unit could indicate either the influence of the second reach (as proposed by the holistic hypothesis) or the influence of measurement noise. The latter is relevant because many units had weak-to-modest ‘preparatory tuning’ (the range of firing rates across conditions), making strong correlations unlikely given measurement noise. We thus plotted the correlation versus the strength of preparatory tuning. Each light grey marker represents an individual unit. To improve visibility, marker size increases with tuning strength. Error bars represent the 95% confidence interval of the correlation for each unit, calculated by resampling individual trials with replacement (n=1000 resampled populations). The correlation between the delay-period activity of single and compound reaches increases sharply with tuning strength (red trace) and plateaued near unity, consistent with the independent hypothesis. Data were fit with a hyperbolic tangent with a single free parameter that determined the slope of the function. Data are for monkey B. b, Distribution of correlations for all individual units from monkey B (median ρ = 0.77). c, Same but for units with stronger preparatory tuning (top tertile; median ρ = 0.94). d-f, Same as a-c, but for monkey H. Median ρ was 0.74 and 0.90 for the two distributions.
Extended Data Fig. 9. Activity within condition-invariant dimensions during all conditions, monkey B.
Same as in Fig. 6a–c, but with the addition of data for delayed double-reaches with 300 and 100 ms pauses. The added analyses are in panels c and h (300 ms pause) and d and i (100 ms pause). The other panels are reproduced from Fig. 6. Traces are colored to highlight peri-reach activity. Circles indicate the time of target onset (t), reach onset (r), and reach end (e). The pattern displayed by the condition-invariant signal, during compound reaches (e and j) lay on a continuum with the pattern during delayed double-reaches (b-i).
Extended Data Fig. 10. Both PMd and M1 populations obey the predictions of the independent hypothesis.
a,b, Same analysis as Fig. 4d–f, performed for units recorded from rostral (a) and caudal (b) burr holes of monkey B (n = 138 and 89, respectively). Shaded regions indicate the standard deviation of the sampling error estimated by resampling individual units (n = 1000 resampled populations). Circles indicate the time of target onset (t), reach onset (r), and reach end (e). c,d, Same analysis as Fig. 5c (ρ = 0.97 and 0.89, respectively). e,f, Same analysis as Fig. 6a–c. A notable quantitative difference is that delay-period activity was stronger (relative to movement-epoch activity) for the rostral subpopulation. This indicates that the two subpopulations likely made differently sized contributions to the preparatory and execution-related dimensions in the original analysis of the full population. This was indeed the case. Preparatory weights for caudal units were modestly smaller (69% on average) than those of rostral units. Conversely, execution weights for the rostral units were modestly smaller (79%) than those of caudal units.
Supplementary Material
Acknowledgments
We thank Y. Pavlova for excellent animal care. This work was supported by the Grossman Center for the Statistics of Mind, the Simons Foundation (M.M.C.), the McKnight Foundation (M.M.C.), NIH Director’s New Innovator Award DP2 NS083037 (M.M.C.), NIH CRCNS R01NS100066 (M.M.C.), NIH 1U19NS104649 (M.M.C.), P30 EY019007 (M.M.C), the National Science Foundation (A.J.Z.), and the Kavli Foundation (M.M.C.).
Footnotes
Declaration of interests
The authors declare no competing interests.
References
- 1.Sakai K, Kitaguchi K & Hikosaka O Chunking during human visuomotor sequence learning. Exp Brain Res 152, 229–242, doi: 10.1007/s00221-003-1548-8 (2003). [DOI] [PubMed] [Google Scholar]
- 2.Rosenbaum DA, Kenny SB & Derr MA Hierarchical control of rapid movement sequences. Journal of experimental psychology. Human perception and performance 9, 86–102, doi: 10.1037//0096-1523.9.1.86 (1983). [DOI] [PubMed] [Google Scholar]
- 3.Abrahamse EL, Ruitenberg MF, de Kleine E & Verwey WB Control of automated behavior: insights from the discrete sequence production task. Front Hum Neurosci 7, 82, doi: 10.3389/fnhum.2013.00082 (2013). [DOI] [PMC free article] [PubMed] [Google Scholar]
- 4.Ramkumar P et al. Chunking as the result of an efficiency computation trade-off. Nat Commun 7, 12176, doi: 10.1038/ncomms12176 (2016). [DOI] [PMC free article] [PubMed] [Google Scholar]
- 5.Verwey WB Buffer loading and chunking in sequential keypressing. Journal of Experimental Psychology: Human Perception and Performance 22, 544 (1996). [Google Scholar]
- 6.Stadler MA Implicit serial learning: questions inspired by Hebb (1961). Memory & cognition 21, 819–827, doi: 10.3758/bf03202749 (1993). [DOI] [PubMed] [Google Scholar]
- 7.Krakauer JW, Hadjiosif AM, Xu J, Wong AL & Haith AM Motor Learning. Comprehensive Physiology 9, 613–663, doi: 10.1002/cphy.c170043 (2019). [DOI] [PubMed] [Google Scholar]
- 8.Wong AL, Lindquist MA, Haith AM & Krakauer JW Explicit knowledge enhances motor vigor and performance: motivation versus practice in sequence tasks. J Neurophysiol 114, 219–232, doi: 10.1152/jn.00218.2015 (2015). [DOI] [PMC free article] [PubMed] [Google Scholar]
- 9.Ben-Shaul Y et al. Neuronal activity in motor cortical areas reflects the sequential context of movement. J Neurophysiol 91, 1748–1762, doi: 10.1152/jn.00957.2003 (2004). [DOI] [PubMed] [Google Scholar]
- 10.Lu X & Ashe J Anticipatory activity in primary motor cortex codes memorized movement sequences. Neuron 45, 967–973, doi: 10.1016/j.neuron.2005.01.036 (2005). [DOI] [PubMed] [Google Scholar]
- 11.Hatsopoulos NG, Paninski L & Donoghue JP Sequential movement representations based on correlated neuronal activity. Exp Brain Res 149, 478–486, doi: 10.1007/s00221-003-1385-9 (2003). [DOI] [PubMed] [Google Scholar]
- 12.Yokoi A & Diedrichsen J Neural Organization of Hierarchical Motor Sequence Representations in the Human Neocortex. Neuron 103, 1178–1190.e1177, doi: 10.1016/j.neuron.2019.06.017 (2019). [DOI] [PubMed] [Google Scholar]
- 13.Weinrich M, Wise SP & Mauritz KH A neurophysiological study of the premotor cortex in the rhesus monkey. Brain 107 ( Pt 2), 385–414, doi: 10.1093/brain/107.2.385 (1984). [DOI] [PubMed] [Google Scholar]
- 14.Crammond DJ & Kalaska JF Prior information in motor and premotor cortex: activity during the delay period and effect on pre-movement activity. J Neurophysiol 84, 986–1005 (2000). [DOI] [PubMed] [Google Scholar]
- 15.Pastor-Bernier A, Tremblay E & Cisek P Dorsal premotor cortex is involved in switching motor plans. Frontiers in neuroengineering 5, 5, doi: 10.3389/fneng.2012.00005 (2012). [DOI] [PMC free article] [PubMed] [Google Scholar]
- 16.Churchland MM, Cunningham JP, Kaufman MT, Ryu SI & Shenoy KV Cortical preparatory activity: representation of movement or first cog in a dynamical machine? Neuron 68, 387–400, doi: 10.1016/j.neuron.2010.09.015 (2010). [DOI] [PMC free article] [PubMed] [Google Scholar]
- 17.Churchland MM, Yu BM, Ryu SI, Santhanam G & Shenoy KV Neural variability in premotor cortex provides a signature of motor preparation. J Neurosci 26, 3697–3712 (2006). [DOI] [PMC free article] [PubMed] [Google Scholar]
- 18.Vyas S, Golub MD, Sussillo D & Shenoy K Computation Through Neural Population Dynamics. Annu. Rev. Neurosci (2020). [DOI] [PMC free article] [PubMed] [Google Scholar]
- 19.Moran DW & Schwartz AB Motor cortical representation of speed and direction during reaching. J Neurophysiol 82, 2676–2692 (1999). [DOI] [PubMed] [Google Scholar]
- 20.Kaufman MT et al. The Largest Response Component in the Motor Cortex Reflects Movement Timing but Not Movement Type. eNeuro 3, doi: 10.1523/ENEURO.0085-16.2016 (2016). [DOI] [PMC free article] [PubMed] [Google Scholar]
- 21.Lara AH, Cunningham JP & Churchland MM Different population dynamics in the supplementary motor area and motor cortex during reaching. Nat Commun 9, 2754, doi: 10.1038/s41467-018-05146-z (2018). [DOI] [PMC free article] [PubMed] [Google Scholar]
- 22.Ames KC, Ryu SI & Shenoy KV Simultaneous motor preparation and execution in a last-moment reach correction task. Nat Commun 10, 2718, doi: 10.1038/s41467-019-10772-2 (2019). [DOI] [PMC free article] [PubMed] [Google Scholar]
- 23.Sergio LE, Hamel-Paquet C & Kalaska JF Motor cortex neural correlates of output kinematics and kinetics during isometric-force and arm-reaching tasks. J Neurophysiol 94, 2353–2378, doi: 10.1152/jn.00989.2004 (2005). [DOI] [PubMed] [Google Scholar]
- 24.Churchland MM & Shenoy KV Temporal complexity and heterogeneity of single-neuron activity in premotor and motor cortex. J Neurophysiol 97, 4235–4257 (2007). [DOI] [PubMed] [Google Scholar]
- 25.Lara AH, Elsayed GF, Zimnik AJ, Cunningham J & Churchland MM Conservation of preparatory neural events in monkey motor cortex regardless of how movement is initiated. Elife 7, doi: 10.7554/eLife.31826 (2018). [DOI] [PMC free article] [PubMed] [Google Scholar]
- 26.Matsuzaka Y, Picard N & Strick PL Skill representation in the primary motor cortex after long-term practice. J Neurophysiol 97, 1819–1832, doi: 10.1152/jn.00784.2006 (2007). [DOI] [PubMed] [Google Scholar]
- 27.Kettner RE, Marcario JK & Clark-Phelps MC Control of remembered reaching sequences in monkey. I. Activity during movement in motor and premotor cortex. Exp Brain Res 112, 335–346, doi: 10.1007/bf00227940 (1996). [DOI] [PubMed] [Google Scholar]
- 28.Kalaska JF, Scott SH, Cisek P & Sergio LE Cortical control of reaching movements. Curr Opin Neurobiol 7, 849–859, doi: 10.1016/s0959-4388(97)80146-8 (1997). [DOI] [PubMed] [Google Scholar]
- 29.Scott SH Inconvenient truths about neural processing in primary motor cortex. J Physiol 586, 1217–1224, doi: 10.1113/jphysiol.2007.146068 (2008). [DOI] [PMC free article] [PubMed] [Google Scholar]
- 30.Wise SP The primate premotor cortex: past, present, and preparatory. Annu Rev Neurosci 8, 1–19 (1985). [DOI] [PubMed] [Google Scholar]
- 31.Sussillo D, Churchland MM, Kaufman MT & Shenoy KV A neural network that finds a naturalistic solution for the production of muscle activity. Nat Neurosci 18, 1025–1033, doi: 10.1038/nn.4042 (2015). [DOI] [PMC free article] [PubMed] [Google Scholar]
- 32.Dacre J et al. Cerebellar-recipient motor thalamus drives behavioral context-specific movement initiation. bioRxiv, 802124, doi: 10.1101/802124 (2019). [DOI] [Google Scholar]
- 33.Sauerbrei BA et al. Cortical pattern generation during dexterous movement is input-driven. Nature 577, 386–391, doi: 10.1038/s41586-019-1869-9 (2020). [DOI] [PMC free article] [PubMed] [Google Scholar]
- 34.Elsayed GF, Lara AH, Kaufman MT, Churchland MM & Cunningham JP Reorganization between preparatory and movement population responses in motor cortex. Nat Commun 7, 13239, doi: 10.1038/ncomms13239 (2016). [DOI] [PMC free article] [PubMed] [Google Scholar]
- 35.Churchland MM et al. Neural population dynamics during reaching. Nature 487, 51–56, doi: 10.1038/nature11129 (2012). [DOI] [PMC free article] [PubMed] [Google Scholar]
- 36.Riehle A & Requin J The predictive value for performance speed of preparatory changes in neuronal activity of the monkey motor and premotor cortex. Behav Brain Res 53, 35–49, doi: 10.1016/s0166-4328(05)80264-5 (1993). [DOI] [PubMed] [Google Scholar]
- 37.Duncker L, O’Shea D, Goo EW, Shenoy K & Sahani EM T-29. Low-rank non-stationary population dynamics can account for robust-ness to optogenetic stimulation. (2017). [Google Scholar]
- 38.Book WF The psychology of skill: with special reference to its acquisition in typewriting. (University of Montana, 1908). [Google Scholar]
- 39.Ariani G & Diedrichsen J Sequence learning is driven by improvements in motor planning. J Neurophysiol 121, 2088–2100, doi: 10.1152/jn.00041.2019 (2019). [DOI] [PMC free article] [PubMed] [Google Scholar]
- 40.Rosenbaum DA Human movement initiation: specification of arm, direction, and extent. J Exp Psychol Gen 109, 444–474 (1980). [DOI] [PubMed] [Google Scholar]
- 41.Haith AM, Pakpoor J & Krakauer JW Independence of Movement Preparation and Movement Initiation. J Neurosci 36, 3007–3015, doi: 10.1523/JNEUROSCI.3245-15.2016 (2016). [DOI] [PMC free article] [PubMed] [Google Scholar]
- 42.Flash T & Henis E Arm trajectory modifications during reaching towards visual targets. J Cogn Neurosci 3, 220–230, doi: 10.1162/jocn.1991.3.3.220 (1991). [DOI] [PubMed] [Google Scholar]
- 43.Stavisky SD, Kao JC, Ryu SI & Shenoy KV Motor Cortical Visuomotor Feedback Activity Is Initially Isolated from Downstream Targets in Output-Null Neural State Space Dimensions. Neuron 95, 195–208 e199, doi: 10.1016/j.neuron.2017.05.023 (2017). [DOI] [PMC free article] [PubMed] [Google Scholar]
- 44.Kao T-C, Sadabadi MS & Hennequin G Optimal anticipatory control as a theory of motor preparation: a thalamo-cortical circuit model. bioRxiv, 2020.2002.2002.931246, doi: 10.1101/2020.02.02.931246 (2020). [DOI] [PMC free article] [PubMed] [Google Scholar]
- 45.Tanji J Sequential organization of multiple movements: involvement of cortical motor areas. Annu Rev Neurosci 24, 631–651, doi: 10.1146/annurev.neuro.24.1.631 (2001). [DOI] [PubMed] [Google Scholar]
- 46.Picard N & Strick PL Activation on the medial wall during remembered sequences of reaching movements in monkeys. J Neurophysiol 77, 2197–2201, doi: 10.1152/jn.1997.77.4.2197 (1997). [DOI] [PubMed] [Google Scholar]
- 47.Kornysheva K et al. Neural Competitive Queuing of Ordinal Structure Underlies Skilled Sequential Action. Neuron 101, 1166–1180.e1163, doi: 10.1016/j.neuron.2019.01.018 (2019). [DOI] [PMC free article] [PubMed] [Google Scholar]
- 48.Jin X, Tecuapetla F & Costa RM Basal ganglia subcircuits distinctively encode the parsing and concatenation of action sequences. Nat Neurosci 17, 423–430, doi: 10.1038/nn.3632 (2014). [DOI] [PMC free article] [PubMed] [Google Scholar]
- 49.Averbeck BB, Chafee MV, Crowe DA & Georgopoulos AP Parallel processing of serial movements in prefrontal cortex. Proc Natl Acad Sci U S A 99, 13172–13177, doi: 10.1073/pnas.162485599 (2002). [DOI] [PMC free article] [PubMed] [Google Scholar]
- 50.Botvinick M & Plaut DC Doing without schema hierarchies: a recurrent connectionist approach to normal and impaired routine sequential action. Psychol Rev 111, 395–429, doi: 10.1037/0033-295x.111.2.395 (2004). [DOI] [PubMed] [Google Scholar]
Methods references
- 51.Pachitariu M, Steinmetz NA, Kadir SN, Carandini M & Harris KD in Advances in neural information processing systems. 4448–4456. [Google Scholar]
- 52.Trautmann EM et al. Accurate Estimation of Neural Population Dynamics without Spike Sorting. Neuron 103, 292–308.e294, doi: 10.1016/j.neuron.2019.05.003 (2019). [DOI] [PMC free article] [PubMed] [Google Scholar]
- 53.Kobak D et al. Demixed principal component analysis of neural population data. Elife 5, doi: 10.7554/eLife.10989 (2016). [DOI] [PMC free article] [PubMed] [Google Scholar]
- 54.Brendel W, Romo R & C M in Adv Neural Info Process Syst Vol. 24:1–9 (2011) [Google Scholar]
Associated Data
This section collects any data citations, data availability statements, or supplementary materials included in this article.
Supplementary Materials
Data Availability Statement
All relevant data are available from the authors upon reasonable request.


