Summary
Citrate is most well-known as an intermediate in the TCA cycle of the cell. In addition to this essential role in energy metabolism, the tricarboxylate anion also acts as both a precursor and a regulator of fatty acid synthesis 1–3. Thus, the rate of fatty acid synthesis correlates directly with the cytosolic citrate concentration 4,5. Liver cells import citrate via the sodium-dependent citrate transporter NaCT (SLC13A5), and as a consequence this protein is a potential target for anti-obesity drugs. To understand the structural basis of its inhibition mechanism, we have determined cryo-electron microscopy structures of human NaCT in complex with citrate and with a small molecule inhibitor. These structures reveal how the inhibitor, bound at the same site as citrate, arrests the protein’s transport cycle. The NaCT-inhibitor structure also explains why the compound selectively inhibits NaCT over two homologous human dicarboxylate transporters, and suggests ways to further improve the affinity and selectivity. Finally, the NaCT structures provide a framework for understanding how various mutations abolish NaCT’s transport activity in the brain and thereby cause SLC13A5-Epilepsy in newborns 6–8.
Citrate is a major metabolite in the cell that plays multiple physiological roles. It is an intermediate of the namesake citric acid cycle and essential to oxidative phosphorylation in the mitochondria. In the cytosol, citrate indicates and regulates the energy status of the cell. Citrate not only acts as a precursor of de novo fatty acid synthesis, but also activates the first committed enzyme of this synthesis pathway, acetyl CoA carboxylase 1. Furthermore, citrate allosterically inhibits phosphofructokinase-1, the rate-limiting enzyme in glycolysis 2,3. Accordingly, the concentration of citrate in the cytosol directly modulates the rate of fatty acid synthesis in liver and adipose cells 4,5. In addition to this role in metabolism, citrate also functions as a precursor for acetyl-CoA synthesis needed for histone acetylation, regulating DNA transcription and replication 9.
Besides mitochondria, cytosolic citrate is imported from the blood across the plasma membrane by the Na+-dependent citrate transporter (NaCT, SLC13A5) 10–12. Knocking down NaCT expression significantly decreased the lipid content in a liver cell line 13. Clinically, elevated NaCT expression is observed in patients with obese, non-alcoholic fatty liver disease (NAFLD), whereas RNAi knock down of NaCT prevents diet-induced NAFLD in mice 14. Mutations of homologous genes in various species yield dramatic phenotypes that mimic calorie restriction. NaCT-knockout mice have increased hepatic mitochondrial biogenesis, higher lipid oxidation and energy expenditure, and reduced lipogenesis, which taken together protect the mice from obesity and insulin resistance 15. Furthermore, inactivation of the NaCT homologs INDY (I’m Not Dead Yet) and ceNAC-2 in flies and worms increased lifespan by 15 – 30% 16–18. Finally, citrate import is particularly important for nutrient uptake in human fetuses and newborns. Mutations in NaCT cause SLC13A5 Epilepsy — a type of early-onset epileptic encephalopathy due to decreased citrate uptake in the brain 6–8.
NaCT, along with the low- and high-affinity dicarboxylate transporters, NaDC1 and NaDC3, are members of the mammalian solute carrier family 13 (SLC13) 19,20. The three human proteins have amino acid identities between 45 – 55% and display distinct expression patterns, with NaCT being expressed only in the liver, brain and testis. While all three proteins catalyze sodium-driven carboxylate uptake, NaCT is the major transporter of citrate 11,21, for which the uptake can be enhanced by lithium (Extended Data Figs. 1a&b) 12.
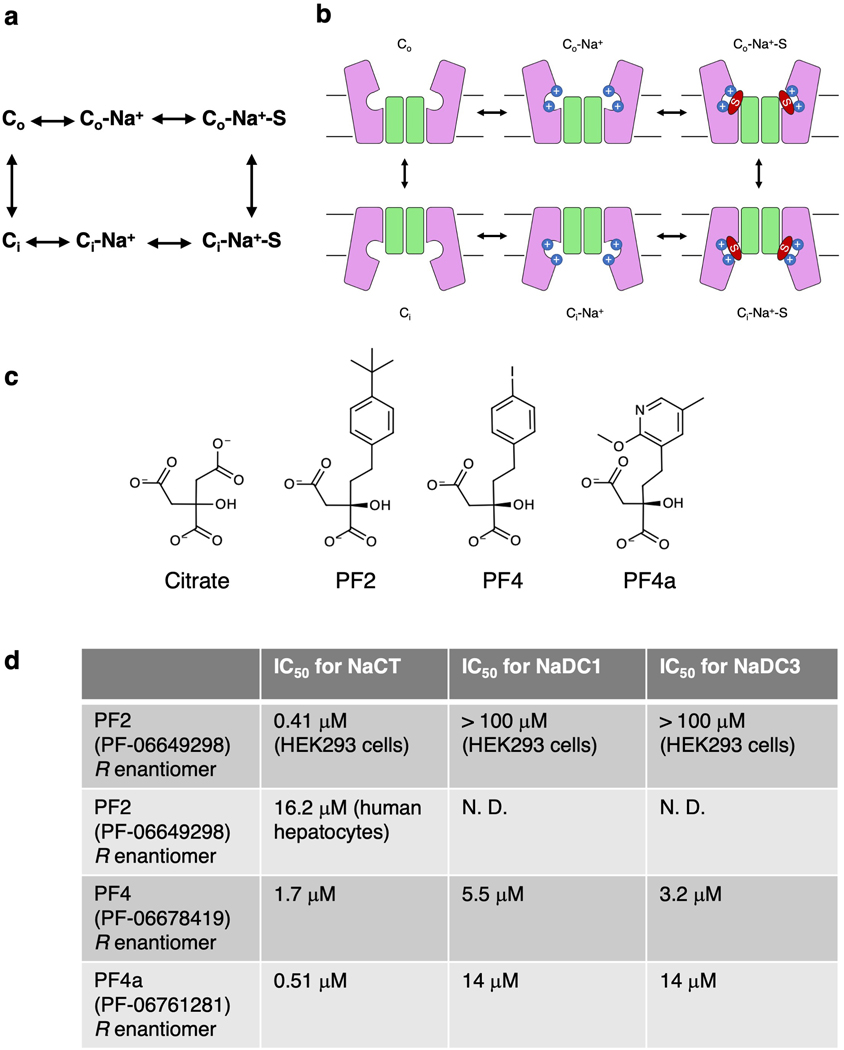
NaCT’s central role in fatty acid biosynthesis makes it a particularly attractive drug target for the treatment of obesity, diabetes and cardiovascular diseases through the reduction of fat storage 15,22. Several novel small molecules have been developed as NaCT inhibitors (Extended Data Figs. 1c&d) 23,24. In particular the compound PF-06649298 (PF2) exhibits high affinity and selectivity for NaCT, although its apparent IC50 varies with cell types 23,25. Treating mice with this compound reduced citrate uptake in the liver. The location of the PF2 binding site in NaCT and the nature of the inhibition mechanism, however, are both controversial. Transport activity and inhibition measurements show that PF2 — containing a dicarboxylate moiety — is both a substrate and an inhibitor, entering the cell and exerting inhibition at the substrate site from the cytosolic side 23–25, suggesting direct competition with substrate. On the other hand, electrophysiological evidence suggests that PF2 is a state-dependent, allosteric inhibitor 26. The structural basis of PF2’s selectivity remains similarly uncertain. In contrast to related compounds that inhibit all the three human di- and tricarboxylate transporters, PF2 is highly selective towards NaCT (Extended Data Figs. 1c&d) 23,24. To resolve this ambiguity in PF2 selectivity and inhibition mechanism requires high-resolution structural information on NaCT.
Currently, there is no structure available for any mammalian SLC13 protein. Information on the substrate and Na+ binding sites has been inferred from the structures of the bacterial SLC13 homolog from Vibrio cholerae, VcINDY 27–29. VcINDY is a dimeric protein where each protomer consists of a scaffold domain and a transport domain. The transport domain contains two conserved Ser-Asn-Thr (SNT) signature motifs, which both bind Na+ and form major parts of the substrate binding site. Whereas homology models of human SLC13 proteins based on the VcINDY structures have been used to guide mutagenesis experiments 25,26,30,31, the low sequence identity of 26 – 33% limits the accuracy of such models.
In order to understand the molecular mechanism of human NaCT, as well as PF2’s inhibition mechanism and selectivity, we have determined its structure in complexes with citrate and with PF2.
Structure determination of NaCT in complex with citrate
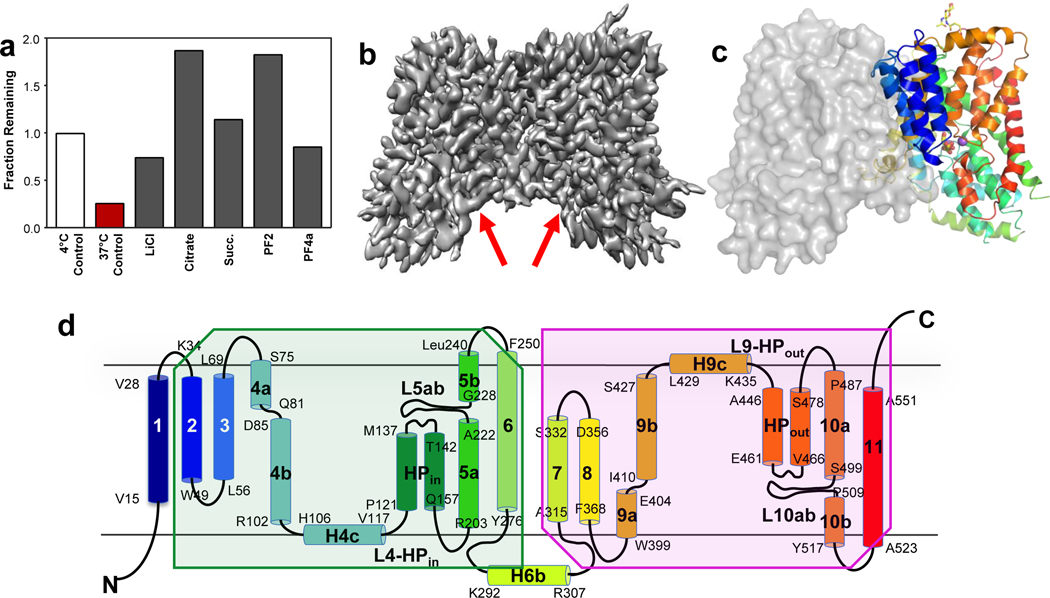
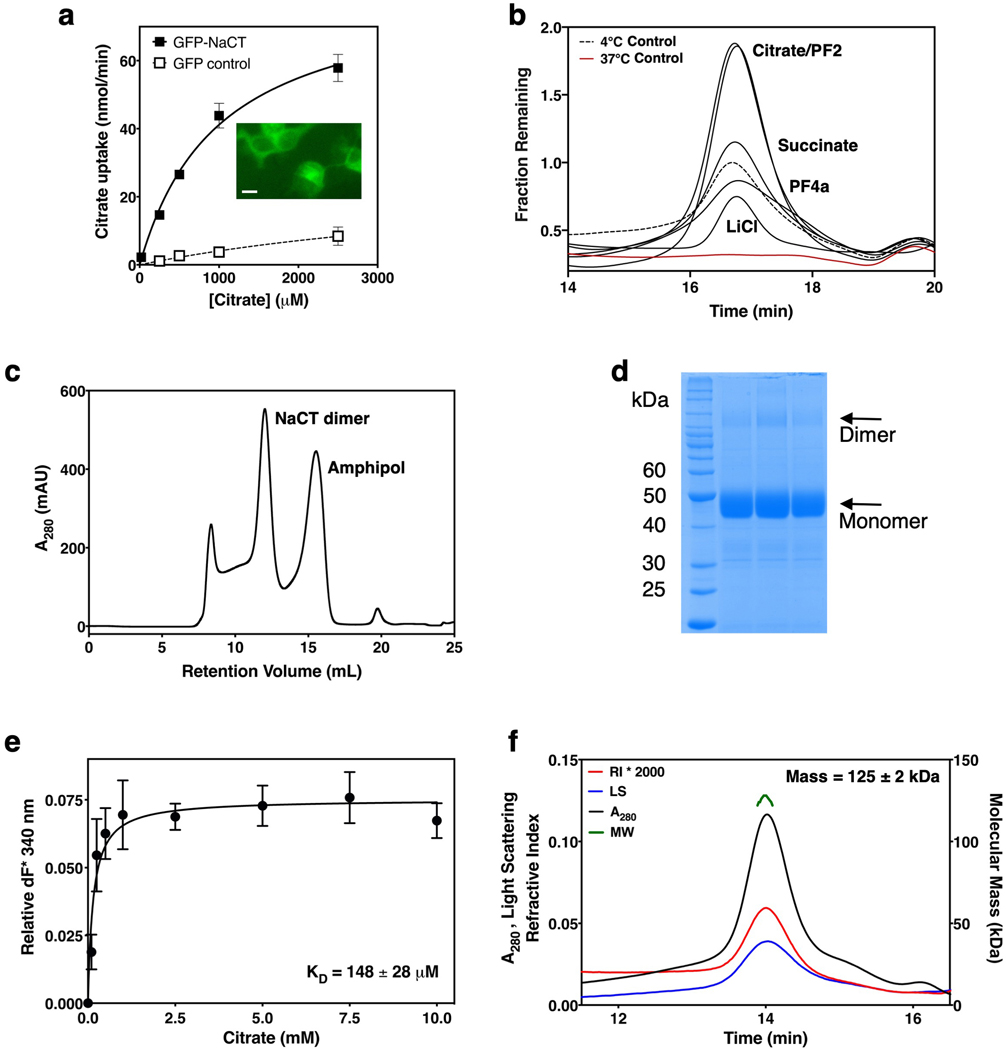
When overexpressed in HEK293 cells, NaCT was able to mediate Na+-driven citrate uptake (Extended Data Figs. 2a). We first determined its substrate binding affinity and oligomeric state in detergent solution. In agreement with their roles as substrates and co-substrates, citrate, succinate and lithium 32,33 all stabilized the solubilized protein in a thermostability screen 34,35 (Figs. 1a, Extended Data Fig. 2b). Purified NaCT bound citrate in detergent solution, with a KD of 148 ± 28 μM (Extended Data Figs. 2c–e). Finally, the purified protein ran as a single, sharp peak with a protein mass of 125 ± 2 kDa (Extended Data Fig. 2f), agreeing with the expected dimer mass of 126.124 kDa.
Fig. 1. Biochemical characterization and structure determination of human NaCT.
a, Thermostabilization of NaCT by various compounds. Residual fluorescence (fractional fluorescence that remains after 37°C thermal stress) of EGFP-NaCT after incubation with substrates and ligands. b, Cryo-EM map of NaCT-citrate at 3.04 Å resolution. Arrows indicate the Na+ and citrate binding sites. c, NaCT-citrate dimer structure viewed from within the membrane plane. The citrate is shown as sticks and the two Na+ ions are shown as purple balls. d, Transmembrane topology of NaCT. The beginning and end of each helix are numbered. Shaded regions indicate the inverted repeats of the protein.
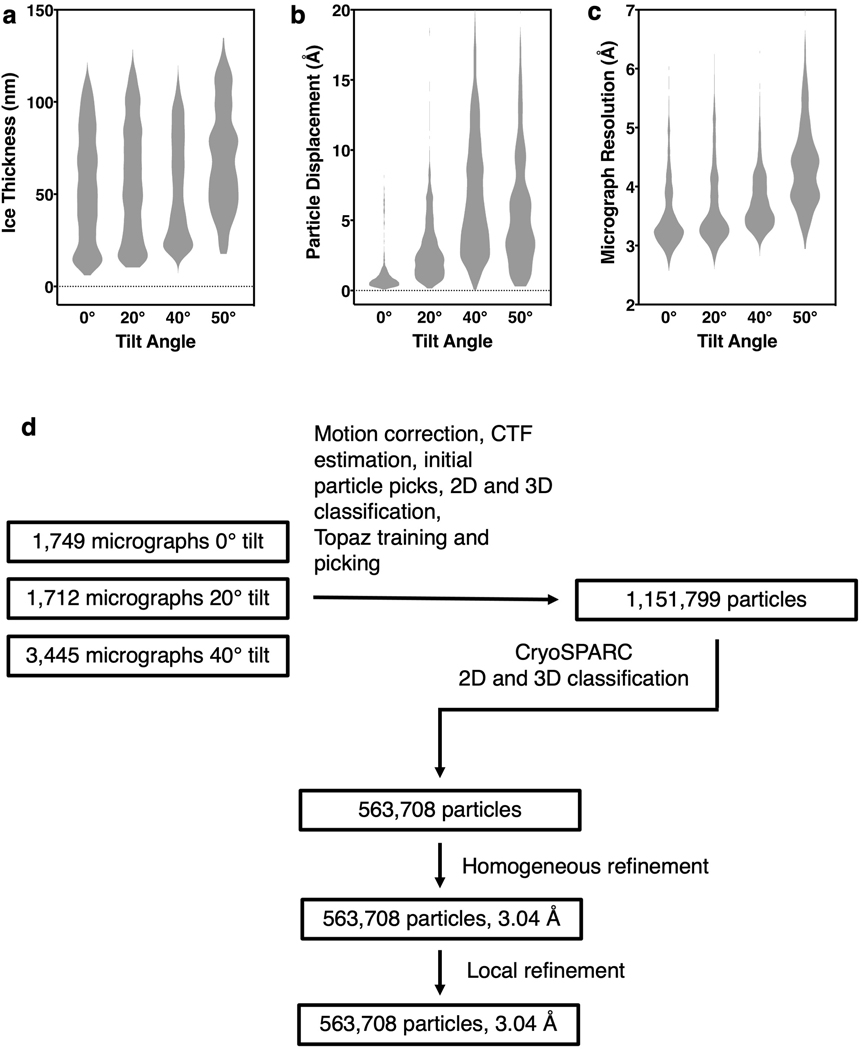
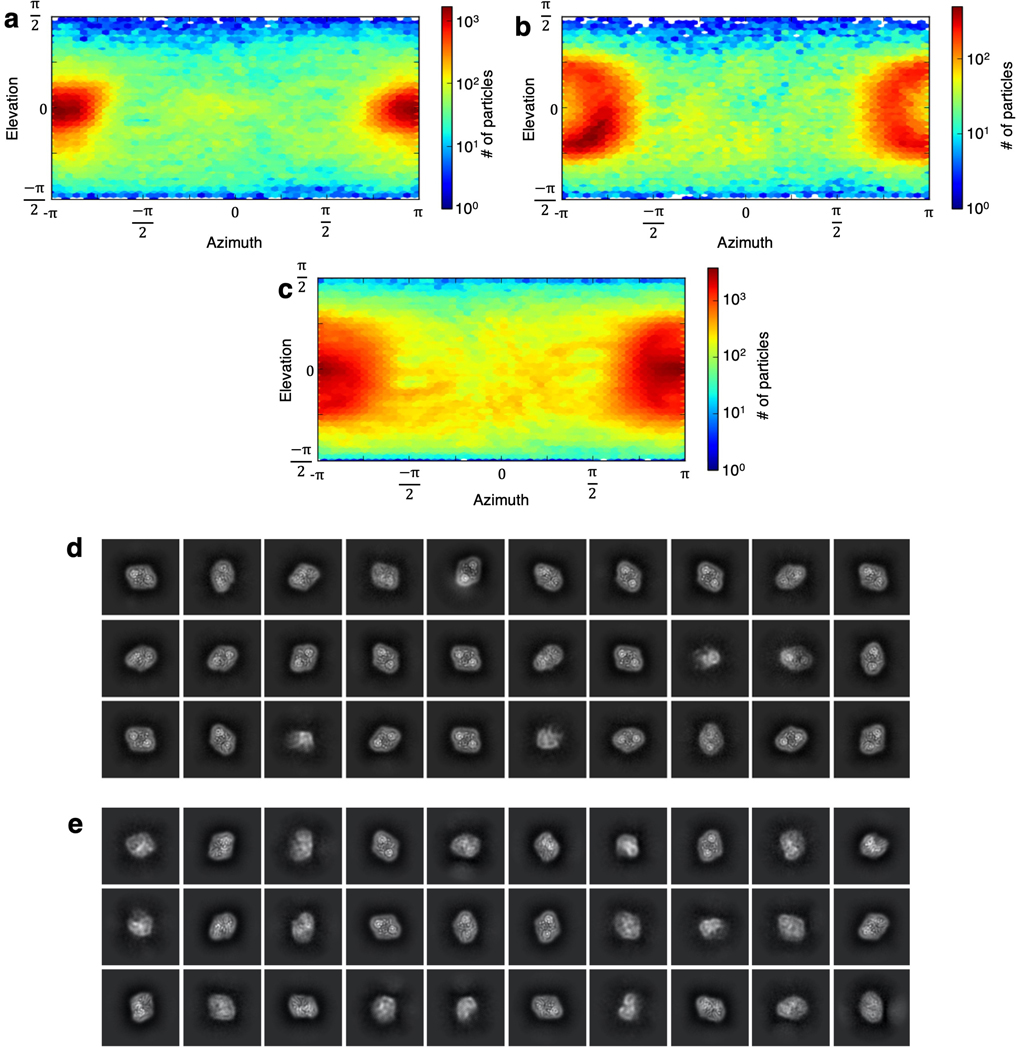
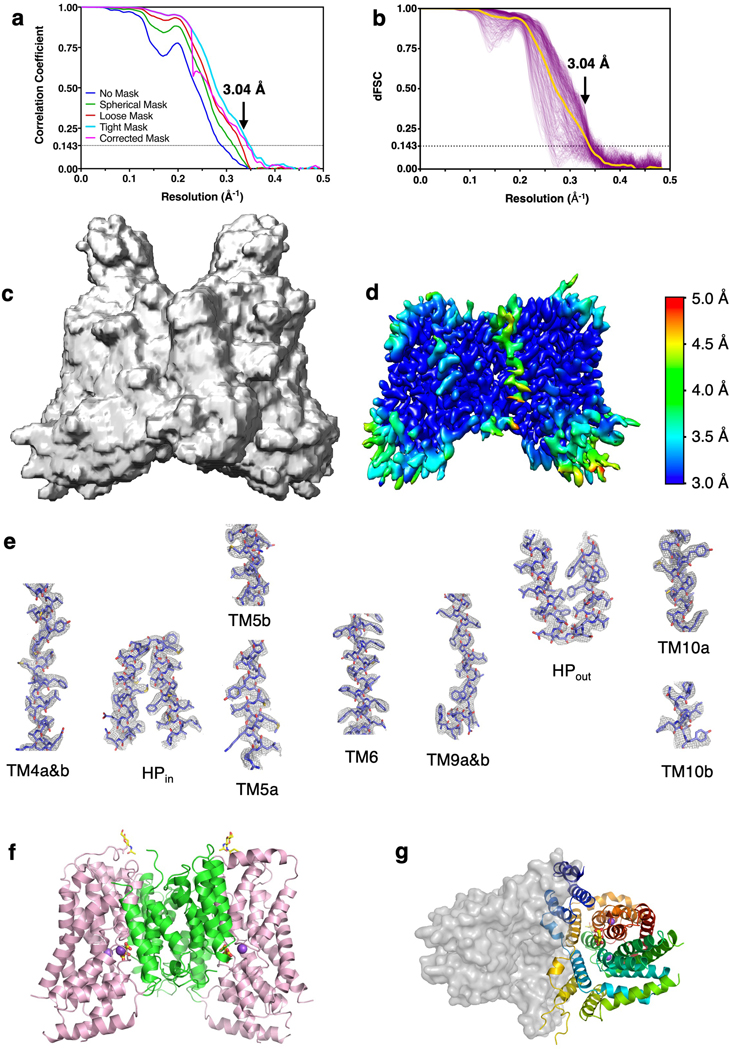
We set out to determine the structure of NaCT in complex with citrate and sodium using cryo-EM (Extended Data Fig. 3), with the addition of lithium to increase the protein’s stability. The NaCT-citrate particles in the ice showed a strong preferred orientation (Extended Data Figs. 4a&d), yielding a reconstruction from this anisotropic dataset with a sphericity of ~0.86 36. To overcome the preferred orientation problem, we collected images from specimens titled at 0°, 20 ° and 40° (Extended Data Figs. 3&4). This strategy allowed us to obtain a map of NaCT-citrate complex with a nominal resolution of 3.04 Å, enabling direct model building (Fig 1b, Extended Data Figs. 5a–e, Extended Data Table 1).
NaCT dimer structure
The NaCT-citrate structure represents the inward-facing, substrate- and Li+/Na+-bound (Ci-Na+-S) state (Extended Data Figs. 1a&b). NaCT forms a homodimer, and each protomer consists of a scaffold domain and a transport domain (Fig. 1c, Extended Data Fig. 5f&g), in agreement with an elevator mechanism proposed for NaCT homolog VcINDY 27,37. The scaffold domain is formed by transmembrane α-helices TMs 1 – 4 and 7 – 9, while the transport domains consists of TMs 5, 6, 10 and 11, as well as the helix hairpins HPin and HPout (Fig. 1d). Both TM5 and TM10 are broken in the middle of the membrane, with the halves of these helices connected by loops L5ab and L10ab, respectively. The N-terminal half of the protein, from TM2 to TM6, is related to the C-terminal half (TM6 to TM11) by an inverted repeat pseudo-symmetry (Fig. 1d) 37. Finally, density for one glycan unit is observed connected to Asn562, the only N-glycosylation site in the protein 11. While the overall fold of NaCT is similar to that of the VcINDY, with the two proteins having a backbone r.m.s.d. of 1.968 Å 27, the structural details are quite different (Extended Data Fig. 6c).
The scaffold domain is stabilized by a number of interactions which allow it to cradle the transport domain through the reaction cycle 29,38,39. These include the π – π interactions, hydrogen bonds and salt bridges (Arg102 – Asp398 and Lys107 – Glu305) (Extended Data Fig. 6f), in addition to numerous van der Waals interactions. Many of these interactions rigidify the two horizontal “arm” helixes, H4c and H9c, which connect the transport domain to the scaffold domain 29. Notably, Arg108 is central to the interaction of H4c, H6b and TM7 (Extended Data Fig. 6f) and, when it is mutated, NaCT’s transport activity is abolished 40. Between protomers, the interface of the two scaffold domains has an area of 2,291 Å2. Such a large interface area, along with the hydrogen bond at Arg76 – Asp85’ and π – π interaction between Trp408 and Trp408’ from the neighboring protomer, further stabilizes the two scaffold domains together into a rigid framework.
As with the scaffold domain, NaCT’s transport domain is stabilized by a number of internal hydrogen bonds and, particularly, π – π interactions. Presumably, this keeps the domain rigid and compact for rigid-body movement during substrate translocation. Additional rigidity comes from prolines in the sequences and, particularly, from interactions between aromatic side chains. Before a bend in TM6 at Pro259, three aromatic side chains, Phe258, Phe254 and Phe250 on one side of that helix pack against Trp330 and Phe331 of the scaffold domain (Extended Data Fig. 6g). On the back side of TM6, Phe256 interact with Trp547 from TM11. Similarly, Phe500 and Phe502 from L10ab pack against TM5a. These clusters of aromatics stabilize the protein 41 and help to keep hairpins HPin and HPout and intra-membrane loops L5ab and L10ab fixed within the transport domain.
In contrast to the extensive networks of interactions within the scaffold and transport domains, the interface between domains is dominated by small, hydrophobic residues, with only two apparent hydrogen bonds (Asn249 – Asp334 and Asn249 – Arg333). This results in a relative smooth interface, and presumably a low energetic barrier to transport domain movement during substrate translocation.
Substrate-binding sites
In our NaCT-citrate map, at equivalent positions of the two Na+ ions in VcINDY 27,28, weak densities for Na+ ions are seen (Fig. 2). The presence of cations at these positions agrees with NaCT’s sodium dependent binding of citrate 42. The relatively weak density at each site is likely due to their partial occupancy by weakly scattering Li+, which has higher affinity for the Na+ sites 12. Na1 is coordinated by the backbone oxygens of Ser136, Trp138, and Gly226, and the side chain of Asn141, within the clamshell-like structure formed by L5ab and the tip of HPin (Fig. 2a). Located at the symmetry-related clamshell on the C-terminal side of the transport domain, Na2 is similarly surrounded by the carbonyls Thr460, Thr463, and Ala507, and the side chains of Thr460 and Asn465 (Fig. 2b). In agreement with the assignment of these Na+ sites, NaDC3’s affinity for Na+ was reduced when residues in the equivalent region were mutated 30, supporting the role of the second SNT motif in Na+ coordination. Compared with VcINDY 27,28, the Na+ coordination in NaCT is different due to both variations in amino acid sequence and movement of the polypeptide backbone (Extended Data Fig. 6c&e). While NaCT cotransports one substrate with four Na+ ions 11, locations for the remaining two sodium binding sites are not apparent in the map.
Fig. 2. Na+ and substrate binding sites in human NaCT and mapping of mutations that cause SLC13A5-Epilepsy.
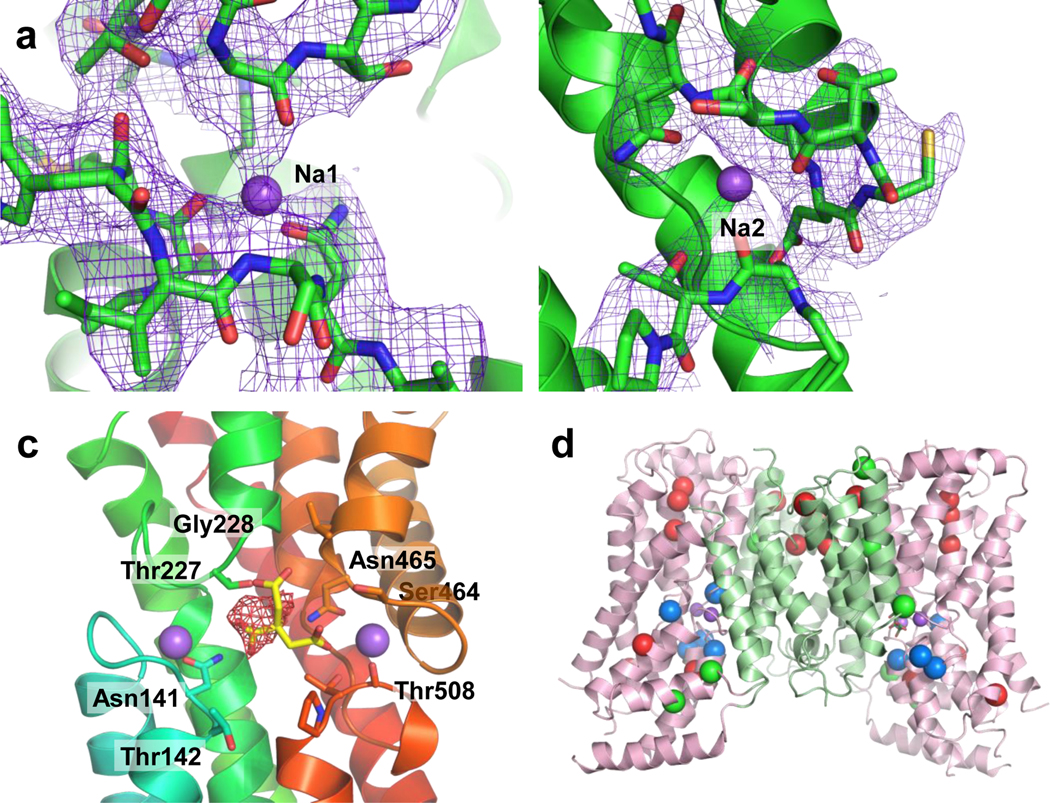
The, a, Na1, b, Na2, c, and citrate binding sites. Columbic potential maps are shown in mesh. The calculated valence 42 of Na1 and Na2 is 2.3 and 0.6 respectively in the NaCT-citrate complex, and 0.5 and 0.8 in the NaCT-PF2 complex, indicating reasonable coordination for sodium ions. d, Locations of the SLC13A5-Epilepsy missense mutations within the NaCT structure as viewed from the membrane plane. We hypothesize that Type Ib mutations (red) affect NaCT protein stability or folding, Type IIa mutations (blue) hinder substrate or Na+ binding, and Type IIb mutations (green) block conformational changes of the transport domain needed for substrate transport.
In a basic pocket between the Na1 and Na2 clamshells in the NaCT-citrate map, a density which appears to be citrate is found (Fig. 2c, Extended Data Fig. 6a–c). We propose that the two SNT motifs in SLC13 family (Ser140-Asn141-Thr142 and Ser464-Asn465-Val466 in NaCT) and their neighboring residues are chiefly responsible for interacting with two carboxylate moieties. Indeed, mutations of the equivalent residues of the two SNT signatures in both the human NaDC3 and rabbit NaDC1 proteins led to dramatically reduced transport activities 30,43. Furthermore, we hypothesize that L5ab plays a major role in distinguishing various tri- and di-carboxylates (Extended Data Figs. 6c&e). Mutating the equivalents of Thr227, Gly228 and Pro229 of this loop in human NaDC3 reduced the affinities to dicarboxylates but not of citrate 30. In contrast, the G228A mutant in NaCT displayed less than 10% of wild-type citrate transport activity 25. A mutation at the equivalent position in NaDC3, A254D, causes leukoencephalopathy with dramatically reduced α-KG uptake 44. Furthermore, a number of SLC13A5-Epilepsy missense mutations 6–8 are near the citrate binding site in NaCT, suggesting that these might interfere with substrate binding (Figs. 2d, Extended Data Fig. 6d).
PF2 binding Site
To understand the NaCT inhibitors’ mechanism and selectivity, we validated the interaction of PF2 and PF4a with NaCT. Notably, while the protein was thermostabilized by both inhibitors, the effect of the highly-selective PF2 was much stronger than the less selective and lower affinity PF4a (Fig. 1a). We subsequently determined a cryo-EM structure of the NaCT in complex with PF2 (Extended Data Fig. 7, Extended Data Table 1). As with the NaCT-citrate specimen, the PF2 complex in ice suffered from severe preferred orientation problems. We therefore employed the same tilting data-collection strategy, determining a NaCT-PF2 map with a resolution of 3.12 Å. The protein structure of the NaCT-PF2 complex is essentially identical to that of the NaCT-citrate complex, with an r.m.s.d for all non-hydrogen protein atoms of 0.624 Å.
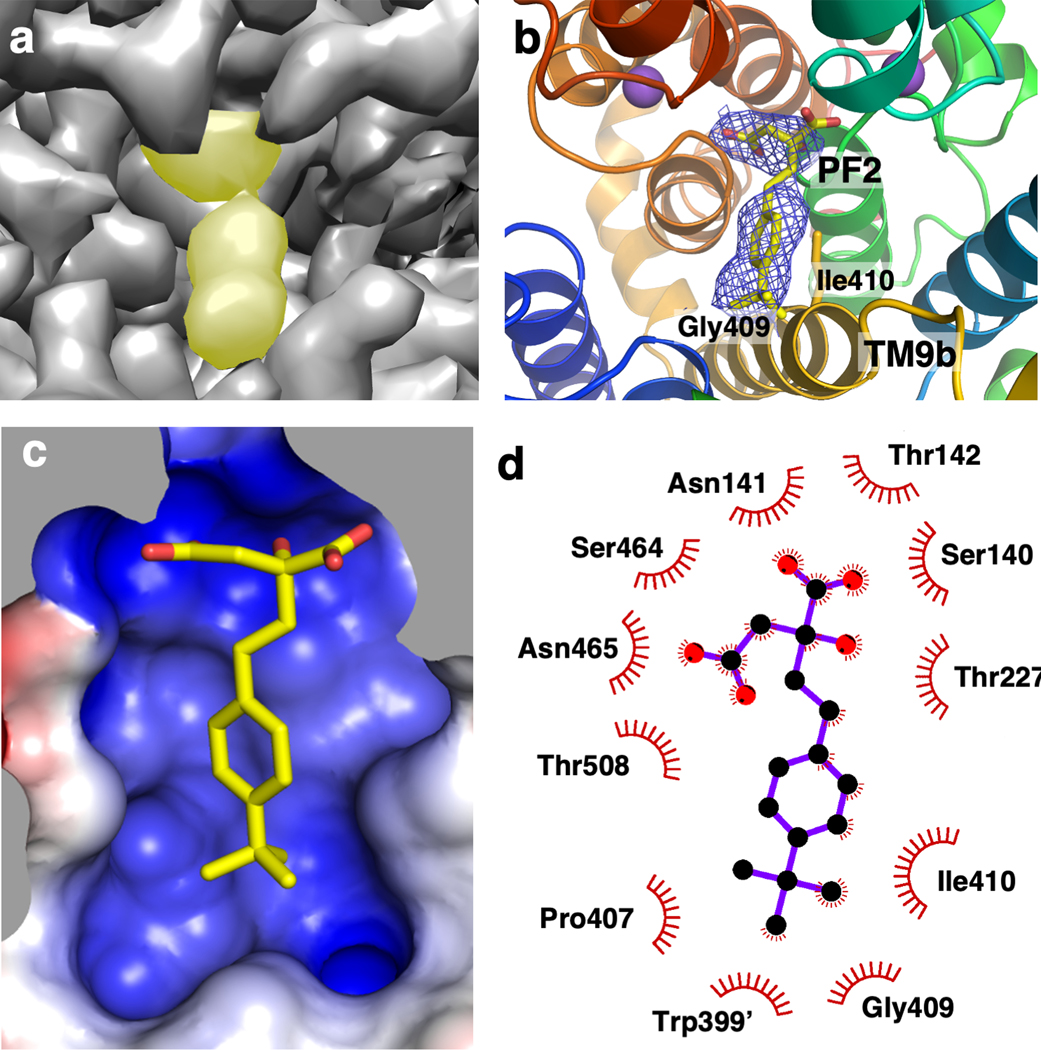
In the NaCT-PF2 map, a PF2 molecule occupies the substrate-binding site of each transporter protomer, with its carboxylate moieties located at the citrate site (Figs. 3a&b, Extended Data Fig. 8c–f). Similar structures of NaCT’s Na1 and Na2 sites in both PF2 and citrate structures are observed (Extended Data Fig. 8g), indicating that sodium is required for PF2 binding. The carboxylate binding residues generally overlap with the binding site of citrate, coordinate by the side chains of Ser140, Asn141, Thr142, Ser464, Asn465, and Thr508 (Fig. 3d). The middle hydroxyl group interacts with Thr227 and the backbone nitrogen of Gly228 (Extended Data Fig. 8e). At the other end of PF2, the isobutyl group interacts with a cavity on the cytosolic surface of the scaffold domain, lined by Leu56 from TM3, and Pro407, Gly409, and Ile410 from TM9b (Figs. 3b&d, 4a, Extended Fig. 8f). The benzene ring of PF2 interacts with Ile410 and mutating that residue to valine shifts the IC50 to ~20 μM (Fig. 4b, Extended Data Fig. 8h).
Fig. 3. PF2 binding site in human NaCT.
a, Cryo-EM map in surface representation of the PF2 binding site at 3.12 Å resolution. The density for the PF2 molecule is indicated in yellow. b, The PF2 binding site structure. Columbic potential map is shown in mesh. The isobutyl group of PF2 interacts with Gly409 and Ile410 from the N-terminus of TM9b of the scaffold domain. c, PF2 binding site shown as electrostatic surface, colored by electrostatic potential of the protein atomic model. d, Contact map for PF2’s interactions with residues of NaCT within 4.2 Å.
Fig. 4. Inhibition mechanism of PF2.
a, PF2 binding site viewed from within the membrane. The dicarboxylate moiety of PF2 binds at the citrate site in the transport domain (pink), whereas PF2’s benzene ring and isobutyl group interact with the scaffold domain (green) of NaCT. b, Transport activity and PF2 inhibition measurements of NaCT and mutants in HEK293 cells. The IC50 of PF2 to the wildtype protein is 5 μM, while for the G409Q and I410V mutants, the IC50 has increased to 300 μM and 20 μM, respectively (N = 6, error bars as SEM). c, Sequence alignment of the human SLC13 transporters. Positions of the two residues in NaCT that interact with the isobutyl group of PF2 are indicated. The equivalent of NaCT’s Gly409 is asparagine in both NaDC3 and NaDC1. d, Schematic drawing showing the proposed inhibition mechanism of PF2. The dicarboxylate moiety of PF2 (circle) binds to the citrate site of NaCT in its inward-facing, Ci-Na+-S state, and blocks sodium release from the Na1 and Na2 sites. At the same time, the modified benzene ring of PF2 (triangle) interacts with the scaffold domain, preventing the transition of the transport domain to an outward-facing conformation. Together, the two types of interactions arrest the transporter in its Ci-Na+-S state and inhibit transport.
Mechanism of PF2 inhibition and its selectivity
Our observation of overlapping binding sites for PF2 and citrate is consistent with the competitive inhibition mechanism previously proposed 23–25. While Trp399’ caps the PF2 binding cavity and restricts any movement of the molecule along its long axis (Figs. 3c&d), the arc formed by Leu56, Ala57, Pro407, Gly409 and Ile410 from the scaffold domain limits the transport domain’s movement towards the extracellular space (Fig. 4a, Extended Data Fig. 8f). We propose these interactions of PF2 with the scaffold domain block the sliding movement of the transport domain necessary to return the transporter to the outward-facing conformation. Simultaneously, PF2 binding prevents sodium release and stops the Ci-Na+-S to Ci-Na+ state transition (Extended Data Figs. 1a&b). Thus, the transporter’s reaction cycle is arrested by PF2 in the Ci-Na+-S state (Fig. 4d), resulting in inhibition.
The NaCT-PF2 structure also explains the selectivity of PF2 for NaCT over the two human dicarboxylate transporters, NaDC1 and NaDC3 23–25. The PF2-interacting residue Gly409 in NaCT is an asparagine at the equivalent position in both NaDC3 and NaDC1 (Fig. 4c). Similarly, the Ala57 of NaCT is replaced by Ser60 in NaDC3. At both positions, these larger side chains in NaDC3 and NaDC1 would sterically clash with the isobutyl group of PF2, thereby reducing PF2 binding and inhibition. In agreement with this model, neither PF4 nor PF4a — with either a smaller or no moiety at the isobutyl position — show a strong preference for any of the three SLC13 transporters (Extended Data Figs. 1c&d). Our model predicts that mutating Gly409 in NaCT to a asparagine, as found in NaDC1 and NaDC3, should significantly reduce its inhibition by PF2. However, as the G409N mutant of NaCT retained less than 10% of the wildtype transport activity 25, we tested this hypothesis with the glycine to glutamine mutant instead. In G409Q transfected HEK293 cells, the IC50 of PF2 was found to increase by 60-fold, from 5 μM to 300 μM (Fig. 4b), without compromising transport activity (Extended Data Figure 8h). This observation supports the notion that the interaction of the isobutyl group of PF2 with this pocket make the molecule selective towards NaCT.
Discussions
The NaCT-PF2 complex structure explains the varying selectivity of the inhibitors for NaCT versus NaDC1/NaDC3. The difference in selectivity of PF2 and PF4a must arise from their modified ring structures, as their citrate mimicking moieties are the same (Extended Data Fig. 1c). The isobutyl group of PF2 sterically prevents it from binding NaDC1 or NaDC3, explaining the 200-fold difference in IC50. Furthermore, the rugged PF2 binding pocket suggests that further modifications on the PF2 structural scaffold may improve inhibitor affinity and selectivity (Fig. 3c). In particular, the inhibitor molecule can be modified at the isobutyl position to improve both van der Waals and hydrophilic interactions.
Finally, these structures allow us to understand how SLC13A5-Epilepsy mutations hinder NaCT’s activity 6–8. For the over 40 mutations identified, their cellular localization and biochemical analysis has suggested two pathogenesis types 8: Type I mutations affect the localization and proteolytic susceptibility of the protein, while Type II directly abolishes transport activity. Now we can further subdivide each type based on their location and apparent biophysical mechanisms (Fig. 2d, Extended Data Fig. 6d). Within the Type I mutations, Type Ia are nonsense or frame shift mutations which result in incomplete protein molecules (Extended Data Table 2). Type Ib mutations, although producing full length proteins. are hypothesized to destabilize the transporter. For example, the Y82C mutation’s change in side chain volume may prevent dimer formation and therefore hinder transport. Of the Type II mutations, those close to the citrate and Na+ binding sites (IIa) are expected to alter substrate or cation affinity. Finally, Type IIb mutations are located at the interface between the scaffold and transport domains and likely obstructs the conformational changes necessary for substrate translocation. Whereas these mutations all abolish citrate uptake, causing SLC13A5-Epilepsy by reducing cellular energy supply and altering neurotransmitter synthesis, their pathogenic mechanisms are distinct and therefore each type will require a unique therapeutic strategy.
Methods
Overexpression
Baculovirus bearing the wildtype NaCT gene with an N-terminal decahistidine-TEV tag were prepared using the Bac-to-Bac system and amplified in the S. frugiperda Sf9 cell line. Protein was expressed by infection of T. ni BTI-Tn-5B1-4 cell line at 27 ºC for 72 hrs. In parallel, the overexpression of the NaCT gene with an N-terminal EGFP tag in HEK293 cells was monitored using confocal microscopy.
Whole cell transport assay
HEK-293 cells (ATCC CRL-1573) were seeded in 24-well plates (PerkinElmer #1450), with ~120,000 cells per well. The following day, the cells were transfected with NaCT in a pNGFP vector, containing a N-terminal GFP tag. Transfection was accomplished using Lipofectamine LTX reagent (Invitrogen) according to manufacturer protocol, with 300 ng DNA and 0.66 μL Lipofectamine per well.
Approximately 48 hours after transfection, [14C]-citrate uptake experiments were carried out based on previously published studies 23,25. Cells were washed with a buffer containing 140 mM NaCl, 2 mM KCl, 1 mM MgCl2, 1 mM CaCl2 and 10 mM HEPES, with pH adjusted to 7.4 using 1 M Tris solution. The wash buffer was removed and replaced with the same buffer containing PF2 at the indicated concentration for 15 min. This buffer was then removed and replaced with buffer containing the same concentration of PF2 and 500 μM total citrate, including 20 μM [14C]-citrate (PerkinElmer #NEC160) for 30 min. For transport kinetics assay, cells were washed with citrate-free buffer as above, then incubated in buffer containing the indicated total citrate concentration including 3% [14C]-citrate for 15 min. Following incubation, the [14C]-citrate buffer was removed and cells were washed 3 times with 0.6mL ice-cold buffer containing 140 mM choline chloride, 2 mM KCl, 1 mM MgCl2, 1 mM CaCl2 and 10 mM HEPES, with pH adjusted to 7.4 using 1 M Tris solution. After 3 washes the buffer was completely removed, and 0.5 mL of Ultima Gold XR scintillation cocktail (PerkinElmer #6013111) was added and mixed on a shaker for 5 min. Counts were measured using a Wallac 1450 MicroBeta liquid scintillation counter. All steps were carried out at room temperature.
Thermostabilization assay
A thermostability assay was used to search for compounds that stabilized wildtype NaCT 34,35. BTI-Tn-5B1-4 cells were infected with a baculovirus containing the NaCT gene with an N-terminal EGFP tag. Cells were harvested as previously and solubilized in a buffer of 50 mM Tris pH 8.0, 200 mM NaCl, 10% glycerol and 1.3% DDM. Solubilized lysates were incubated with 100 μM of various compounds at 37 ºC for 20 minutes, and subsequently injected onto a Shodex KW804 analytical SEC column (Thomson, Clear Brook, VA) on HPLC (Shimadzu, Columbia, MA) in a buffer containing 200 mM Na2SO4, 50 mM Tris 7.5, 3 mM NaN3 and 0.05% DDM. The height of the SEC peaks for the 4 ºC and 37 ºC controls were used as references for normalization. The PF2 and PF4a compounds were gifts from Pfizer Inc.
Protein purification
T. ni BTI-Tn-5B1-4 cells expressing wildtype NaCT without a GPF tag were harvested and lysed in a buffer of 50 mM Tris pH 8.0, 400 mM NaCl, 10 mM LiCitrate and 10% Glycerol. Membranes were harvested by ultracentrifugation and solubilized in a buffer of 50 mM Tris pH 8.0, 200 mM NaCl, 10 mM LiCitrate, 10% glycerol and 1.3% dodecyl-maltoside (DDM). NaCT was subsequently purified on a Ni2+-NTA affinity column. Source data are provided as a Source Data file.
Fluorescence quenching assay
Tryptophan fluorescence quenching was used to measure affinity of the citrate to purified NaCT in detergent 45,46. NaCT was purified by size exclusion chromatography (SEC) in a buffer of 20 mM Tris pH 7.5, 100 mM NaCl, 5% glycerol, 10 mM LiCitrate and 0.05% DDM. Protein was then diluted 10-fold with a buffer of 50 mM Tris, pH 8.0, 200 mM NaCl and 0.02% DDM, and subsequently concentrated 10-fold in a 100 kD filter. This process was repeated 3 times to reach a final citrate concentration of 10 μM and a protein concentration of 5 μM. Using a Horiba FluoroMax-4 fluorometer (Kyoto, Japan) at room temperature and a 280 nm excitation wavelength, the emission maximum was determined to be 344 nm. Subsequently, the change in fluorescent emission at 344 nm was monitored with increasing concentrations of sodium citrate.
Multi-angle dynamic light scattering
The molecular mass of SEC-purified NaCT was measured using multi-angle light scattering 47,48. DDM-purified NaCT sample (50 μL) was injected onto a Shodex KW803 analytical SEC column on a Waters HPLC (Milford, MA) and eluted with the buffer containing 0.05% DDM at a rate of 0.5 mL/min. The mass of the NaCT protein was determined using a Wyatt miniDAWN TREOS 3 angle-static light scattering detector (Santa Barbara, CA), a Wyatt Optilab rEX refractive index detector and a Waters 2489 UV absorbance detector. The differential refractive index (dn/dc) for DDM, 0.128 mL/g, was calculated using the refractive index detector. The size of the protein–detergent conjugate was deconvoluted following the published method 49, in which contributions from co-purifying lipids were not distinguished from those of the detergent.
Amphipol exchange
After Ni2+-NTA column purification PMAL-C8 (Anatrace, Maumee, OH) was added to the DDM-purified protein at a 1:5 protein:amphipol weight ratio 29,50. The mixture was incubated at 4 °C overnight with nutating. To remove detergent, Bio-Beads were incubated with sample at a 1:100 detergent:Bio-Beads weight ratio for 2 hrs at 4 °C with gentle agitation. The Bio-Beads were then removed by centrifugation at 4,500 rpm. Samples were further purified by SEC in buffer containing 25 mM Tris pH 7.5, 100 mM NaCl, 0.1 mM TCEP and either 10 mM LiCitrate (for NaCT-citrate) or 10 mM LiCl and 100 μM PF2 (for NaCT-PF2).
Cryo-EM specimen preparation and image processing
All cryo-EM grids were prepared by applying 3 μL of protein at ~0.75 mg/mL to a glow-discharged UltrAuFoil R1.2/1.3 300-mesh grid (Quantifoil) and blotted for 2.5 to 4 s under 100% humidity at 4 ºC before plunging into liquid ethane using a Mark IV Vitrobot (FEI).
Micrographs of the NaCT-citrate complex in amphipol were acquired on a Titan Krios microscope with a K2 direct electron detector and an energy filter slit width of 20 eV. The magnification used was 130,000X, with a super-resolution pixel size of 0.524 Å. Leginon 51 was used to target holes with 0 to 100 nm of ice, measured as described previously 52, at varying specimen tilts 36, resulting in a 1,749, 1,712, 3,445 and 196 micrographs were collected from 0º, 20º, 40º and 50° tilted specimens, respectively. Each micrograph was dose-fractioned over 40 frames, with an accumulated dose of 58 e-/Å2. On-the-fly data quality was measured by running MotionCor2 53 and CTFFIND4 54 under control of Appion 55. Images were acquired with image shifts up to 7 μm, with hardware beam tilt correction enabled in Leginon.
WARP 56 was used for frame alignment and CTF estimation of the NaCT-citrate dataset, and micrographs with an overall resolution worse than 5.5 Å were excluded from subsequent steps. Micrographs with a specimen tilt angle of 50º were also excluded due to increased ice thickness and excess particle movement. Initial particle picks from the 20º micrographs were used as templates for repicking using Topaz 57, yielding 1,151,799 particles from all micrographs. Particle stacks were uploaded to cryoSPARC 58 and data from the different specimen tilts were processed separately using 2D classification. Selected particles were combined for multiple rounds of 3D classification (ab initio model generation and heterogeneous 3D refinement with two or more classes and C2 symmetry imposed). Finally, a single class of 563,708 particles was selected for nonuniform refinement after signal subtraction and symmetry expansion to C1. The dynamic mask threshold was systematically screened to minimize masking artifacts during local refinement, resulting in the 3.04 Å map. Directional Fourier shell coefficient was calculated using a published script 59. Higher order CTF aberration correction 60, with or without grouping by image shift, did not improve the quality of the map. A map was also calculated in cisTEM 61 following the strategy of Dang et al. 59 for processing anisotropic data, confirming the overall resolution and substrate densities.
Micrographs of the NaCT-PF2 complex in amphipol were acquired on a Titan Krios microscope with a K2 direct electron detector. The magnification used was 22,500X, with a super-resolution pixel size of 0.537 Å. Leginon was used for automated data collection of 1,778, 711 and 1,143 micrographs from 0º, 20º and 40º tilted specimens, respectively. Each micrograph was dose-fractioned over 50 frames, with an accumulated dose of 69 e-/Å2. On-the-fly data quality was monitored by running MotionCor2 53 and CTFFIND4 54 under control of Appion 55. Images were acquired with image shifts up to 8 μm, with hardware beam tilt correction enabled in Leginon.
For the NaCT-PF2 dataset, WARP was used for frame alignment and CTF estimation, and micrographs with an overall resolution worse than 5.5 Å were excluded from subsequent steps. Initial particle picks from the 20º micrographs were used as templates for repicking using Topaz 57, yielding 1,044,228 particles from all micrographs. After multiple rounds of 3D classification (ab initio model generation and heterogeneous 3D refinement with two or more classes with C1 symmetry) a single class of 600,946 particles was selected for nonuniform refinement 62, resulting in a 3.18 Å map. Imposing C2 symmetry did not change the resolution or the appearance of the map, so C1 symmetry was chosen. Local refinement after systematically screening the dynamic mask threshold resulted in the 3.12 Å final map. Higher order CTF aberration correction 60, with or without grouping by image shift, did not improve the quality of the map. A map was also calculated in cisTEM 61 following the strategy of Dang et al. 59 for processing anisotropic data, confirming the overall resolution and PF2 density.
Within the NaCT-citrate complex map, the density for the bound substrate is significantly weaker than the surrounding protein or the corresponding inhibitor density in the NaCT-PF2 complex map. This is consistent with previous observations that negatively charged moieties give weaker density than neutral or positively charged groups of a cryo-EM map 63. This is proposed to be due to electron radiation damage or the charge dependence of electron scattering 64,65. In either case, the triple negative charge of the citrate would exacerbate these effects.
Model building and refinement
All maps were sharpened using Auto-sharpen Map in Phenix 66, built in Coot 67, and refined in Phenix real space refine 66. The NaCT-citrate map was sharpened, and the model refined, to 3.04 Å due to apparent anisotropy in the map. Due to weak ligand density in the NaCT-citrate map, the VcINDY structure (PDB: 5ULD) 28 was used as a reference when orienting citrate and Na+ within the NaCT binding site. All figures were prepared in Chimera 68 and PyMol 69.
Extended Data
Extended Data Fig. 1. Kinetic cycle of NaCT and molecular structures of its substrates and inhibitors.
a, Kinetic cycle and, b, schematic model of the SLC13 transport cycle cycle. Co: outward-facing conformation; Ci: inward-facing conformation; S: substrate. The number of co-transported Na+ for different SLC13 transporters varies between 3 and 4, but only two are shown here. All available biochemistry evidence indicates that sodium ions bind before and release after the substrate. c, Molecular structures of the NaCT substrate, citrate, and various inhibitors. d, Inhibitory concentrations (IC50) of inhibitors for NaCT and the dicarboxylate transporters NaDC1 and NaDC3 23–25. Whereas PF2 is highly selective towards NaCT, PF4 and PF4a inhibit all three human di-/tricarboxylate transporters.
Extended Data Fig. 2. Purification and functional characterization of human NaCT.
a, Michaelis-Menten plot showing the citrate dependence of Na+-driven radioactive citrate uptake into HEK293 cells that expressed EGFP-NaCT. HEK293 cells transfected with a EGFP vector were used as a control. All points include 6 biological replicates from two independent experiments, with error bars indicating the standard deviation. Insert: Representative confocal image of HEK293 cells transfected with the EGFP-NaCT construct, from four biological replicates. Scale bar indicates 10 μm. b, Analytical fluorescence size-exclusion chromatography (FSEC) of detergent-solubilized cell lysate of Hi5 cells overexpressing an EGFP-NaCT construct. Peak height represents the protein concentration, while the peak sharpness indicates the protein homogeneity. The cell lysate was solubilized in DDM detergent, incubated with various compounds at 37 °C, and loaded onto an analytical SEC column on HPLC. c, Preparative size-exclusion chromatography (SEC) of NaCT following Ni2+-NTA affinity purification. d, Representative SDS-PAGE of purified NaCT, from twenty biological replicates. Source data are provided as a Source Data file. e, NaCT binding to citrate in detergent solution as measured by tryptophan fluorescence quenching. All points include three biological replicates, with error bars indicating the standard deviation. The Kd was found to be 148 ± 28 mM. f, Molecular mass measurements of DDM-purified NaCT using multiangle light scattering. The measured mass of 125 ± 2 kDa agrees with the molecular weight of a dimeric NaCT of 126.124 kDa calculated from the protein sequence.
Extended Data Fig. 3. Characterization of the NaCT-citrate cryo-EM specimens and flow chart of image processing.
a, Violin plot showing the distribution of ice thickness in electron micrographs from specimens tilted at 0°, 20°, 40° and 50°. The plot widths correspond to ice thickness distribution. Theoretically, the ice thickness at 20°, 40° and 50° tilts would increase from 0° by 6%, 30% and 56%, respectively. The actual number of electron micrographs with ultra thin ice (5 nm – 20 nm) decreased significantly with the tilt angle. b, Violin plot showing the distribution of the average horizontal particle displacements from the first five frames of each electron micrograph. The beam-induced particle displacements increased with the tilt angle. c, Violin plot showing the distribution of micrograph CTF fit resolution of the micrographs. The image quality dramatically deteriorated for those recorded from 50° tilted specimens. d, Flow chart of image processing of the NaCT-citrate images. Only images collected from specimens tilted at 0°, 20° and 40° were included in the processing and the generation of the finals maps.
Extended Data Fig. 4. Cryo-EM data collection from 0°, 20° and 40° tilted specimens and image processing of the NaCT-citrate complex.
a, Orientation distribution of particles from a NaCT-citrate complex reconstruction using only particles from 0° tilt micrographs. At 0° sample tilt most of the particles are top views (viewed along the membrane normal). Side views (viewed from within the membrane plane) are relatively rare. The number of side views and top views differ at three orders of magnitude, indicating a serious degree of preferred orientation. Orientation distribution of particles from a NaCT-citrate complex reconstruction using particles from, b, 40° specimen tilt and, c, all micrographs at 0°, 20° and 40° specimen tilts. With tilting the orientation distribution of particles becomes much more isotropic, alleviating the preferred orientation problem. The 30 most populous classes from 2D classification of particles from the, d, 0° and, e, 40° tilted specimens. The 0° classes are dominated by top-views, with few side- and oblique-views. In contrast, the 40° micrographs include clear side- and oblique-view classes.
Extended Data Fig. 5. Structure determination of NaCT-citrate complex.
a, Cryo-EM map Fourier shell coefficient curve of the NaCT-citrate complex reconstruction using all micrographs. Arrows indicate the nominal map resolution of 3.04 Å, based on a FSC = 0.143 threshold. b, Directional Fourier shell correlation curves of the NaCT-citrate complex reconstruction. Each purple trace is an individual FSC calculated from a conical wedge of the overall spherical shell, sampled on a 500-point Fibonacci spherical grid. The global FSC curve (the yellow trace), as calculated by averaging all directional FSC curves, also indicates a resolution of 3.04 Å. c, Mask used for refinement using cryoSPARC. d, Local resolution of the map. e, Exemplary cryo-EM densities showing the quality of the NaCT-citrate model’s chain tracing. All the key helices that are involved in citrate and sodium ion binding are shown. The density for peripheral helix TM1 is poorly resolved, with the helix loosely attached to the rest of the protein. f, Model of NaCT dimer. The scaffold domain and the transport domain in each protomer is colored green and pink, respectively. g, Model of the NaCT protomer as viewed from the cytosol. C1 symmetry was used for the image reconstruction and model refinement. The two protomers are identical, with an r.m.s.d. of 0.002 Å.
Extended Data Fig. 6. Features of the NaCT-citrate structure.
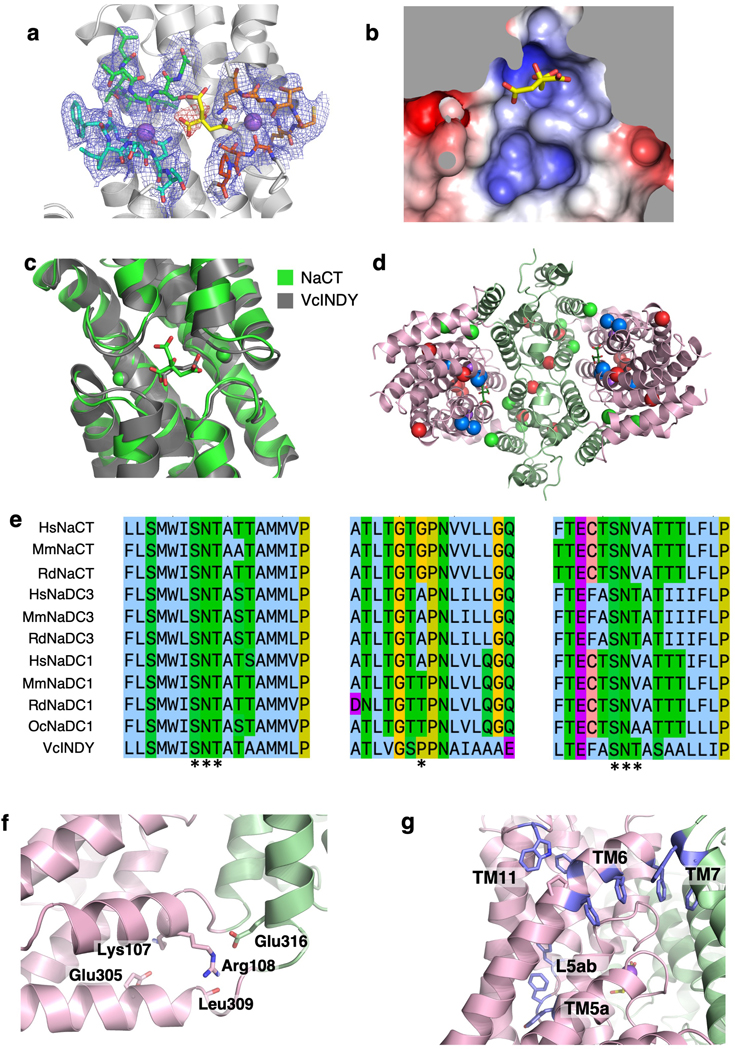
a, Cryo-EM density map around the citrate binding sites. All the densities are shown at the same contour levels. The density for citrate is colored red. b, Electrostatic surface of the citrate binding site. The sodium ions at Na1 and Na2 were included in the calculations. c, Overlay of the NaCT-citrate and VcINDY-succinate (5UL7) structures, along with their respective substrates, shown in green and grey, respectively. d, Locations of the SLC13A5-Epilepsy missense mutations within the NaCT structure as viewed the cytosol. e, Sequence alignments of the first SNT motif (left), L5ab – TM5b (center), and second SNT motif (right) from SLC13 family proteins and bacterial homologs. The second SNT motif in NaCT has a sequence of Ser-Asn-Val. f, Interaction of Lys107 and Arg108 on H4c with other residues on H6b and TM7. g, Aromatic clusters near TM6.
Extended Data Fig. 7. Cryo-EM data collection from tilted specimens and reconstruction FSC curve of the NaCT-PF2 complex.
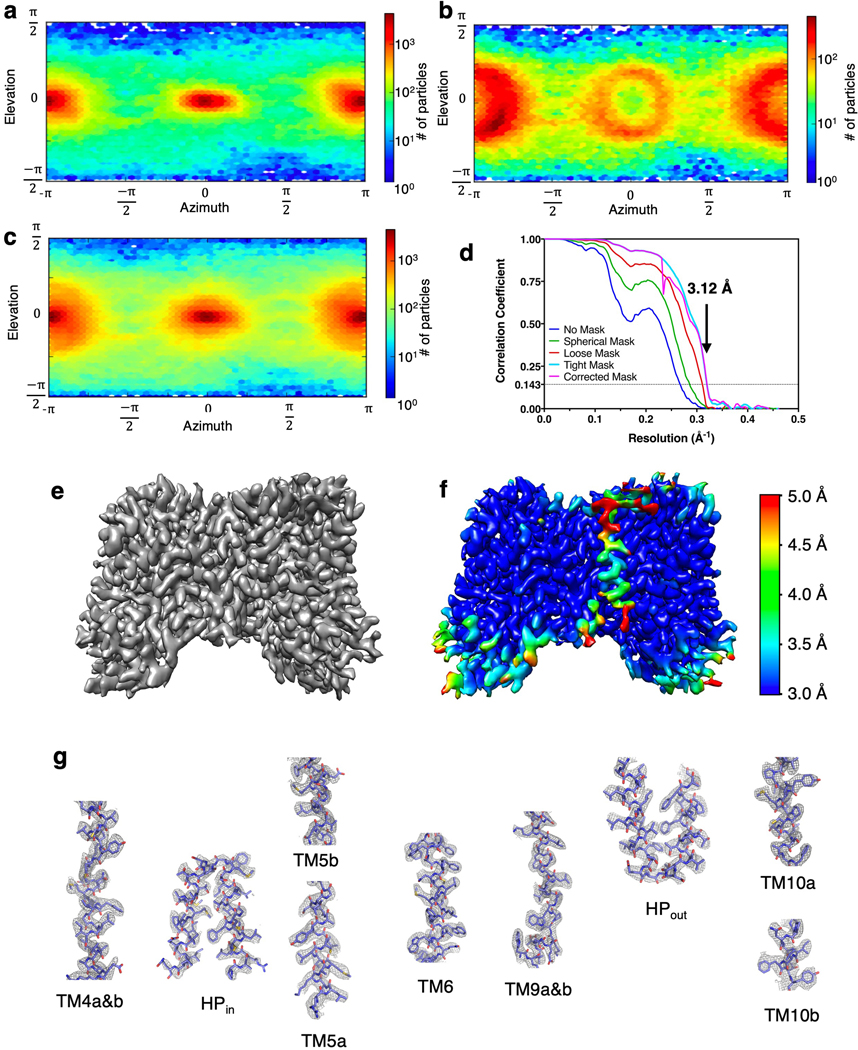
a, Orientation distribution of particles from a NaCT-PF2 complex reconstruction using only particles from images of 0° tilt specimens. At 0° sample tilt most of the particles are top views, while side views are relatively rare. The number of side views and top views differ by up to three orders of magnitude, indicating a serious degree of preferred orientation. Orientation distribution of particles from a NaCT-PF2 complex reconstruction using particles from, b, 40° tilt and, c, all micrographs collected at 0°, 20° and 40° tilts. With tilting the particle views become much more isotropic, alleviating the preferred orientation problem. d, Cryo-EM map Fourier shell correlation curve of the NaCT-PF2 complex reconstruction using all micrographs. e, Cryo-EM map of the NaCT-PF2 complex to 3.12 Å resolution. f, Local resolution of the map. g, Exemplary cryo-EM densities showing the quality of the NaCT-PF2 model’s chain tracing. All the key helices that are involved in PF2 and sodium ion binding are shown.
Extended Data Fig. 8. Map and structural model of the NaCT-PF2 complex.
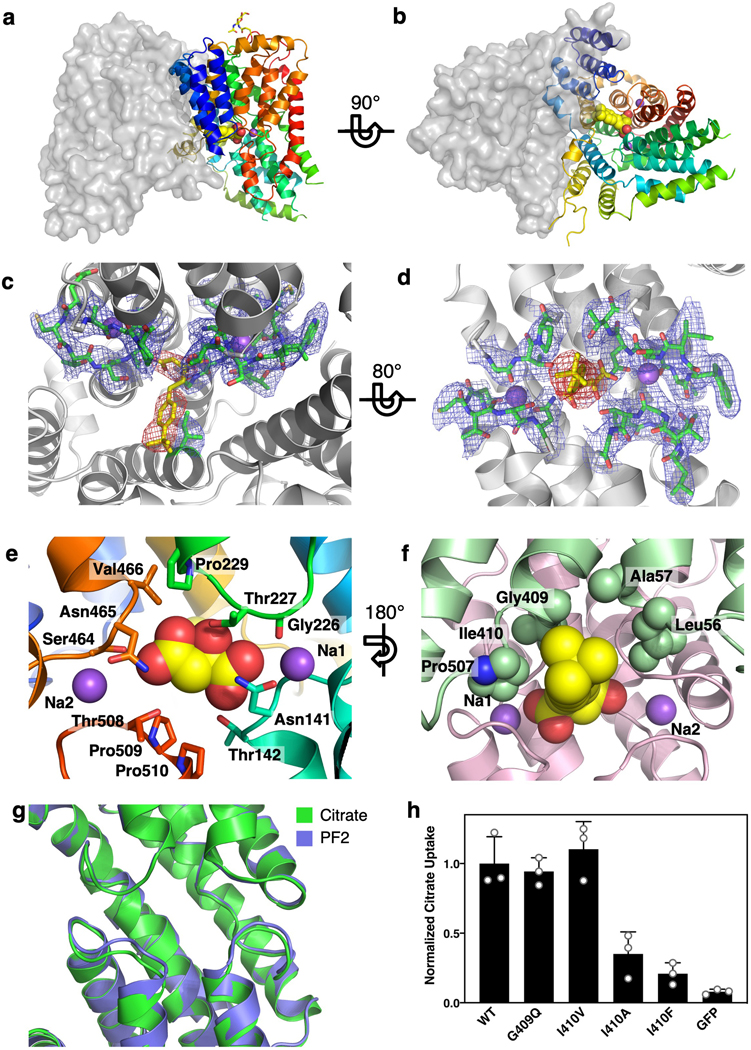
Structure of the NaCT-PF2 complex as viewed from, a, the membrane plane and, b, the cytosol. c&d, Cryo-EM density map around the PF2 binding sites. All the densities are shown at the same contour levels. The density for PF2 is colored red. e, PF2 binding site as viewed from within the transport domain. f, Packing of scaffold domain side chains around PF2. The scaffold and transport domains are colored green and pink, respectively. Residues Leu56, Ala57, Gly409 and Ile410 are shown as spheres. g, Overlay of the NaCT-citrate and NaCT-PF2 structures in green and blue, respectively. The loops enclosing Na1 and Na2 sodium binding sites move by ~1 Å, more tightly enclosing both sites in the NaCT-PF2 complex. h, Na+-driven citrate uptake into HEK293 cells transfected with various EGFP-tagged NaCT mutants. Each point includes three biological replicates, with error bars indicating the standard deviation. G409Q and I410V mutants retained wildtype level activity and were used to measure inhibition by PF2 in Fig 4b.
Extended Data Table 1.
Cryo-EM data collection and structure determination of NaCT
| NaCT-Citrate | NaCT-PF2 | |
|---|---|---|
| EMDB ID | EMD-22457 | EMD-22456 |
| PDB ID | 7JSK | 7JSJ |
| Microscope | Krios-NYU | Krios-NYSBC |
| Magnification | 130,000 | 22,500 |
| Voltage (kV) | 300 | 300 |
| Movies | 4,240 | 3,632 |
| Electron dose (e−Å2) | 57.71 | 69.42 |
| Defocus range (pm) | 1.2– 1.7 | 1.3–2.3 |
| Collection mode | Super-resolution | Super-resolution |
| Effective pixel size (Å) | 0.518 | 0.537 |
| Data processing | ||
| Initial number of particles | 1,151,799 | 1,044,228 |
| Final number of particles | 563,708 | 600,946 |
| Symmetry imposed | C1 | C1 |
| B-factor sharpening (Å2) | 96.62 | 50.86 |
| Map resolution* (Å) | 3.04 | 3.12 |
| Model refinement | ||
| Non-hydrogen atoms | 7372 | 7388 |
| Protein residues | 936 | 936 |
| Ligands | 8 | 8 |
| Mean B factor | ||
| Protein (Å2) | 65.83 | 26.08 |
| Ligands (Å2) | 74.59 | 28.65 |
| RMS deviations | ||
| Bond lengths (Å) | 0.011 | 0.008 |
| Bond angles (°) | 1.133 | 1.075 |
| Molprobity score | 2.41 | 2.67 |
| Clash score | 6.57 | 9.15 |
| Poor rotamers (%) | 4.74 | 7.23 |
| Ramachandran plot | ||
| Favored (%) | 90.61 | 90.61 |
| Allowed (%) | 9.17 | 9.17 |
| Outliers (%) | 0.22 | 0.22 |
| Model resolution (Å) | 3.5 | 3.3 |
Resolution determined by Gold-Standard FSC threshold of 0.143.
Extended Data Table 2.
Classification of SLC13A5-Epilepsy mutations
| Type | Mutations | Proposed effect |
|---|---|---|
| Ia | E160*, E171fs, R333*, W341*, I367fs, P407fs, G484fs | Early termination and frame shift |
| Ib | P68Q, Y82C, G130D, T145K†, G423E†, P487L, L488P, L492P | Folding or dimerization defect |
| IIa | T142M, G219R†, T227M, P505L | Substrate- and Na+-binding defect |
| IIb | C50R, H106R, L111R†, G417E, S427L, D524H | Conformational change defect |
Early termination
Mutations that can be classified as more than one type.
Supplementary Material
Acknowledgements
This work was financially supported by the NIH (R01NS108151 and R01GM121994), the G. Harold and Leila Y. Mathers Foundation, the TESS Research Foundation, the American Epilepsy Society and Pfizer Inc. D.B.S. was supported by the American Cancer Society Postdoctoral Fellowship (129844-PF-17-135-01-TBE) and Department of Defense Horizon Award (W81XWH-16-1-0153). J.K.H. and J.A.M. were supported by the NINDS Intramural Program. We thank the following colleagues for reagents, technical assistance and helpful discussions: Y. Cheng, N. Coudray, K. Huard, T. Kawate, J. Li, R. Mancusso, J. Marden, F. Ono and J. Zhao. We are also grateful to the staff at the following facilities for assistance in grid screening and data collection: K. Maruthi at the Simons Electron Microscopy Center at the New York Structural Biology Center, H. Scott at the Pacific Northwest Center for Cryo-EM and K. Dancel from the NYU Microscopy Core. EM data processing used computing resources at the HPC Facility of NYULMC, and we were assisted by A. Siavosh-Haghighi and M. Costantino.
Footnotes
Competing interests
The authors declare no competing interest
Data availability
EM densities and protein models have been deposited in the Electron Microscopy Data Bank and Protein Data Bank for the NaCT-citrate (EMD-22457, 7JSK) and NaCT-PF2 (EMD-22456, 7JSJ) complexes. All other data are available from the corresponding author upon reasonable request.
References
- 1.Spencer AF & Lowenstein JM, Supply of precursors for synthesis of fatty acids. J Biol Chem 237, 3640–3648 (1962). [PubMed] [Google Scholar]
- 2.Ruderman NB, Saha AK, Vavvas D, & Witters LA, Malonyl-CoA, fuel sensing, and insulin resistance. Am J Physiol-Endoc M 276, E1–E18 (1999). [DOI] [PubMed] [Google Scholar]
- 3.Sul HS & Smith S, Fatty acid synthesis in eukaryotes in Biochemistry of Lipids, Lipoproteins and Membranes, edited by Vance DE & Vance JE (Elsevier, New York, 2008), pp. 155–190. [Google Scholar]
- 4.Fang M. & Lowenstein JM, Citrate and the conversion of carbohydrate into fat. The regulation of fatty acid synthesis by rat liver extracts. Biochem J 105, 803–811 (1967). [DOI] [PMC free article] [PubMed] [Google Scholar]
- 5.Shrago E, Spennetta T, & Gordon E, Fatty acid synthesis in human adipose tissue. J Biol Chem 244, 2761–2766 (1969). [PubMed] [Google Scholar]
- 6.Thevenon J. et al. , Mutations in SLC13A5 cause autosomal-recessive epileptic encephalopathy with seizure onset in the first days of life. Am J Hum Genet 95, 113–120 (2014). [DOI] [PMC free article] [PubMed] [Google Scholar]
- 7.Hardies K. et al. , Recessive mutations in SLC13A5 result in a loss of citrate transport and cause neonatal epilepsy, developmental delay and teeth hypoplasia. Brain 138, 3238–3250 (2015). [DOI] [PubMed] [Google Scholar]
- 8.Klotz J, Porter BE, Colas C, Schlessinger A, & Pajor AM, Mutations in the Na+/citrate cotransporter NaCT (SLC13A5) in pediatric patients with epilepsy and developmental delay. Mol Med 22, 310–321 (2016). [DOI] [PMC free article] [PubMed] [Google Scholar]
- 9.Wellen KE et al. , ATP-citrate lyase links cellular metabolism to histone acetylation. Science 324, 1076–1080 (2009). [DOI] [PMC free article] [PubMed] [Google Scholar]
- 10.Inoue K, Zhuang L, Maddox DM, Smith SB, & Ganapathy V, Structure, function, and expression pattern of a novel sodium-coupled citrate transporter (NaCT) cloned from mammalian brain. J Biol Chem 277, 39469–39476 (2002). [DOI] [PubMed] [Google Scholar]
- 11.Inoue K. et al. , Functional features and genomic organization of mouse NaCT, a sodium-coupled transporter for tricarboxylic acid cycle intermediates. Biochem J 378, 949–957 (2004). [DOI] [PMC free article] [PubMed] [Google Scholar]
- 12.Gopal E. et al. , Expression and functional features of NaCT, a sodium-coupled citrate transporter, in human and rat livers and cell lines. Am J Physiol-Gastr L 292, G402–G408 (2007). [DOI] [PubMed] [Google Scholar]
- 13.Li L. et al. , SLC13A5 is a novel transcriptional target of the pregnane X receptor and sensitizes drug-induced steatosis in human liver. Molecular pharmacology 87, 674–682 (2015). [DOI] [PMC free article] [PubMed] [Google Scholar]
- 14.Brachs S. et al. , Inhibition of citrate cotransporter Slc13a5/mINDY by RNAi improves hepatic insulin sensitivity and prevents diet-induced non-alcoholic fatty liver disease in mice. Mol Metab 5, 1072–1082 (2016). [DOI] [PMC free article] [PubMed] [Google Scholar]
- 15.Birkenfeld AL et al. , Deletion of the mammalian INDY homolog mimics aspects of dietary restriction and protects against adiposity and insulin resistance in mice. Cell Metab 14, 184–195 (2011). [DOI] [PMC free article] [PubMed] [Google Scholar]
- 16.Rogina B, Reenan RA, Nilsen SP, & Helfand SL, Extended life-span conferred by cotransporter gene mutations in Drosophila. Science 290, 2137–2140 (2000). [DOI] [PubMed] [Google Scholar]
- 17.Wang PY et al. , Long-lived Indy and calorie restriction interact to extend life span. P Natl Acad Sci USA 106, 9262–9267 (2009). [DOI] [PMC free article] [PubMed] [Google Scholar]
- 18.Fei YJ et al. , Relevance of NAC-2, an Na+-coupled citrate transporter, to life span, body size and fat content in Caenorhabditis elegans. Biochem J 379, 191–198 (2004). [DOI] [PMC free article] [PubMed] [Google Scholar]
- 19.Bergeron MJ, Clemencon B, Hediger MA, & Markovich D, SLC13 family of Na+-coupled di- and tri-carboxylate/sulfate transporters. Mol Aspects Med 34, 299–312 (2013). [DOI] [PubMed] [Google Scholar]
- 20.Pajor AM, Sodium-coupled dicarboxylate and citrate transporters from the SLC13 family. Pflugers Arch 466, 119–130 (2014). [DOI] [PubMed] [Google Scholar]
- 21.Joshi AD & Pajor AM, Role of conserved prolines in the structure and function of the Na+/dicarboxylate cotransporter 1, NaDC1. Biochemistry 45, 4231–4239 (2006). [DOI] [PMC free article] [PubMed] [Google Scholar]
- 22.Willmes DM et al. , The longevity gene INDY (I’m Not Dead Yet) in metabolic control: Potential as pharmacological target. Pharmacol Ther 185, 1–11 (2018). [DOI] [PubMed] [Google Scholar]
- 23.Huard K. et al. , Discovery and characterization of novel inhibitors of the sodium-coupled citrate transporter (NaCT or SLC13A5). Sci Rep 5, 17391 (2015). [DOI] [PMC free article] [PubMed] [Google Scholar]
- 24.Huard K. et al. , Optimization of a dicarboxylic series for in Vivo inhibition of citrate transport by the solute carrier 13 (SLC13) family. J Med Chem 59, 1165–1175 (2016). [DOI] [PubMed] [Google Scholar]
- 25.Pajor AM et al. , Molecular basis for inhibition of the Na+/citrate transporter NaCT (SLC13A5) by dicarboxylate Inhibitors. Molecular pharmacology 90, 755–765 (2016). [DOI] [PubMed] [Google Scholar]
- 26.Rives ML, Shaw M, Zhu B, Hinke SA, & Wickenden AD, State-dependent allosteric inhibition of the human SLC13A5 citrate transporter by hydroxysuccinic acids, PF-06649298 and PF-06761281. Molecular pharmacology 90, 766–774 (2016). [DOI] [PubMed] [Google Scholar]
- 27.Mancusso R, Gregorio GG, Liu Q, & Wang DN, Structure and mechanism of a bacterial sodium-dependent dicarboxylate transporter. Nature 491, 622–626 (2012). [DOI] [PMC free article] [PubMed] [Google Scholar]
- 28.Nie R, Stark S, Symersky J, Kaplan RS, & Lu M, Structure and function of the divalent anion/Na+ symporter from Vibrio cholerae and a humanized variant. Nat Commun 8, 15009 (2017). [DOI] [PMC free article] [PubMed] [Google Scholar]
- 29.Sauer DB et al. , Structural basis for the reaction cycle of DASS dicarboxylate transporters. eLife 9, (2020). [DOI] [PMC free article] [PubMed] [Google Scholar]
- 30.Schlessinger A, Sun NN, Colas C, & Pajor AM, Determinants of substrate and cation transport in the human Na+/dicarboxylate cotransporter NaDC3. The Journal of biological chemistry 289, 16998–17008 (2014). [DOI] [PMC free article] [PubMed] [Google Scholar]
- 31.Colas C, Pajor AM, & Schlessinger A, Structure-based identification of inhibitors for the SLC13 family of Na+/dicarboxylate cotransporters. Biochemistry 54, 4900–4908 (2015). [DOI] [PMC free article] [PubMed] [Google Scholar]
- 32.Inoue K, Zhuang L, Maddox DM, Smith SB, & Ganapathy V, Human sodium-coupled citrate transporter, the orthologue of Drosophila Indy, as a novel target for lithium action. Biochem J 374, 21–26 (2003). [DOI] [PMC free article] [PubMed] [Google Scholar]
- 33.Gopal E. et al. , Species-specific influence of lithium on the activity of SLC13A5 (NaCT): lithium-induced activation is specific for the transporter in primates. The Journal of pharmacology and experimental therapeutics 353, 17–26 (2015). [DOI] [PubMed] [Google Scholar]
- 34.Mancusso R, Karpowich NK, Czyzewski BK, & Wang DN, Simple screening method for improving membrane protein thermostability. Methods 55, 324–329 (2011). [DOI] [PMC free article] [PubMed] [Google Scholar]
- 35.Auer M. et al. , High-yield expression and functional analysis of Escherichia coli glycerol-3-phosphate transporter. Biochemistry 40, 6628–6635. (2001). [DOI] [PubMed] [Google Scholar]
- 36.Tan YZ et al. , Addressing preferred specimen orientation in single-particle cryo-EM through tilting. Nat Methods 14, 793–796 (2017). [DOI] [PMC free article] [PubMed] [Google Scholar]
- 37.Mulligan C. et al. , The bacterial dicarboxylate transporter VcINDY uses a two-domain elevator-type mechanism. Nature structural & molecular biology 23, 256–263 (2016). [DOI] [PMC free article] [PubMed] [Google Scholar]
- 38.Drew D. & Boudker O, Shared molecular mechanisms of membrane transporters. Annu Rev Biochem 85, 543–572 (2016). [DOI] [PubMed] [Google Scholar]
- 39.Garaeva AA & Slotboom DJ, Elevator-type mechanisms of membrane transport. Biochem Soc Trans (2020). [DOI] [PMC free article] [PubMed] [Google Scholar]
- 40.Khamaysi A, Aharon S, Eini-Rider H, & Ohana E, A dynamic anchor domain in SLC13 transporters controls metabolite transport. J Biol Chem 295, 8155–8163 (2020). [DOI] [PMC free article] [PubMed] [Google Scholar]
- 41.Makwana KM & Mahalakshmi R, Implications of aromatic-aromatic interactions: From protein structures to peptide models. Protein Sci 24, 1920–1933 (2015). [DOI] [PMC free article] [PubMed] [Google Scholar]
- 42.Nayal M. & Di Cera E, Valence screening of water in protein crystals reveals potential Na+ binding sites. J Mol Biol 256, 228–234 (1996). [DOI] [PubMed] [Google Scholar]
- 43.Pajor AM, Conformationally sensitive residues in transmembrane domain 9 of the Na+/dicarboxylate co-transporter. J Biol Chem 276, 29961–29968 (2001). [DOI] [PubMed] [Google Scholar]
- 44.Dewulf JP et al. , SLC13A3 variants cause acute reversible leukoencephalopathy and alpha-ketoglutarate accumulation. Ann Neurol 85, 385–395 (2019). [DOI] [PubMed] [Google Scholar]
Additional references
- 45.Law CJ, Yang Q, Soudant C, Maloney PC, & Wang DN, Kinetic evidence is consistent with the rocker-switch mechanism of membrane transport by GlpT. Biochemistry 46, 12190–12197 (2007). [DOI] [PMC free article] [PubMed] [Google Scholar]
- 46.Law CJ, Enkavi G, Wang DN, & Tajkhorshid E, Structural basis of substrate selectivity in the glycerol-3-phosphate:phosphate antiporter. Biophys J 97, 1346–1353 (2009). [DOI] [PMC free article] [PubMed] [Google Scholar]
- 47.Slotboom DJ, Duurkens RH, Olieman K, & Erkens GB, Static light scattering to characterize membrane proteins in detergent solution. Methods 46, 73–82 (2008). [DOI] [PubMed] [Google Scholar]
- 48.Waight AB, Love J, & Wang DN, Structure and mechanism of a pentameric formate channel. Nature structural & molecular biology 17, 31–37 (2010). [DOI] [PMC free article] [PubMed] [Google Scholar]
- 49.Kendrick BS, Kerwin BA, Chang BS, & Philo JS, Online size-exclusion high-performance liquid chromatography light scattering and differential refractometry methods to determine degree of polymer conjugation to proteins and protein-protein or protein-ligand association states. Anal Biochem 299, 136–146 (2001). [DOI] [PubMed] [Google Scholar]
- 50.Huynh KW et al. , CryoEM structure of the human SLC4A4 sodium-coupled acid-base transporter NBCe1. Nat Commun 9, 900 (2018). [DOI] [PMC free article] [PubMed] [Google Scholar]
- 51.Suloway C. et al. , Automated molecular microscopy: the new Leginon system. J Struct Biol 151, 41–60 (2005). [DOI] [PubMed] [Google Scholar]
- 52.Rice WJ et al. , Routine determination of ice thickness for cryo-EM grids. J Struct Biol 204, 38–44 (2018). [DOI] [PMC free article] [PubMed] [Google Scholar]
- 53.Zheng SQ et al. , MotionCor2: anisotropic correction of beam-induced motion for improved cryo-electron microscopy. Nat Methods 14, 331–332 (2017). [DOI] [PMC free article] [PubMed] [Google Scholar]
- 54.Rohou A. & Grigorieff N, CTFFIND4: Fast and accurate defocus estimation from electron micrographs. J Struct Biol 192, 216–221 (2015). [DOI] [PMC free article] [PubMed] [Google Scholar]
- 55.Lander GC et al. , Appion: an integrated, database-driven pipeline to facilitate EM image processing. J Struct Biol 166, 95–102 (2009). [DOI] [PMC free article] [PubMed] [Google Scholar]
- 56.Tegunov D. & Cramer P, Real-time cryo-electron microscopy data preprocessing with Warp. Nat Methods 16, 1146–1152 (2019). [DOI] [PMC free article] [PubMed] [Google Scholar]
- 57.Bepler T. et al. , Positive-unlabeled convolutional neural networks for particle picking in cryo-electron micrographs. Nat Methods 16, 1153–1160 (2019). [DOI] [PMC free article] [PubMed] [Google Scholar]
- 58.Punjani A, Rubinstein JL, Fleet DJ, & Brubaker MA, cryoSPARC: algorithms for rapid unsupervised cryo-EM structure determination. Nat Methods 14, 290–296 (2017). [DOI] [PubMed] [Google Scholar]
- 59.Dang S. et al. , Cryo-EM structures of the TMEM16A calcium-activated chloride channel. Nature 552, 426–429 (2017). [DOI] [PMC free article] [PubMed] [Google Scholar]
- 60.Zivanov J, Nakane T, & Scheres SHW, Estimation of high-order aberrations and anisotropic magnification from cryo-EM data sets in RELION-3.1. IUCrJ 7, 253–267 (2020). [DOI] [PMC free article] [PubMed] [Google Scholar]
- 61.Grant T, Rohou A, & Grigorieff N, cisTEM, user-friendly software for single-particle image processing. eLife 7, (2018). [DOI] [PMC free article] [PubMed] [Google Scholar]
- 62.Punjani A, Zahng H, & Fleet DJ, Non-uniform refinement: Adaptive regularization improves single particle cryo-EM reconstruction. BioRxiv (2020). [DOI] [PubMed] [Google Scholar]
- 63.Kühlbrandt W, Wang DN, & Fujiyoshi Y, Atomic model of plant light-harvesting complex by electron crystallography. Nature 367, 614–621 (1994). [DOI] [PubMed] [Google Scholar]
- 64.Mitsuoka K. et al. , The structure of bacteriorhodopsin at 3.0 Å resolution based on electron crystallography: implication of the charge distribution. J Mol Biol 286, 861–882 (1999). [DOI] [PubMed] [Google Scholar]
- 65.Bartesaghi A, Matthies D, Banerjee S, Merk A, & Subramaniam S, Structure of beta-galactosidase at 3.2-Å resolution obtained by cryo-electron microscopy. Proc Natl Acad Sci U S A 111, 11709–11714 (2014). [DOI] [PMC free article] [PubMed] [Google Scholar]
- 66.Adams PD et al. , PHENIX: a comprehensive Python-based system for macromolecular structure solution. Acta Crystallogr D Biol Crystallogr 66, 213–221 (2010). [DOI] [PMC free article] [PubMed] [Google Scholar]
- 67.Emsley P. & Cowtan K, Coot: model-building tools for molecular graphics. Acta Crystallogr D Biol Crystallogr 60, 2126–2132 (2004). [DOI] [PubMed] [Google Scholar]
- 68.Pettersen EF et al. , UCSF Chimera--a visualization system for exploratory research and analysis. Journal of computational chemistry 25, 1605–1612 (2004). [DOI] [PubMed] [Google Scholar]
- 69.DeLano WL, The PyMOL User’s Manual. (DeLano Scientific, San Carlos, CA, 2002). [Google Scholar]
Associated Data
This section collects any data citations, data availability statements, or supplementary materials included in this article.


