

Abstract
Background and Aims
Increasing numbers of school-based drug surveys are transitioning data collection to electronic tablets from paper-and-pencil, which may produce a survey mode effect and consequent discontinuity in time trends for population estimates of drug prevalence. This study tested whether (a) overall, self-reported drug use prevalence is higher on electronic tablets versus paper-and-pencil surveys, (b) socio-demographics moderate survey mode effects and (c) levels of missing data are lower for electronic tablet versus paper-and-pencil modes.
Design
A randomized controlled experiment.
Setting
Results are nationally representative of students in the contiguous United States.
Participants
A total of 41866 8th, 10th and 12th grade students who participated in the 2019 Monitoring the Future school-based survey administration.
Intervention and comparator
Surveys were administered to students in a randomly selected half of schools with electronic tablets (intervention) and with paper-and-pencil format (comparator) for the other half.
Measurements
Primary outcome was the total number of positive drug use responses. Secondary outcomes were the percentage of respondents completing all drug questions, percentage of drug questions unanswered and mean number of missing drug items.
Findings
The relative risk (RR) for total number of positive drug use responses for electronic tablets versus paper-and-pencil surveys were small and their 95% confidence intervals (CI) included the value of one for reporting intervals of life-time (RR = 1.03; 95% CI, 0.93–1.14), past 12 months (RR = 1.01; 95% CI, 0.91–1.11), past 30 days (RR = 1.05; 95% CI, 0.93–1.20) and for heavy use (RR = 1.10; 95% CI, 0.93–1.29). Multiplicative interaction tests indicated no moderation of these relative risks by race (white versus non-white), population density, census region, public/private school, year of school participation, survey version or non-complete drug responses. Levels of missing data were significantly lower for electronic tablets versus paper-and-pencil surveys.
Conclusions
Adolescent drug prevalence estimates in the United States differed little across electronic tablet versus paper-and-pencil survey modes, and showed little to no effect modification by socio-demographics. Levels of missing data were lower for electronic tablets.
Keywords: Adolescent, experiment, nationally representative, surveillance, survey mode, tablet
INTRODUCTION
More than 50 countries use school-based surveys to track national trends in adolescent substance use and to evaluate national policy targeted at its reduction [1,2]. Paper-and-pencil surveys have long been the prevailing survey mode for such studies, although in recent years electronic tablets have replaced paper-and-pencil surveys in a small but growing number of countries.
Whether a transition to electronic tablets will produce a mode effect and consequent discontinuity in trends for national estimates of adolescent drug use is an open question. In general, electronic compared to paper-and-pencil surveys tend towards slightly higher prevalence estimates of sensitive outcomes such as drug use. Evaluating the magnitude of any such mode effect for school-based studies is important to identify and adjust drug prevalence estimates.
We conducted a randomized controlled experiment to examine the potential impact of electronic tablet (7’ Samsung Table A) versus paper-and-pencil survey mode on national drug prevalence estimates. As described in more detail below, this experiment involved surveying a school-based, nationally representative sample of 41 866 US adolescents in schools randomly assigned to respond using electronic tablets or paper-and-pencil.
BACKGROUND
Prevalence levels of socially undesirable behaviors such as drug use are typically higher in computer-assisted self-interviewing (CASI) compared with paper-and-pencil self-administered questionnaires (SAQ). Early studies found that computer-based surveys resulted in higher reports of adolescent drug use, sexual partners and violence [3,4], and computer-based surveys also reduced the negative effect of bystanders on adolescent reporting of drug use relative to paper SAQs [5]. Since these early studies, CASI or audio-CASI has become the standard for collecting data on sensitive topics in in-person surveys. This is based on the argument that computer administration affords greater privacy, both during the completion of the survey and afterwards [6].
Two recent meta-analyses support a higher prevalence of reporting sensitive behaviors for computer-based compared to paper surveys. Gnambs & Kaspar [7] found that computerized surveys led to significantly more reporting of socially undesirable behaviors than comparable paper-and-pencil surveys among adolescents, with the effect strongest for highly sensitive behaviors and surveys administered individually to respondents. More recently, Gomes et al. [8] focused more narrowly on reports on offending. Of the 10 studies comparing paper SAQs with CASI, five comparisons favored CASI; only one reached statistical significance at the α = 0.05 level.
School-based surveys administered in group settings have not yet produced evidence consistent with the general finding of higher prevalence on computer compared to paper for sensitive items. A randomized study in Germany on youth delinquency led the authors to conclude that computer and paper surveys produce comparable results (one of 15 measures differed at P < 0.05 in a sample of 2033 students) [9]. Few differences by mode were apparent in a similar, randomized, school-based study in Switzerland asking students to self-report on delinquency items (eight of 72 differed at P < 0.05 in a study of 1203 students) [10]. Finally, a US randomized study focusing on an extensive array of adolescent drug use measures in 7th, 9th, and 11th grades concluded that computer and paper surveys yielded similar outcomes [11].
Taken as a whole, the general findings regarding computer-based reporting on sensitive behaviors would lead us to expect higher drug prevalence levels for tablet compared to paper-based surveys, but the published evidence supporting such a mode effect in school-based drug use surveys is inconclusive. It is possible that any mode effect in school surveys on drug use may be so small that it is largely inconsequential.
To examine potential mode effects, we conducted a randomized controlled, school-based study that we designed with three main strengths. First, the sample size of this study was more than 20 times larger than existing, randomized controlled studies on the topic. The large sample size is important to sufficiently power the study to detect potentially small effects. Secondly, this study measured potential mode effects on more than 350 drug prevalence outcomes among three grades. The large number of outcomes allows the analysis to potentially detect any mode effects that are too small to observe for an individual drug outcome but may become apparent when pooling them. Finally, the study is nationally representative so that the results are widely generalizable and not specific to any region or specialized group.
The specific aims of this randomized controlled study are to (1) compare the number of positive responses to drug questions on electronic tablets compared to paper-and-pencil surveys, (2) test the potential moderating influence on survey mode of race (white versus non-white), sex, population density, census region, public/private school, first or second year of school participation, survey version and non-complete drug responses and (3) to compare levels of missing data across survey mode as measured by the percentage of respondents who completed all drug questions, the percentage of drug questions unanswered and the mean number of missing drug items among non-completers.
METHODS
Design
Data come from the 2019 Monitoring the Future (MTF) survey, a cross-sectional survey of 8th, 10th and 12th grade students that is nationally representative of the 48 coterminous states in the United States. It uses a multi-stage, stratified probability sampling procedure, in which stage 1 is the selection of geographical areas [US Metropolitan Statistical Areas (MSAs) or non-MSA counties], stage 2 is the selection of one or more middle (8th) or high (10th, 12th) schools in each area and stage 3 is the selection of students within each sampled school. The project was approved by the University of Michigan Health Sciences and Behavioral Sciences Institutional Review Board, approval no. HUM00131235. The MTF data are available for analysis at the National Addiction and HIV Data Archive Program [12].
Survey procedures
University of Michigan personnel conducted the questionnaire administration in each school, following standardized procedures detailed in a project instruction manual (available online File S1). The questionnaire administrations took place in classrooms during normal class periods whenever possible; however, circumstances in some schools required the use of larger group administrations [13]. Informed consent [passive or active (written), per school policy] was obtained from parents for students younger than 18 years and from students aged 18 years or older. Students were instructed to skip any questions they did not feel comfortable answering, and could change answers at any point (by erasing responses on paper-and-pencil surveys or going back and over-riding answers on tablets). All responses on tablets were encrypted and then transmitted to the University of Michigan at the first internet connection opportunity, which was typically immediately after survey completion. A University of Michigan staff member provided technical assistance for tablet users, including immediately replacing faulty tablets with replacements from a reserve.
Randomization procedure
Prior to randomization, the 2019 MTF sample was hierarchically sorted in the order of grade, first/second year of school participation of target schools (each school participates in the survey for 2 years), and then public/private status of the target school. Within each of these groups target schools were listed by the nine US Census divisions of the United States within four levels of urbanicity. For each of these ordered lists a random start was selected (tablet or paper) and mode assignment then alternated down the list. If a target school was not successfully recruited then its replacement inherited the original school’s survey mode assignment.
Participants
The final analysis pool consisted of 41866 students in 397 schools who answered at least one survey question on drug use. Within the sample of schools, response rates for eligible, enrolled students were 80% in 12th grade, 86% in 10th grade and 89% in 8th grade, with the great majority of non-responses due to student absence. Response rates did not significantly differ at the P < 0.05 level for tablet- and paper-assigned schools and were, respectively, 80.1 and 79.9% in 12th grade, 86.4 and 85.1% in 10th grade and 89.0 and 89.1% in 8th grade.
Measures
The analyses focus upon the same set of drug prevalence outcomes that are presented in the MTF annual volumes [14]. These comprise a total of 377 drug use prevalence estimates across reporting intervals and grades. These include 90 life-time use estimates, with 32 in 12th grade and 29 in each of 10th and 8th grade, 127 estimates of past 12-month use, with 49 in 12th grade and 39 in each of 10th and 8th grade, 108 estimates of past 30-day use, with 38 in 12th grade and 35 in each of 10th and 8th grade, as well as 52 estimates of heavy use, with 30 in 12th grade and 11 in each of 10th and 8th grade.
All measures, including the project’s 377 drug prevalence outcomes, are described in detail in the project’s annual reports and documentation [13,14].
Sample size varies across substances. MTF uses multiple questionnaire versions or ‘forms’ that include form-specific questions as well as a core set of questions that appear on all forms. Six different forms are used in 12th grade and four are used for the 10th and 8th grade samples. This procedure increases the number of questions that the survey can include and therefore the scope of the issues and substances covered. Each form is distributed to a randomly selected subset of respondents within schools, so that responses to each specific form and each covered substance are nationally representative. Supporting information Table S1 details the number of forms used to assess each drug.
Non-drug measures include self-identified white or non-white race, as measured by students who selected ‘white (Caucasian)’ for the question: ‘How to you describe yourself ‘, out of a list of nine race/ethnicity options. Female was indicated by a response of ‘female’ to the question: ‘What is your sex?’. Population density was coded trichotomously as schools located in one of the 24 largest US metropolitan statistical areas (MSA), a smaller MSA or outside an MSA (e.g. a rural area). Other measures include whether the school was in its first or second year of participation, census region of the country (South, Northeast, Midwest or West) and whether a school was public or private.
Statistical analysis
The analytical plan consists of three parts. First, the analyses used Poisson regression models [15] to examine whether the rate (proportion) of total number of ‘yes’ responses to the drug questions for each student was higher among those who recorded their survey answers on electronic tablets compared to paper. The fitted Poisson regression models were stratified by the reporting intervals of life-time, past 12-month, past 30-day and heavy drug use. These models use the standard ‘exposure’ variable option in Poisson regression to take into account variation in the total number of non-missing responses provided by the students, which vary by reporting interval, per each version of the survey form, and individual student levels of non-response (assuming unanswered questions are missing completely at random). Additional analyses considered potential moderating effects on survey mode using multiplicative interaction terms. Secondly, the analysis estimated proportions and means to compare levels of item missing data across tablet and paper modes. Finally, for each of the 377 drug prevalence outcomes the analyses present prevalence and standard error estimates for tablet-based, paper-based and combined student responses, and also indicate whether the relative risk (RR) by survey mode of reported use of the substance differs significantly from RR = 1.0 at the P < 0.05 level for a two-tailed test using a generalized linear regression model with a log link.
These analyses were not pre-registered on a publicly available platform, and results should be considered exploratory.
All analyses account for the survey’s complex sample design using the ‘svy:’ suite of commands in Stata. These commands use probability weights that generalize estimates to the US national level. The Stata svy: commands provide robust estimates of standard errors of descriptive estimates and model parameters that reflect the combined effects of all levels of clustering (non-independence) of the nested sampling of students within schools and geographical areas. This population-averaged approach [16] to modeling the mode-specific relative risk of substance use reporting was chosen over the alternative generalized multi-level modeling approach [17] because the study aims focused on estimates (and confidence intervals) for the fixed effects of survey mode and not on the random effects/components of variance associated with each specific stage of the data collection design. Results from models without probability weights differed only negligibly from weighted results and supported the same main conclusions (analyses not shown).
RESULTS
Figure 1 presents the study flow-chart. Before data collection began, the survey’s 368 target school slots were randomly assigned to tablet or paper survey administration. The project successfully recruited and surveyed a school in 89% of these slots, of which 165 were tablet administrations and 163 were paper administrations. The final analysis pool consisted of 20985 students who recorded their survey answers on tablets and 20881 who recorded their answers on paper-and-pencil. These sample sizes exclude the 1.5% of students who did not answer any of the drug use questions on the survey, a percentage that did not significantly differ by survey mode at the P < 0.05 level.
Figure 1.
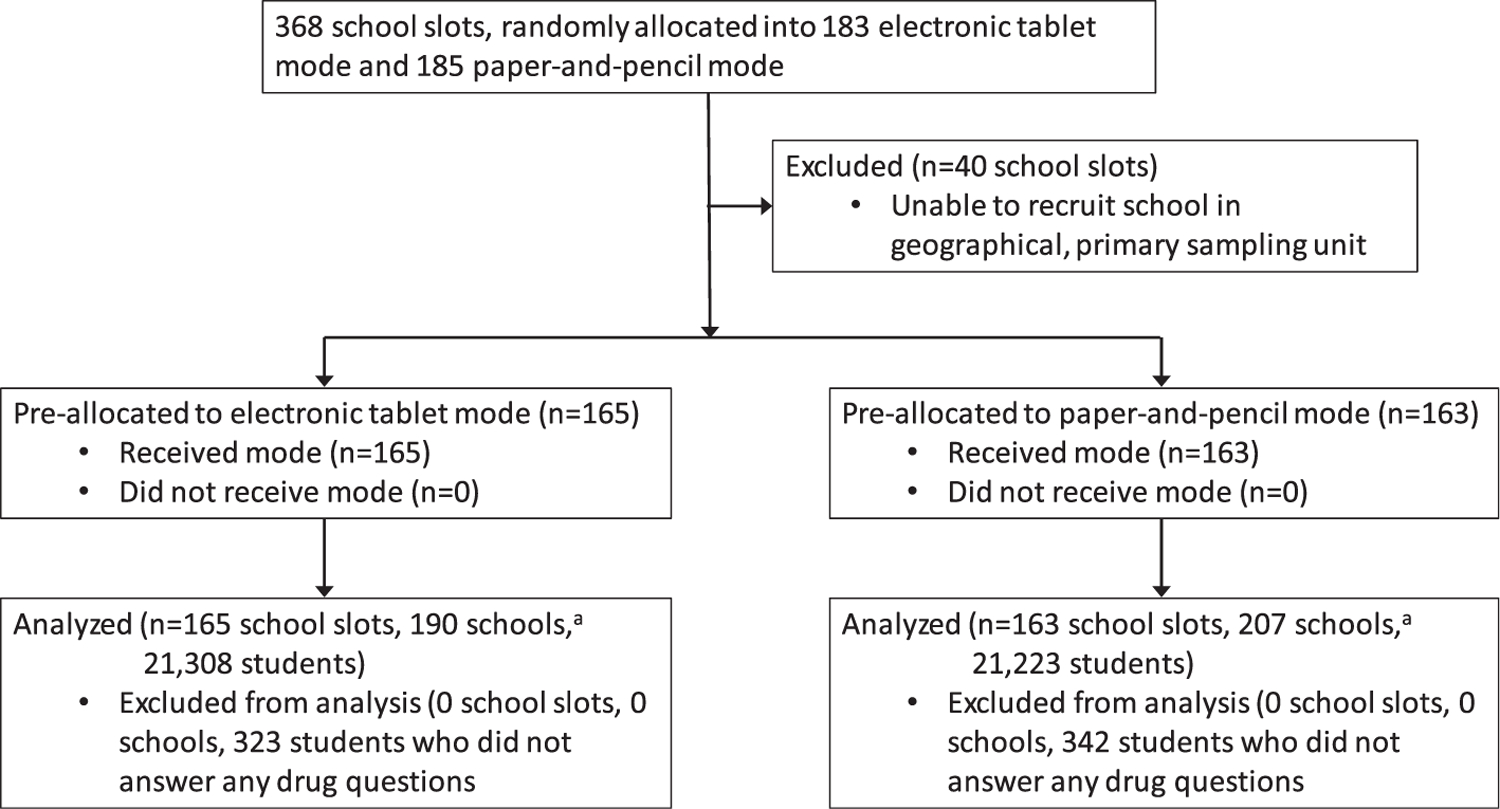
Study flow-chart.aMore than one school was surveyed in some school slots in order to meet project requirements for minimum number of students surveyed. All schools within the same school slot were surveyed using the same pre-assigned survey mode (i.e. tablet or paper-and-pencil)
Table 1 presents detailed information on the distribution of the school slots by survey mode. In each of the three grades the percentage of surveyed school slots assigned to tablets ranged between 49 and 51%. Survey mode was distributed between the range of 45–58% for the stratification factors of first/second year of school participation, public/private school and US Census region of the country.
Table 1.
Number of target and survey school slots, by selected characteristics (% tablet mode in parentheses).
| 8th grade | 10th grade | 12th grade | |
|---|---|---|---|
| Target sample | |||
| School slots | 140 (49%) | 114 (50%) | 114 (50%) |
| Surveyed sample | |||
| School slots | 124 (51%) | 102 (49%) | 102 (51%) |
| Stratification factors for randomization | |||
| First-year schools, n | 49 (49%) | 47 (51%) | 48 (50%) |
| Second-year schools, n | 75 (52%) | 55 (47%) | 54 (52%) |
| Public, n | 103 (50%) | 86 (49%) | 88 (50%) |
| Private, n | 21 (52%) | 16 (50%) | 14 (57%) |
| South | 42 (55%) | 33 (52%) | 36 (47%) |
| Northeast | 29 (45%) | 22 (45%) | 20 (50%) |
| Midwest | 31 (48%) | 26 (50%) | 26 (58%) |
| West | 22 (55%) | 21 (48%) | 20 (50%) |
Table 2 presents demographic characteristics of the student sample and the percentage of each demographic group that conducted the survey on tablets. The percentage of tablet administrations ranged between 45 and 57% for sex, race (white versus non-white) and population density of the area in which the school was located.
Table 2.
Demographic characteristics of sample (% tablet mode in parentheses).
| 8th grade | 10th grade | 12th grade | |
|---|---|---|---|
| % Female | 50 (52%) | 52 (50%) | 51 (54%) |
| % Male | 50 (53%) | 48 (51%) | 49 (55%) |
| % White, non-Hispanic | 47 (48%) | 47 (56%) | 52 (49%) |
| % Non-white | 53 (55%) | 53 (45%) | 48 (57%) |
| % Large metropolitan statistical area | 32 (43%) | 31 (43%) | 33 (50%) |
| % Medium metropolitan statistical area | 50 (54%) | 51 (56%) | 48 (54%) |
| % Non-metropolitan statistical area | 19 (57%) | 18 (45%) | 19 (53%) |
| Number of schoolsa | 143 (49%) | 126 (46%) | 128 (46%) |
| Total number of respondentsb | 14032 (51%) | 14439 (50%) | 13395 (53%) |
More than one school was surveyed in some school slots in order to meet project requirements for minimum number of students surveyed. All schools within a school slot were surveyed using the same pre-assigned survey mode (i.e. tablet or paper-and-pencil).
Number of respondents slightly smaller for sex and race samples due to missing responses. Number of respondents with non-missing values for sex in 8th, 10th and 12th grades was 13495, 14044 and 12644, respectively. Number of respondents with non-missing values for race was 13368, 14022 and 12828, respectively. The total number of students reported here does not exclude the 1.5% who did not answer any drug questions.
Table 3 presents the RR of prevalence estimates by survey mode as estimated using Poisson regression models. For all reporting periods the direction of the RR was for higher estimates on tablets, although differences were small, and for all reporting intervals the 95% confidence interval of the relative risk included one. Specifically, the relative risk favoring tablets for life-time use was 1.03, for past 12-month use was 1.01, for past 30-day use was 1.05 and for heavy use was 1.10.
Table 3.
Relative risk for drug use by reporting interval, results from Poisson regression (95% confidence intervals in parentheses).
| Life-time (n = 41839) | Past 12 months (n = 41720) | Past 30 days (n = 41843) | Heavy use (n = 41764) | |
|---|---|---|---|---|
| Tablet versus paper mode | 1.03 | 1.01 | 1.05 | 1.10 |
| (0.93–1.14) | (0.91–1.11) | (0.93–1.20) | (0.93–1.29) |
The analysis tested the possibility that socio-demographic characteristics may have moderated the size of a tablet mode effect (analyses not shown). These analyses consisted of separate Poisson regression models that included indicator variables for the demographic characteristics of interest, tablet mode and their multiplicative interaction. Each of these separate models was run for each of the four reporting intervals. No significant interaction with survey mode was present for race (white versus non-white), the four-category US Census region of the country or population density. Tablet mode did significantly interact with sex for analyses of life-time, past 12-month and past 30-day drug use and indicated smaller differences by survey mode for females; however, in models run separately by sex there was no significant difference at the P < 0.05 level by survey mode for females or for males in any reporting interval.
In addition, no interactions with survey mode were significant at the P < 0.05 level for public/private school status or for first/second-year status of school participation in the survey. No interactions with survey mode were present for any of the 10 separate versions, or ‘forms’, of the survey questionnaire (six in 12th grade and four for the 10th and 8th grade samples) in any of the four reporting intervals. The analyses also examined whether an indicator for missing information on at least one drug question significantly interacted with survey mode and found that it did not for any of the reporting intervals.
Table 4 presents information on levels of item missing data across survey mode. Tablet compared to paper mode had significantly lower levels of item missing data. For all four response categories combined the percentage of students who answered all the drug questions on their survey was 80% for tablets and 68% for paper. The percentage of unanswered drug questions was 3% on tablets and 6% for paper. The mean number of missing drug questions among students who did not answer all the drug questions was 13 for tablets and 17 for paper. Table 4 shows that tablets compared to paper have lower levels of missing data for all these measures in each of four reporting intervals. Supporting information Table S1 presents all 377 nationally representative drug prevalence estimates calculated using (a) tablet-based responses, (b) paper-and-pencil responses and (c) responses combined across the two modes. Acknowledging that individual responses to specific substance use questions may be highly correlated, we note that in independent t-tests, the estimates significantly differed by survey mode at the P < 0.05 level for 21 outcomes, of which 18 estimates were higher for tablets and the other three were higher for paper-and-pencil. The finding of 21 significant differences amounts to 5.6% of the 377 outcomes. This may be explained by chance alone, but given the non-independence of the estimates, the primary conclusions in this paper are based on the regression modeling that takes into account the covariance of the drug reports and other sources of non-independence in the study design and measurements.
Table 4.
Measures of non-response on survey items by mode.
| Tablet |
Paper |
|||
|---|---|---|---|---|
| Estimate | 95% CI | Estimate | 95% CI | |
| Overall | ||||
| % Completed all drug questions a | 79.64 | (78.19–81.02) | 67.99 | (65.92–70.00) |
| Percentage of drug questions unanswered | 2.86 | (2.52–3.20) | 6.26 | (5.59–6.92) |
| Mean no. of missing drug items among non-completers | 12.56 | (11.58–13.54) | 17.28 | (16.14–18.41) |
| Life-time use | ||||
| % Completed all drug questions a | 83.88 | (82.54–85.14) | 73.63 | (71.66–75.52) |
| Percentage of drug questions unanswered | 2.44 | (2.15–2.73) | 5.52 | (4.91–6.14) |
| Mean no. of drug items missing among non-completers | 3.52 | (3.27–3.76) | 4.86 | (4.54–5.17) |
| Past 12-month use | ||||
| % Completed all drug questions a | 82.80 | (81.46–84.07) | 73.01 | (71.14–74.80 |
| Percentage of drug questions unanswered | 3.12 | (2.70–3.54) | 6.46 | (5.78–7.13) |
| Mean no. of missing drug items among non-completers | 5.12 | (4.68–5.55) | 6.63 | (6.26–7.00) |
| Past 30-day use | ||||
| % Completed all drug questions a | 83.38 | (82.06–84.62) | 72.09 | (70.09–74.00) |
| Percentage of drug questions unanswered | 2.54 | (2.23–2.85) | 5.89 | (5.25–6.53) |
| Mean no. of missing drug items among non-completers | 3.83 | (3.55–4.12) | 5.28 | (4.96–5.60) |
| Heavy use | ||||
| % Completed all drug questions a | 86.02 | (84.83–87.13) | 77.59 | (75.84–79.25) |
| Percentage of drug questions unanswered | 3.15 | (2.83–3.47) | 6.20 | (5.61–6.78) |
| Mean no. of missing drug item among non-completers | 2.88 | (2.67–3.09) | 3.55 | (3.30–3.80) |
Sample size = 41866 for overall analyses, 41839 for life-time analyses, 41720 for past 12-month analyses, 41843 for past 30-day analyses and 41819 for analyses of heavy use. All comparisons across table and paper are statistically significant at the 0.05 level, as indicated by non-overlapping 95% confidence intervals.
Total number of drug questions varies across different versions of the survey questionnaire.
CI = confidence interval.
DISCUSSION
This study set out to examine if the transition to data collection by electronic tablets from traditional paper-and-pencil surveys would produce a mode effect and consequent discontinuity in trends for nationally representative estimates of adolescent drug use prevalence. Analyses are based on a randomized controlled experiment, in which students in a randomly selected half of schools recorded their survey answers on electronic tablets and in the other half of schools used paper-and-pencil. To our knowledge, this is the largest study of this type, and the first with a nationally representative sample.
The results support two major findings. First, differences in prevalence estimates were small across survey mode for the four reporting intervals of life-time, past 12-month, past 30-day and heavy drug use. The results are consistent with the existing literature, which led to the expectation of slightly higher prevalence levels for tablets compared to paper. A contribution of this study is to show that this effect is quite small and probably has little to no effect on population prevalence or trend estimates.
A second major finding is that students using electronic tablets had significantly lower levels of missing data than did those using traditional paper and pencil. For all four reporting intervals the percentage of students who answered all the drug questions on their survey form was higher than 80% for tablet-based responses and approximately 10 percentage points lower for paper-based responses. In addition, among students who did not answer all the drug questions on their survey, those who used tablets compared to paper had fewer missing responses for all four reporting intervals. We suspect that tablets have higher completion rates and lower missing data levels because answering questions on touchscreens takes less time and is perceived as more confidential than bubbling answers on paper-and-pencil optical scan sheets. These results indicate higher data quality for tablet compared to paper administrations, an advantage for tablets in addition to their potential to collect paradata [18–20], and also to include skip patterns that allow in-depth questions for sub-populations of specific theoretical or policy interest.
We draw two main conclusions from these results. First, any discontinuity in time trends introduced by a transition of an adolescent drug study to tablets from paper-and-pencil is expected to be negligible. This is a major consideration for many countries that are considering a transition to tablet data collection for their adolescent drug use surveillance systems. Of the many factors considered in the decision to transition to tablets, the loss of direct comparisons of prevalence estimates with previous years would be a major drawback. Such a loss would be particularly detrimental for analysis and policy formulation related to any drug prevalence that is changing rapidly, such as teen vaping in the United States [21,22].
This conclusion applies not only to future transitions to tablet data collection but also to ones that have recently taken place. For the few school-based adolescent drug surveillance systems that have already made the transition to tablets without a full-scale comparison with paper, these results provide a scientific rationale for direct comparison of tablet-based results with previous findings based on traditional paper and pencil [23].
A second, related conclusion is that tablet and paper modes would be expected to be largely interchangeable for school-based drug studies of adolescents. Countries that wish to transition to tablet data collection for adolescent drug surveillance may not be able to use tablets in all schools because of factors such as shipping logistics for remote regions or security issues related to bringing in valuable electronic equipment to dangerous neighborhoods. The results from this study suggest potentially high scientific validity for a hybrid study that uses electronic tablets for data collection where possible and paper surveys otherwise.
It is important to note caveats and limitations of this study. First, the finding of little to no survey mode effects for drug prevalence may not apply to other outcomes such as attitudes and beliefs, which this study did not analyze. Secondly, this study is limited to one country. Applicability of this study’s findings to other nations would be bolstered by country-specific analyses also showing no survey mode effect; framed as confirmatory studies, such analyses would not necessarily need to be as large or as widely representative as this one. A third, related caveat is that studies of specific US geographical regions and racial/ethnic groups are warranted to examine the extent to which these nationally representative results apply. Finally, the results of this study do not include students who were unable to complete self-reported questionnaires as a result of low English proficiency or physical, sensory or reading disabilities.
CONCLUSION
This randomly controlled study found only very small differences across electronic tablet versus paper-and-pencil survey modes for school-based, nationally representative estimates of adolescent drug prevalence. These results suggest that a transition to tablet-based surveys will not preclude direct comparison of drug prevalence results collected with paper and pencil. They also provide scientific justification for large drug surveillance projects to use both paper-and-pencil and tablet surveys, which may be required in some countries if shipping tablets to remote regions is infeasible or the use of electronic tablets raises security issues.
Supplementary Material
File S1. Supporting information.
Table S1. Prevalence of Selected Substances Overall and by Mode (Standard Errors in Parentheses).
Acknowledgements
This project funded by the National Institute on Drug Abuse, part of the US National Institutes of Health, by grant no. DA001411. We thank John Haeussler, the project’s sampling statistician, who designed and oversaw the study’s randomization procedure. We also thank Virginia Laetz, who oversaw all data collection for this project and carried through the randomization procedures.
Footnotes
Declaration of interests
None.
Supporting Information
Additional supporting information may be found online in the Supporting Information section at the end of the article.
References
- 1.Ahumada G, Arneda JC, Clarke P, Cumsille F, Hynes M Report on Drug Use in the Americas 2019. Washington, DC: Inter-American Drug Abuse Control Commission (CICAD), Organization of American States (OAS); 2019. [Google Scholar]
- 2.Kraus L, Nociar A ESPAD report 2015: results from the European School Survey Project On Alcohol and Other Drugs. Lisbon: European Monitoring Centre for Drugs and Drug Addiction; 2016. [Google Scholar]
- 3.Tourangeau R, Rasinski K, Jobe JB, Smith TW, Pratt WF Sources of error in a survey on sexual behavior. J Off Statis Stock 1997; 13: 341–66. [Google Scholar]
- 4.Turner CF, Ku L, Rogers SM, Lindberg LD, Pleck JH, Sonenstein FL Adolescent sexual behavior, drug use, and violence: increased reporting with computer survey technology. Science 1998; 280: 867–73. [DOI] [PubMed] [Google Scholar]
- 5.Aquilino WS, Wright DL, Supple AJ Response effects due to bystander presence in CASI and paper-and-pencil surveys of drug use and alcohol use. Subst Use Misuse 2000; 35: 845–67. [DOI] [PubMed] [Google Scholar]
- 6.Couper MP, Tourangeau R, Marvin T Taking the audio out of audio-CASI. Public Opin Q 2009; 73: 281–303. [Google Scholar]
- 7.Gnambs T, Kaspar K Disclosure of sensitive behaviors across self-administered survey modes: a meta-analysis. Behav Res Methods 2015; 47: 1237–59. [DOI] [PubMed] [Google Scholar]
- 8.Gomes HS, Farrington DP, Maia Â, Krohn MD Measurement bias in self-reports of offending: a systematic review of experiments. J Exper Crim 2019; 15: 313–39. [Google Scholar]
- 9.Baier D Computer-assisted versus paper-and-pencil self-report delinquency surveys: results of an experimental study. Eur J Crim 2018; 15: 385–402. [Google Scholar]
- 10.Lucia S, Herrmann L, Killias M How important are interview methods and questionnaire designs in research on self-reported juvenile delinquency? An experimental comparison of internet vs paper-and-pencil questionnaires and different definitions of the reference period. J Exper Crim 2007; 3: 39–64. [Google Scholar]
- 11.Hallfors D, Khatapoush S, Kadushin C, Watson K, Saxe L A comparison of paper vs computer-assisted self interview for school alcohol, tobacco, and other drug surveys. Eval Program Plann 2000; 23: 149–55. [Google Scholar]
- 12.University of Michigan. National Addiction and HIV Data Archive Program. Ann Arbor, MI: Institute for Social Research, University of Michigan; 2019. [Google Scholar]
- 13.Bachman JG, Johnston LD, O’Malley PM, Schulenberg JE, Miech RA The Monitoring the Future Project after Four Decades: Design and Procedures. Occasional Paper #82. Ann Arbor, MI: Institute for Social Research; 2015. [Google Scholar]
- 14.Miech RA, Johnston L, O’Malley PM, Bachman JG, Schulenberg JE, Patrick ME Monitoring the Future National Survey Results on Drug Use, 1975–2019: Volume I, Secondary School Students. Ann Arbor, MI: Institute for Social Research; 2020. [Google Scholar]
- 15.Winkelman R Poisson Regression. Econometric Analysis of Count Data, 5th edn. Berlin: Springer; 2008, pp. 63–126. [Google Scholar]
- 16.Heeringa SG, West BT, Berglund PA Applied Survey Data Analysis, 2nd edn. Boca Raton, FL: Chapman & Hall/CRC; 2017. [Google Scholar]
- 17.Snijders TA, Bosker RJ Multilevel Analysis: An Introduction to Basic and Advanced Multilevel Modeling. Thousand Oaks, CA: Sage; 2011. [Google Scholar]
- 18.Couper MP, Kreuter F Using paradata to explore item level response times in surveys. J R Stat Soc A Stat Soc 2013; 176: 271–86. [Google Scholar]
- 19.McClain CA, Couper MP, Hupp AL, Keusch F, Peterson G, Piskorowski AD et al. A typology of web survey paradata for assessing total survey error. Soc Sci Comput Rev 2019; 37: 196–213. [Google Scholar]
- 20.Kreuter F Improving Surveys with Paradata: Analytic Uses of Process Information. Hoboken, NJ: John Wiley & Sons; 2013. [Google Scholar]
- 21.Miech RA, Johnston L, O’Malley PM, Bachman JG, Patrick ME Trends in adolescent vaping from 2017 to 2019—U.S. National Estimate. N Eng J Med 2019; 381: 1490–1. [DOI] [PMC free article] [PubMed] [Google Scholar]
- 22.Miech RA, Patrick ME, O’Malley PM, Johnston LD, Bachman JG Trends in reported marijuana vaping among U.S. adolescents, 2017–2019. JAMA 2019; 323: 475–6. [DOI] [PMC free article] [PubMed] [Google Scholar]
- 23.Cullen KA, Gentzke AS, Sawdey MD, Chang JT, Anic GM, Wang TW et al. E-cigarette use among youth in the United States, 2019. JAMA 2019; 322: 2095–103. [DOI] [PMC free article] [PubMed] [Google Scholar]
Associated Data
This section collects any data citations, data availability statements, or supplementary materials included in this article.
Supplementary Materials
File S1. Supporting information.
Table S1. Prevalence of Selected Substances Overall and by Mode (Standard Errors in Parentheses).