Abstract
Abstract
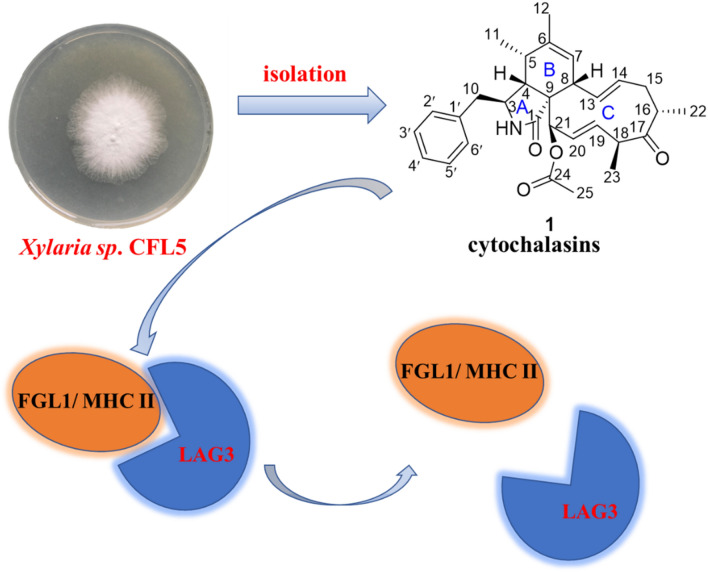
Three previously undescribed cytochalasins, named xylariasins A‒C (1‒3), together with six known ones (4‒9) were isolated from Xylaria sp. CFL5, an endophytic fungus of Cephalotaxus fortunei. The chemical structures of all new compounds were elucidated on the basis of extensive spectroscopic data analyses and electronic circular dichroism calculation, as well as optical rotation calculation. Biological activities of compounds 1, 4‒9 were evaluated, including cytotoxic, LAG3/MHC II binding inhibition and LAG3/FGL1 binding inhibition activities. Compounds 6 and 9 possessed cytotoxicity against AGS cells at 5 μM, with inhibition rates of 94% and 64%, respectively. In addition, all tested isolates, except compound 6, exhibited obvious inhibitory activity against the interaction of both LAG3/MHC II and LAG3/FGL1. Compounds 1, 5, 7, and 8 inhibited LAG3/MHC II with IC50 values ranging from 2.37 to 4.74 μM. Meanwhile, the IC50 values of compounds 1, 7, and 8 against LAG3/FGL1 were 11.78, 4.39, and 7.45 μM, respectively.
Graphic Abstract
Electronic supplementary material
The online version of this article (10.1007/s13659-020-00279-5) contains supplementary material, which is available to authorized users.
Keywords: Cytochalasin, Xylaria sp., Cephalotaxus fortunei, LAG3/MHC II binding inhibition, LAG3/FGL1 binding inhibition
Introduction
Cytochalasins, a family of fungal metabolites, represented the hybrid formed by a phenylalanine and a polyketide moiety, which possessed unique chemical structures and various biological activities [1, 2]. It was reported that phenylalanine-derived cytochalasans were mostly isolated from the fungi of genera including Xylaria [3], Phomopsis [4], Phoma [5], Arthrinium [6], Aspergillus [7, 8]. Biological studies have revealed these compounds occupied antibacterial [9], cytotoxic [10], anti-HIV [8], phytotoxic [3], and NO inhibitory activities [11].
Xylaria was the largest genus of the family Xylariaceae, and members were widespread on the earth [12]. In the traditional view for this genus, they were saprotrophic fungi usually appeared on deadwood, participated in the decomposition of organic waste, even destructed the growth of plants. Since the fact that members of this genus occur ubiquitously as endophytes of vascular plant has been illuminated, not only Xylaria, but the entire Xylariaceae seemed to play an important role in ecology [13]. Previous phytochemical studies on the secondary metabolites of Xylaria resulted in the discovery of various compounds with several distinct types of several bioactivities, such as cytochalasin E with phytotoxicity [14] and nigriterpene C possessing anti-inflammatory effects [15], which highlighted the potential of the fungi from this genus as rich sources of natural products with novel chemical structures and valuable bioactivities.
Harringtonin and homobarringtonie from Cephalotaxus fortunei had been made numerous biological activity evaluation and formal syntheses works in the past several years [16–18], which also attracted our interests to the secondary metabolites of the endophytic fungi from this plant. A strain of Xylaria sp. CFL5 from C. fortunei was incubated in rice mediums, a phytochemical investigation resulted in the discovery of nine cytochalasins (1‒9). After comprehensive structural characterization, including spectroscopic analysis, calculated optical rotation, and calculated electronic circular dichroism, xylariasins A‒C (1‒3) were identified to possess undescribed structures.
LAG3 (Lymphocyte-activation gene 3) was mainly expressed in activated T and natural killer (NK) cells and was identified as a marker for the activation of CD4+ and CD8+ T cells [19, 20]. After bound with the cognate ligands, it could be activated to inhibit the proliferation and activation of CD4+ and CD8+ T cells, enhance the inhibitory activity of regulatory T cells (Treg), and thereby promote the immune escape of tumor cells [21]. MHC II (major histocompatibility complex II) was was believed to be a typical ligand of LAG3 in a long time [22, 23]. However, whether MHC II solely involved in the inhibitory effects of LAG3 or not was controversial. Research workers evidenced that FGL1, a secreted protein from liver cells, was a new LAG3 functional ligand independent of MHC II in 2018 [24]. The discovery revealed a novel immune escape mechanism and provided a guidance for the design of cancer immunotherapy. Collectively, drugs acting on the pathways of either LAG3/MHC II or LAG3/FGL1 could play a role in the cancer therapy. There were only 30 anti-LAG3 monoclonal antibodies in research and few small molecule inhibitors reported [25, 26]. It could provide new lead compounds for cancer immunotherapy and improve the cure rate of cancer through the development of small molecule inhibitors that inhibit the binding of LAG3 with MHC II and the binding of LAG3 with FGL1. For these causes, we evaluated the inhibitory effects of cytochalasins (1, 4‒9) from Xylaria sp. CFL5 on the interactions of LAG3/MHC II and LAG3/FGL1. The results showed that most isolates, except 6, exhibited obvious inhibitory activity against the interaction of both LAG3/MHC II and LAG3/FGL1. More specifically, 1, 5, 7, and 8 inhibited LAG3/MHC II with IC50 values ranging from 2.37 to 4.74 μM, and the IC50 values of 1, 7, and 8 against LAG3/FGL1 were 11.78, 4.39, and 7.45 μM, respectively. This was the first report of cytochalasins exhibiting the inhibitory activity against the interaction of LAG3 and MHC II, or LAG3 and FGL1, which underscored the potential of cytochalasin derivatives as anticancer immunosuppressants.
Results and Discussion
Isolation and Structure Elucidation
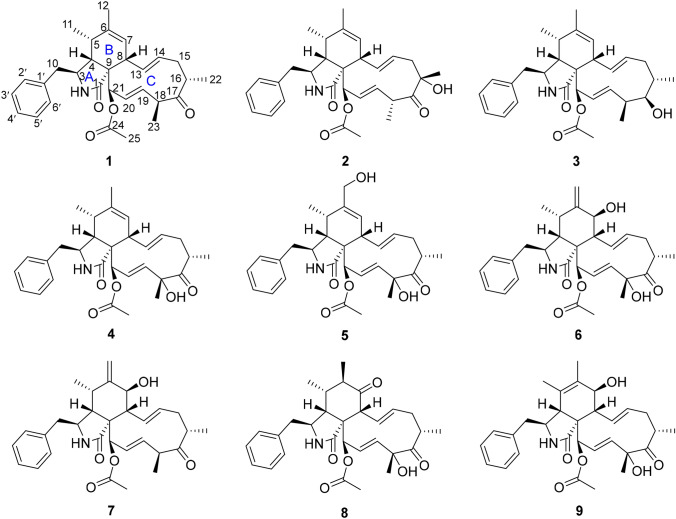
The strain of Xylaria sp. CFL5 was inoculated on rice mediums and cultured at 28 °C for 20 days. Utilizing macroporous resin HP-20, silica gel column chromatography, and semi-preparative HPLC, the investigation of the EtOAc extract of the mediums provided three new (1‒3) and six published (4‒9) cytochalasins (Fig. 1). The structures and stereochemistry of these isolates were elucidated on the basis of spectroscopic analysis, optical rotation, and circular dichroism (CD) analysis and comparison with the data in the literature.
Fig. 1.
Structures of compounds 1–9
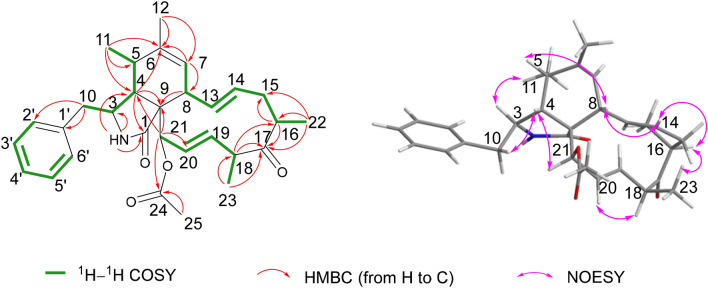
Compound 1 was isolated as a white powder. Its molecular formula was determined as C30H37NO4 according to an [M + H]+ ion peak at m/z 476.2793 (calcd 476.2795) in the HRESIMS spectrum, showing 13 indices of hydrogen deficiency (IOHDs). The characteristic absorptions at 1743 and 1703 cm−1 for carbonyl groups, as well as the bands at 3324 cm−1 for amino groups in its IR spectrum were observed. The 1H, 13C NMR, and HSQC spectra for compound 1 revealed three methyl doublets at (δH 1.10, J = 7.6 Hz; δC 14.2), (δH 1.15, J = 6.8 Hz; δC 19.1), and (δH 1.22, J = 7.2 Hz; δC 16.3), two methyl singlets at (δH 1.69; δC 19.9) and (δH 2.23; δC 20.9). The resonance signals in the 1H NMR at δH 7.12 (d, J = 6.8 Hz, 2H), 7.30 (t, J = 6.8 Hz, 2H), and 7.24 (m, 1H) disclosed that there was a monosubstituted phenyl moiety in the molecule, which was evidenced by the 13C NMR signals at δC 129.2 (2C), 129.0 (2C), 127.2 (1C), and 137.6 (1C). In addition, three pairs of double bands were also determined based on the signals at (δH 5.80, dd, J = 16.0 Hz, J = 10.0 Hz; δC 132.1), (δH 5.08, ddd, J = 15.2 Hz, J = 10.8 Hz, J = 4.4 Hz; δC 132.4), (δH 4.75, ddd, J = 16.0 Hz, J = 7.6 Hz, J = 2.4 Hz; δC 124.5), (δH 6.04, ddd, J = 16.0 Hz, J = 2.8 Hz, J = 1.2 Hz; δC 132.6), (δH 5.31, s; δC 127.7), and (δC 138.1) in the 1H and 13C NMR data. In conjunction with the 1D and 2D NMR data, the remaining carbon signals were designated two methylenes, six methines, an oxygenated tertiary carbon, a sp3 quarternary carbon, and three carbonyl groups. Unambiguously, these evidences exhibited that compound 1 was a cytochalasin derivative [4, 27]. The polyketide moiety of 1 was constructed on the basis of the 1H–1H COSY couplings of H-21/H-20/H-19/H-18/H-23 and H-7/H-8/H-13/H-14/H-15/H-16/H-22 and HMBC cross-peaks from H3-11 to C-5 and C-6, from H3-12 to C-6 and C-7, from H-7 to C-6 and C-8, from H-8 to C-9, from H-21 to C-1, C-9, and C-20, from H3-22 to C-15, C-16, and C-17, from H-16 to C-15 and C-17, from H3-23 to C-18 and C-17, and from H-18 to C-17 and C-16 (Fig. 2). The moiety of phenylalanine was established by the 1H–1H COSY couplings of H-2′/H-3′/H-4′/H-5′/H-6′ and HMBC cross-peaks from H-10 to C-1′, C-2′, C-3, and C-4, from H-4 to C-1 and C-9, and from H-21 to C-4 and C-9, from NH to C-1, C-3, and C-4, and from H-3 to C-1′ (Fig. 2). Ultimately, the linkage between these two moieties was deduced from the 1H–1H COSY correlations of H-11/H-5/H-4/H-3/H-10 and HMBC cross-peaks from NH to C-1 and C-9, from H-11 to C-4, and from H-4 to C-5 and C-6, as depicted in Figs. 1 and 2. The chemical shift of C-21 (δH 5.53, s; δC 77.2) and the HMBC cross-peaks of H-21 to C-24 and H3-25 to C-24 revealed that the acetyl group was connected to C-21. Herein, the planar structure of compound 1 was determined as depicted in Fig. 1.
Fig. 2.
Key 1H–1H COSY, HMBC, and NOESY correlations of compound 1
The relative configuration of compound 1 was determined by the NOESY experiment. The NOESY correlations of H-5/H-8, H3-11/H-3, H-4/H-10a suggested that H-8, H-4, and H2-10 were cofical and assigned as β orientation. Accordingly, H3-11 and H-3 were α oriented. The correlations of H-16 with H3-23, H-8 with H-14, H-14 with H-16, and H-4 with H-21 in the NOESY spectrum revealed that H3-22 and H-21 were α oriented, the configuration of C-9 was S*, H3-23 was β oriented, and the Δ13 double bond was E-configuration [27, 28]. The Δ19 double bond was E- configuration on the basis of the NOESY correlation of H-18 and H-20. Subsequently, these data confirmed the relative configuration of 1, which offered two possible stereo-structure candidates assembled as 1a (3S,4R,5S,8S,9S,16S,18S, 21R) and 1b (3R,4S,5R,8R,9R,16R,18R,21S). The ECD spectra of both 1a and 1b were calculated. The ECD values for 1a showed negative (212 nm and 308 nm) and positive (245 nm) cotton effects, the shape of which matched with that of the experimental curve (Fig. 3). Thus, the absolute configuration of compound 1 was determined as 3S,4R,5S,8S,9S,16S,18S,21R, and the name of xylariasin A was proposed for 1.
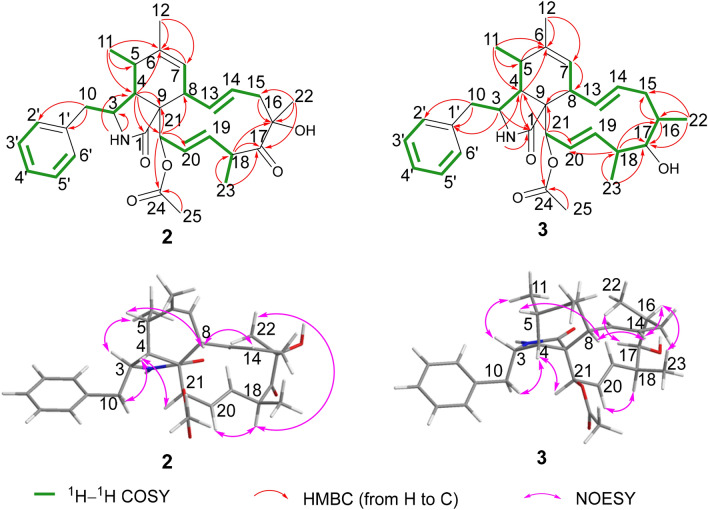
Fig. 3.
Key 1H–1H COSY, HMBC, and NOESY correlations of compounds 2 and 3
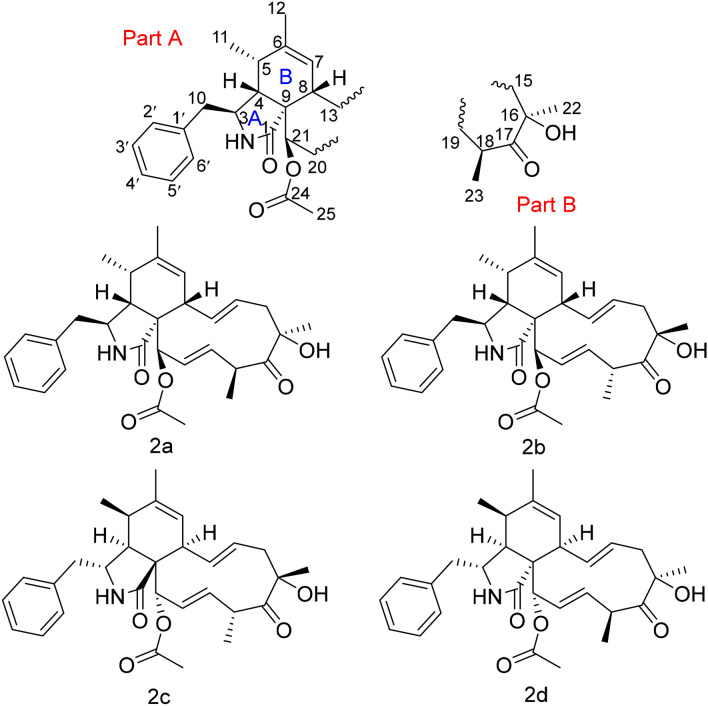
Compound 2, a coreless oil, which was evidenced to possess a molecular formula of C30H37NO5 from its ( +)-HRESIMS ion at m/z 492.2741 ([M + H]+, calcd for C30H38NO5 492.2744) and 13C NMR data, indicating the presence of 13 IOHDs. Absorption bands at 1740 and 1692 cm−1 (carbonyl groups), and 3456 and 3302 cm−1 (amino/hydroxyl groups) in the IR spectra were designated. The characteristic resonances included signals for a monosubstituted phenyl moiety at δH 7.12 (d, J = 6.8 Hz, 2H), 7.30 (t, J = 6.8 Hz, 2H), and 7.24 (m) and five methyl groups at δH 1.15 (d, J = 7.2 Hz), 1.19 (d, J = 6.8 Hz), 1.71 (s), 1.42 (s), and 2.21 (s), and olefinic and oxygenated protons at δH 5.25 (s), 6.18 (s), 4.94 (m), 4.98 (m), 6.21 (s), 5.49 (s), and 6.05 (s) in the 1H NMR spectrum. These data are reminiscent of compound 1, suggesting that compound 2 was a similar cytochalasin derivative. The main difference between these two compounds in the 1H NMR spectra was a methyl doublet in 1 became a methyl singlet in 2. Accordingly, the most obvious difference in their 13C NMR spectra was the absence of a methine carbon in 1 and the presence of an oxygenated tertiary carbon at δC 81.9 in 2. These data supported a hypothesis that there was a hydroxyl group connected to C-16, which was confirmed by the HMBC cross-peaks from H-15 to C-16, from H3-22 to C-15, C-16, and C-17, and from H-18 to C-16 and C-17. Thus, the planar structure of compound 2 was demonstrated as Fig. 4. The NOESY correlations of H-5/H-8, H-3/H3-11, H-4/H-10, and H-4/H-21 revealed these protons possessed the same relative configurations with those of compound 1, which was demonstrated as part A in Fig. 5. The NOESY correlations of H-8/H-14 and H-20/H-18 revealed the Δ13 and Δ19 double bonds were E-configuration. The correlation between H3-22 and H-18 in the NOESY spectrum revealed that H3-22 and H3-23 were located on the opposite side, described as part B in Fig. 5. However, H-16 in 1 was replaced by a hydroxyl group in compound 2, resulting in the absence of NOESY resonance signal of H-14/H-16. The relative configurations of part A and part B cannot be coordinated based on the NOESY correlations, which gave two possibilities depicted as 2a and 2b in Fig. 5. Accordingly, four possible enantiomers 2a‒2d (Fig. 5) were inferred to comprise the absolute configuration of 2.
Fig. 4.
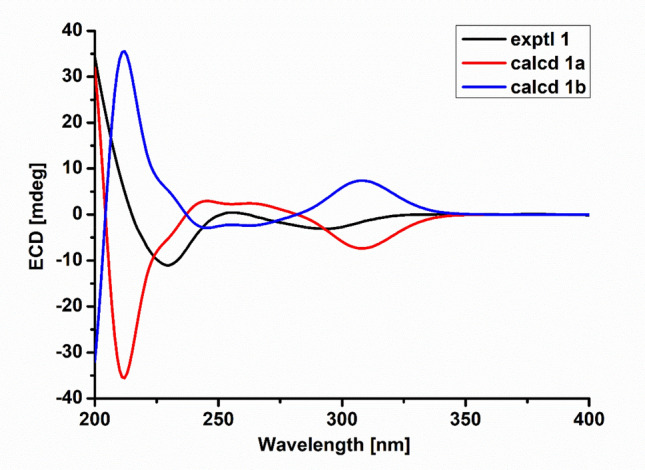
ECD spectra of compound 1 (solvent: CH3OH)
Fig. 5.
The probable absolute configuration for compound 2
The ECD spectra of 2a‒2d were calculated through the density functional theory (DFT) optimization at the level of b3lyp/6-31 g(d,p). The calculated ECD values of (3S,4R,5S,8S,9S,16S,18R,21R)-2 (2b) exhibited good agreement with the experimental ECD values of 2 (Fig. 6), indicating 2 was 3S,4R,5S,8S,9S,16S,18R,21R. Accordingly, the calculated optical rotation for 2b was + 9.55, which was closer to the experimental data of 2 ( = + 13.559), supporting the absolute configuration of 2. Compound 2 was determined as depicted in Fig. 1 and defined as xylariasin B. The hydroxyl substituent at C-16 in cytochalasins was rare, and compound 2 was the first example, which indicated that there may be an oxidase responsible for hydroxylation of C-16 in the biosynthesis pathway.
Fig. 6.
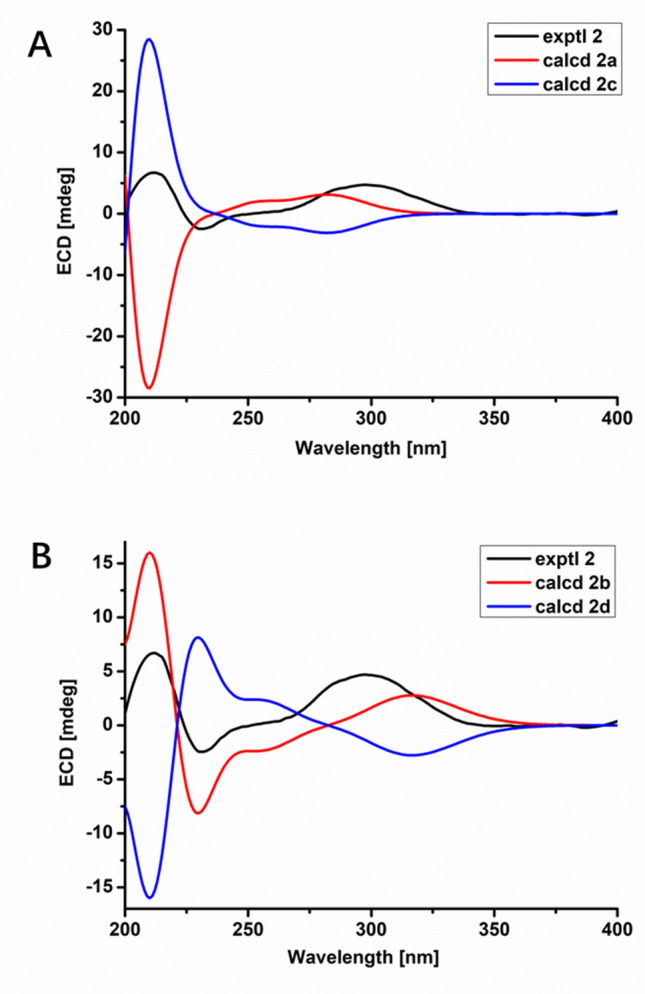
ECD spectra of compound 2 (solvent: CH3OH)
Compound 3, a white powder, had a molecular formula of C30H39NO4, requiring 12 IOHDs, which was established by the 13C NMR data and a sodium adduct ion peak at m/z 500.2768 ([M + Na]+, calcd 500.2771) in the HRESIMS spectrum. Inspection of the 1H NMR spectrum with that of compound 1 suggested that they were analogues. The major difference was that there was an additional oxygenated methine proton at δH 3.79 in compound 3. Correspondingly, an oxygenated methine carbon replacing the carbonyl group was observed in the 13C NMR spectrum of compound 3. These data gave a deduction that the carbonyl group at C-17 was changed to a hydroxyl group, in agreement with the fact that compound 3 possessed a less IOHD than compound 1. This assumption was subsequently supported by the key 1H–1H COSY correlations and the key HMBC correlations as depicted in Fig. 3. The NOESY correlation of H-17 with H3-22 suggested that H-17 was α-oriented, in conjunction with the same NOESY correlations of compound 3 as those of compound 1, which gave two possibilities for the absolute configuration of compound 3, assigned as 3a (3S,4R,5S,8S,9S,16S,17R,18S,21R) and 3b (3R,4S,5R,8R, 9R,16R,17R,18R,21S). The ECD curve of 3a was consistent with that of experimental curve (Fig. 7), evidencing the absolute configuration of 3 was 3S, 4R, 5S, 8S, 9S, 16S, 17R, 18S, 21R. Further experimental specific rotation for compound 3 was − 20.883, approximating that of compound 1 ( = − 18.853), which unambiguously certified the absolute configuration of 3. Thus, the structure of compound 3 was demonstrated in Fig. 1 and named xylariasin C.
Fig. 7.
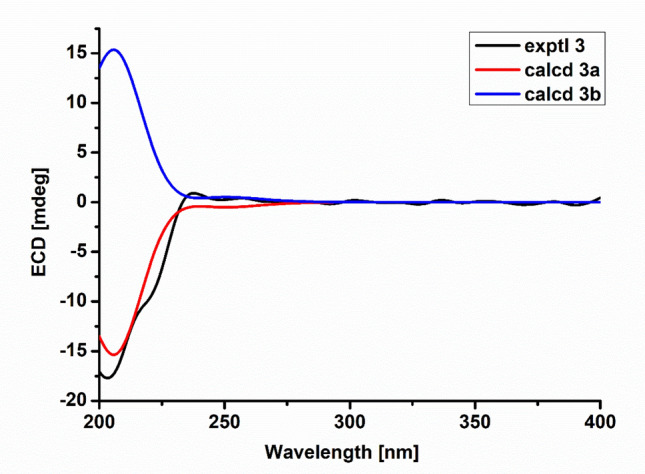
ECD spectra of compound 3 (solvent: CH3OH)
By comparison with the published 1H and 13C NMR data, the six known cytochalasins were identified as zygosporin G (4) [29],12-hydroxyl zygosporin G (5) [30], cytochalasin D (6) [30, 31], zygosporin E (7) [30], compound 10 (8) [32], and cytochalasin C (9) [33].
Expect xylarasins B (2) and C (3), the cytotoxicity, LAG3/MHC II inhibition activity, and LAG3/FGL1 inhibition activity of all isolates were tested.
Cytotoxic Activity
Cytochalasin D (6) and cytochalasin C (9) exhibited strong cytotoxic activity against AGS cells. At a concentration of 5 μM, cytochalasin D (6) and cytochalasin C (9) possessed inhibition rates of 94% and 64%, respectively.
LAG3/MHC II Binding Inhibition Activity
To explore anticancer immunosuppression activity of cytochalsins from Xylaria sp. CFL5, the effects of all isolates except xylariasins B (2) and C (3) against the binding between LAG3 and MHC II were investigated. As shown in Table 3 and Fig. 8, cytochalasin D (6) regrettably did not reveal obvious inhibition effects on the interaction between these two proteins, while zygosporin G (4) possessed an inhibition rate of 55.72% at the concentration of 50 μM. It was found that all the other tested compounds (1, 5, 7‒9) inhibited the binding of LAG3 protein and MHC II protein, exhibiting inhibition rates approximately 80%. Compounds 1, 5, 7, 8 possessed IC50 values ranging from 2.37 to 4.74 μM, as demonstrated in Table 4.
Table 3.
The inhibition rates of compounds 1, 4‒9 against LAG3/MHC II and LAG3/FGL1 at a concentration of 50 μM
| LAG3/MHC II (%) | LAG3/FGL1 (%) | |
|---|---|---|
| 1 | 82.41 | 83.94 |
| 4 | 55.72 | 24.90 |
| 5 | 85.32 | 79.11 |
| 6 | − 6.96 | 2.66 |
| 7 | 82.65 | 92.70 |
| 8 | 78.93 | 92.49 |
| 9 | 77.42 | 58.36 |
Fig. 8.
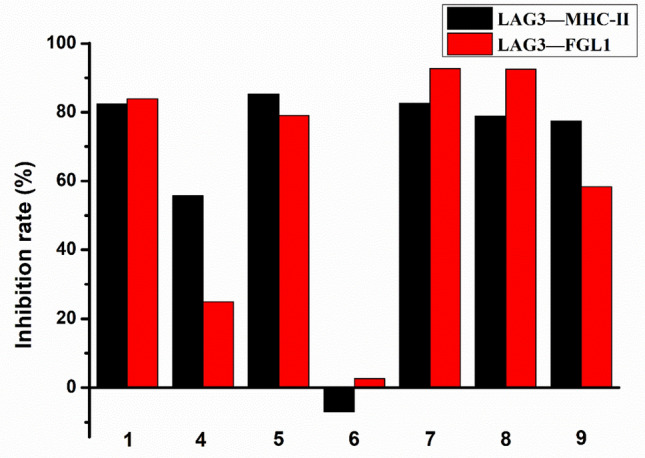
The inhibition rates of tested compounds (1, 4‒9) against LAG3/MHC II and LAG3/FGL1 at a concentration of 50 μM
Table 4.
The IC50 values (μM) of compounds 1, 5, 7, 8 against LAG3/MHC II and LAG3/FGL1
| LAG3/MHC II | LAG3/FGL1 | |
|---|---|---|
| 1 | 4.74 | 11.78 |
| 5 | 3.18 | |
| 7 | 2.37 | 4.39 |
| 8 | 2.58 | 7.45 |
LAG3/FGL1 Binding Inhibition Activity
LAG3/FGL1 was a novel immunosuppression pathway independent of LAG3/MHC II. The inhibitors influencing the binding of LAG3 and FGL1 could also prevent tumor immune escape, which could make the tumor cells recognized and killed by T cells. Exploiting the inhibitors acting on the LAG3/FGL1 pathway could provide a possibility to the cancer immunotherapy. The inhibition activity of compounds 1, 4‒9 against the interaction of LAG3/FGL1 were evaluated in vitro. The result was summarized in Fig. 8 and Tables 3 and 4. At the concentration of 50 μM, compounds 4 and 9 exhibited moderate inhibition activity on the LAG3/FGL1, with inhibition rates of 24.90% and 58.36%, respectively. Compounds 1, 5, 7, and 8 possessed inhibition rates ranging from 79.11% to 92.70% at the same concentration. The IC50 values of compounds 1, 7, 8 against the binding between LAG3 and FGL1 were 11.78, 4.39, and 7.45 μM, respectively.
In summary, nine cytochalasins including three undescribed ones (1‒3) were isolated from Xylaria sp. CFL5, an endophytic fungus of Cephalotaxus fortunei. Interestingly, all tested isolates possessed biological activities, including cytotoxicity, LAG3/FGL1 binding inhibition activity, and LAG3/FGL1 binding inhibition activity. Cytochalasin D (6) and cytochalasin C (9) possessed cytotoxicity against AGS cells at 5 μM, with inhibition rates of 94% and 64%, respectively. Except cytochalasin D (6), all tested compounds simultaneously showed inhibition effects on the interaction of LAG3 and MHC II, or LAG3 and FGL1 (Fig. 8). Compound 1, 5, 7, and 8 inhibited LAG3/MHC II with IC50 values ranging from 2.37 to 4.74 μM. Meanwhile, the IC50 values of compounds 1, 7, and 8 against LAG3/FGL1 were 11.78, 4.39, and 7.45 μM, respectively. Drugs acting on either LAG3/MHC II or LAG3/FGL1 pathway can play a part in preventing tumor immune escape. However, there were few small molecule inhibitors acting on LAG3/MHC II or LAG3/FGL1, and drugs targeting LAG3 are basically antibodies. Our research results supplemented the gap of small inhibitors on these two pathways, and it was the first report that cytochalasin derivatives can break the interactions of both LAG3/MHC II and LAG3/FGL1. These data provided cytochalasin derivatives with more possibilities of biological activities, highlighting the application potential in cancer immunotherapy.
Experimental
General Experimental Procedures
The optical rotations were measured using a PerkinElmer model 341 polarimeter. A Bruker Tensor spectrometer was used for the measurement of the IR spectra. A Shimadzu UV-260 spectrophotometer was used to measure the UV spectra. 1H, 13C, and 2D NMR spectra were recorded on a Bruker AVANCE III-400, a Bruker AVANCE NEO 600, or a Varian Mercury-600BB spectrometer. The HRESIMS data were acquired utilizing a Bruker Daltonics APEX II spectrometer. The ECD curves were obtained on an Olis DSM-1000 spectrometer. The compounds were purified by a macroporous resin HP-20 and a semipreparative HPLC with a reversed-phase C18 (150 × 10 mm, 10 μm) column. Silica gel (200–300 mesh) for column chromatography and Silica gel GF254 (10–40 mm) for TLC were purchased from the Qingdao Marine Chemical Factory, Qingdao, China.
Fungal Material
The fungus was obtained from the leaves of Cephalotaxus fortunei Hook. The plant sample was collected from Feng County, Shaanxi Province, China in August, 2017, which was identified by the professor Huyuan Feng (School of Life Science, Lanzhou University). On the basis of the ITS sequence analysis, the fungus was identified as Xylaria sp. (Genbank: KU645984.1). The fungus was inoculated on a PDA plate to obtain mycelium. Then its mycelium was picked into an Erlenmeyer flasks (100 mL) with 50 mL of YMG medium, cultured at 28 °C, 140 rpm for 5 days. 2 mL of mediums were transferred into three Erlenmeyer flasks (500 mL) with 200 mL of YMG medium. After cultivation at the same condition for 7 days, the seed culture was given. Sequently, 10 mL of seed culture was carried out in 50 rice mediums (80 g rice, 4 g sucrose, 120 mL distilled water) and incubated at 28 °C for 20 days.
Extraction, Isolation, and Purification Process
The solid mediums were extracted with EtOAc for three times. After removing the solvent under reduced pressure, a crude extract (53.9 g) was given. The crude extract was submitted to a macroporous resin HP-20 chromatographic column and eluted with a gradient elution (30%, 50%, 80%, 95% EtOH) to yield four fractions (Fr. 1–4). Fr. 3 (17.2 g) was purified using a silica gel column with a gradient elution (petroleum ether–ethyl acetate, 10:1 to 1:2) as eluent. Seven fractions (Fr. 3A–3G) were given after combination and concentration with TLC analysis. Fr. 3B (400 mg) was purification with a reversed-phase semipreparative HPLC (CH3CN/H2O, 7/3, v/v) to give compounds 1 (4.7 mg, tR = 30 min) and 2 (2.6 mg, tR = 16 min). Compound 4 (20 mg, tR = 38 min) was obtained from Fr. 3C (560 mg) with a reversed-phase semipreparative HPLC (60% CH3CN). The purification of Fr. 3D (1.4 g) with a reversed-phase semipreparative HPLC (85% CH3OH) yielded compound 3 (2.2 mg, tR = 20 min). Fr. 3E (3.7 g) was isolated with a reversed-phase semipreparative HPLC (CH3CN/H2O, 115/85, v/v) to obtain compounds 8 (3.2 mg, tR = 50 min) and 9 (2.8 mg, tR = 60 min). Using (MeCN/H2O = 101:99, v/v) as the eluent, compounds 5 (80.2 mg, tR = 18 min), 6 (7.7 mg, tR = 22 min), and 7 (2.4 mg, tR = 32 min) were purified from Fr. 3F (4.7 g) by a reversed-phase semipreparative HPLC.
Xylariasin A (1): white powder; = − 18.853 (MeOH, c 1.273); IR (KBr) νmax 3324, 2963, 2926, 1743, 1703, 1604, 1456, 1227, 1098, 1037, 737, 702 cm−1; ECD (MeOH) λmax (Δε), 229 (− 10.57), 256 (+ 0.43), 294 (− 3.10) nm; HRESIMS [M + H]+ m/z 476.2793 (calcd for C30H38NO4 476.2795); 1H and 13C NMR data, found in Tables 1 and 2.
Table 1.
1H NMR Spectroscopic Data (in CDCl3, J in Hz) for Compounds 1, 2, and 3
| Position | 1a | 2a | 3b |
|---|---|---|---|
| 3 | 3.16, dd (8.4, 4.0) | 3.13, m | 3.17, m |
| 4 | 2.13, t (4.4) | 2.14, t (4.0) | 2.16, t (4.2) |
| 5 | 2.42, br s | 2.41, br s | 2.45, br s |
| 7 | 5.31, s | 5.25, s | 5.37, s |
| 8 | 3.12, m | 3.08, d (8.8) | 3.18, m |
| 10 | a 2.87, dd (13.6, 4.4) | a 2.92, dd (13.6, 3.6) | a 2.89, dd (13.8, 4.2) |
| b 2.57, dd (13.6, 9.6) | b 2.53, dd (13.6, 10.0) | b 2.59, dd (13.2, 9.6) | |
| 11 | 1.10, d (7.6) | 1.15, d (7.2) | 1.13, d (7.2) |
| 12 | 1.69, s | 1.71, s | 1.71, s |
| 13 | 5.80, dd (16.0, 10.0) | 6.18, s | 5.85, dd (15.6, 10.2) |
| 14 | 5.08, ddd (15.2, 10.8, 4.4) | 4.94, m | 5.09, ddd (15.6, 10.8, 4.8) |
| 15 | a 2.29, m | a 2.69, m | a 1.92, dd (12.6, 4.8) |
| b 2.00, dt (12.8, 6.0) | b 2.61, m | b 1.87, t (12.0) | |
| 16 | 2.64, ddd (9.6, 6.8, 2.4) | 1.57, m | |
| 17 | 3.79, s | ||
| 18 | 3.25, t (7.2) | 3.72, m | 2.50, m |
| 19 | 4.75, ddd (16.0, 7.6, 2.4) | 4.98, m | 4.86, ddd (15.0, 7.2, 1.8) |
| 20 | 6.04, ddd (16.0, 2.8, 1.2) | 6.21, s | 6.00, d (16.2) |
| 21 | 5.53, s | 5.49, s | 5.60, s |
| 22 | 1.15, d (6.8) | 1.42, s | 0.99, d (7.2) |
| 23 | 1.22, d (7.2) | 1.19, d (6.8) | 0.98, d (6.6) |
| 25 | 2.23, s | 2.21, s | 2.23, s |
| 2′/6′ | 7.12, d (6.8) | 7.12, d (6.8) | 7.14, d (7.8) |
| 3′/5′ | 7.30, t (6.8) | 7.31, t (7.6) | 7.32, t (7.2) |
| 4′ | 7.24, m | 7.26, m | 7.25, m |
| NH | 5.89, s | 6.05, s | 5.43, s |
aRecorded in 400 MHz, TMS, δ in ppm
bRecorded in 600 MHz, TMS, δ in ppm
Table 2.
13C NMR Spectroscopic Data (Recorded in 150 MHz, in CDCl3) for compounds 1, 2, and 3
| Position | 1 | 2 | 3 |
|---|---|---|---|
| 1 | 175.3, C | 176.1, C | 175.3, C |
| 3 | 55.8, CH | 56.0, CH | 55.8, CH |
| 4 | 53.8, CH | 53.5, CH | 54.5, CH |
| 5 | 35.3, CH | 35.2, CH | 35.4, CH |
| 6 | 138.1, C | 138.5, C | 137.8, C |
| 7 | 127.7, CH | 127.2, CH | 128.1, CH |
| 8 | 43.0, CH | 42.1, CH | 43.3, CH |
| 9 | 57.4, C | 55.6, C | 57.0, C |
| 10 | 45.9, CH2 | 45.8, CH2 | 46.1, CH2 |
| 11 | 14.2, CH3 | 14.7, CH3 | 14.1, CH3 |
| 12 | 19.9, CH3 | 20.1, CH3 | 20.0, CH3 |
| 13 | 132.1, CH | 135.3, CH | 130.1, CH |
| 14 | 132.4, CH | 129.0, CH | 134.0, CH |
| 15 | 37.6, CH2 | 42.7, CH2 | 40.8, CH2 |
| 16 | 44.0, CH | 81.9, C | 32.8, CH |
| 17 | 211.8, C | 216.3, C | 78.5, CH |
| 18 | 50.2, CH | 46.3, CH | 43.0, CH |
| 19 | 124.5, CH | 127.2, CH | 131.2, CH |
| 20 | 132.6, CH | 131.4, CH | 129.6, CH |
| 21 | 77.2, CH | 76.7, CH | 77.5, CH |
| 22 | 19.1, CH3 | 25.5, CH3 | 17.1, CH3 |
| 23 | 16.3, CH3 | 18.7, CH3 | 12.3, CH3 |
| 24 | 170.0, C | 170.0, C | 170.2, C |
| 25 | 20.9, CH3 | 20.1, CH3 | 21.0, CH3 |
| 1′ | 137.6, C | 137.5, C | 137.9, C |
| 2′/6′ | 129.2, CH | 129.0, CH | 129.1, CH |
| 3′/5′ | 129.0, CH | 129.0, CH | 129.1, CH |
| 4′ | 127.2, CH | 127.4, CH | 127.2, CH |
Xylariasin B (2): colorless oil; = + 13.559 (MeOH, c 0.885); IR (KBr) νmax 3456, 3302, 2969, 2933, 1740, 1692, 1454, 1373, 1229, 738, 702 cm−1; ECD (MeOH) λmax (Δε), 212 (+ 6.70), 231 (− 2.44), 243 (− 0.50), 266 (+ 0.70), 298 (+ 4.70) nm; HRESIMS [M + H]+ m/z 492.2741 (calcd for C30H38NO5 492.2744); 1H and 13C NMR data, found in Tables 1 and 2.
Xylariasin C (3): white powder; = − 20.883 (MeOH, c 0.336); IR (KBr) νmax 3369, 2925, 1773, 1719, 1686, 1262, 1232, 1107, 1074, 1027, 740, 702 cm−1; ECD (MeOH) λmax (Δε), 203 (− 17.70), 222 (− 8.82) nm; HRESIMS [M + Na]+ m/z 500.2768 (calcd for C30H39NO4Na 500.2771); 1H and 13C NMR data, found in Tables 1 and 2.
Cytotoxicity Assay
With adriamycin as the positive control, compounds 1, 4–9 were assessed for cytotoxicity against AGS, U251, and MDA-MB-231 by the CCK8 assay (Tables 3 and 4).
LAG3/MHC II Binding Assay
Utilizing HTRF (Homogeneous Time-resolved Fluorescence) technology [34, 35], the inhibition activity of tested compounds interfering in the interaction between MHC II and LAG3 proteins was evaluated. The activity was measured using LAG3/MHC II binding assay kit commercially available from Cisbio. The tested compounds were dissolved with DMSO, then diluted with the diluent provided in the kit to give the tested solutions. 2 μL tested solutions, 4 μL Tag1-LAG3 protein, and 4 μL Tag2-MHC II protein were added in sterile 96-well dishes. After incubation for 15 min in room temperature, 5 μL anti-Tag1-Tb3+ and 5 μL anti-Tag2-XL665 (or 10 μL of pre-mixed anti-tag detection reagents) were added into each well. The concentration of DMSO in each well was kept below 0.5% and the final volume in each well was 20 μL in the moment. Then the 96-well dishes were kept incubating for 1 h to overnight at room temperature. Subsequently, remove the plate sealer and read specific emission signal at 665 nm on an HTRF compatible reader. The positive control was yielded by replacing tested solution with 2 μL diluent. The negative control consisted of 4 μL Tag2-MHC II protein, 5 μL anti-Tag1-Tb3+ and 5 μL anti-Tag2-XL665, as well as 6 μL diluent. In blank control, 5 μL anti-Tag1-Tb3+, 10 μL diluent, and 5 μL detection buffer were existed.
Using the following fluorescence intensity (F) measurements at 665 nm, such as the signals of positive control (Fp), blank control (Fb), and experimental groups (Fe), the inhibition rate was calculated at each of the compound concentration levels. The inhibitory activity of compound against the interaction of LAG3 with MHC II was evaluated based on the formula as follow: Inhibition rate = (Fp − Fe)/(Fp − Fb) × 100%. IC50 values were calculated by linear regression of a dose-dependent inhibition rate curve.
LAG3/FGL1 Binding Assay
The tested principles and methods were similar to those of LAG3/MHC II. Using LAG3/FGL1 binding assay kit from Cisbio, the inhibition activity of tested compounds on the binding between LAG3 and MHC II was evaluated. The ligand protein in this kit was Tag2-FGL1 protein, which was distinguished from Tag2-MHC II protein. Moreover, the compositions of tested groups, positive control, negative control, blank control were analogical with those of LAG3/MHC II kit. The experimental operations and statistical analysis were also identical with above-mentioned LAG3/MHC II kit.
Electronic supplementary material
Below is the link to the electronic supplementary material.
Acknowledgement
This project was supported financially by the National Natural Science Foundation of China (No. 21778027) and the Natural Science Foundation of Gansu Province (No. 18JR4RA003).
Compliance with Ethical Standards
Conflict of interest
The authors declare that they have no conflict interest.
References
- 1.Scherlach K, Boettger D, Remme N, Hertweck C. Nat. Prod. Rep. 2010;27:869–886. doi: 10.1039/b903913a. [DOI] [PubMed] [Google Scholar]
- 2.Skellam E. Nat. Prod. Rep. 2017;34:1252–1263. doi: 10.1039/C7NP00036G. [DOI] [PubMed] [Google Scholar]
- 3.Han WB, Zhai YJ, Gao Y, Zhou HY, Xiao J, Pescitelli G, Gao JM. J. Agric. Food Chem. 2019;67:3643–3650. doi: 10.1021/acs.jafc.9b00273. [DOI] [PubMed] [Google Scholar]
- 4.Shang Z, Raju R, Salim AA, Khalil ZG, Capon RJ. J. Org. Chem. 2017;82:9704–9709. doi: 10.1021/acs.joc.7b01793. [DOI] [PubMed] [Google Scholar]
- 5.Chen ZM, Chen HP, Li Y, Feng T, Liu JK. J. Antibiot. 2015;68:23–26. doi: 10.1038/ja.2014.87. [DOI] [PubMed] [Google Scholar]
- 6.Wang JF, Wang Z, Ju ZR, Wan JT, Liao SR, Lin XP, Zhang TY, Zhou XF, Chen H, Tu ZC, Liu YH. Planta Med. 2015;81:160–166. doi: 10.1055/s-0034-1383403. [DOI] [PubMed] [Google Scholar]
- 7.Xin XQ, Chen Y, Zhang H, Li Y, Yang MH, Kong LY. Fitoterapia. 2019;132:53–59. doi: 10.1016/j.fitote.2018.11.010. [DOI] [PubMed] [Google Scholar]
- 8.Pang X, Zhao JY, Fang XM, Zhang T, Zhang DW, Liu HY, Su J, Cen S, Yu LY. J. Nat. Prod. 2017;80:2595–2601. doi: 10.1021/acs.jnatprod.6b00878. [DOI] [PubMed] [Google Scholar]
- 9.X.S. Huang, D.X. Zhou, Y. Liang, X.B. Liu, F. Cao, Y.Y. Qin, T.X. Mo, Z.L. Xu, J. Li, R.Y. Yang, Nat. Prod. Res. 1‒8 (2019)
- 10.Xu Y, Bashyal BP, Liu MX, Espinosaartiles P, Uren JM, Arnold AE, Gunatilaka A. Nat. Prod. Commun. 2015;10:1655–1658. [PubMed] [Google Scholar]
- 11.Liu YN, Ruan QF, Jiang SQ, Qu Y, Chen JY, Zhao M, Yang B, Liu YX, Zhao ZX, Cui H. Fitoterapia. 2019;137:104187. doi: 10.1016/j.fitote.2019.104187. [DOI] [PubMed] [Google Scholar]
- 12.Song F, Wu SH, Zhai YZ, Xuan QC, Wang T. Chem. Biodivers. 2014;11:673–694. doi: 10.1002/cbdv.201200286. [DOI] [PubMed] [Google Scholar]
- 13.Helaly SE, Thongbai B, Stadler M. Nat. Prod. Rep. 2018;35:992–1014. doi: 10.1039/C8NP00010G. [DOI] [PubMed] [Google Scholar]
- 14.Zhang Q, Xiao J, Sun QQ, Qin JC, Pescitelli G, Gao JM. J. Agric. Food Chem. 2014;62:10962–10969. doi: 10.1021/jf503846z. [DOI] [PubMed] [Google Scholar]
- 15.Chang JC, Hsiao G, Lin RK, Kuo YH, Ju YM, Lee TH. J. Nat. Prod. 2017;80:38–44. doi: 10.1021/acs.jnatprod.6b00249. [DOI] [PubMed] [Google Scholar]
- 16.Zhao YM, Gu PM, Zhang HJ, Zhang QW, Fan CA, Tu YQ, Zhang FM. J. Org. Chem. 2009;74:3211–3213. doi: 10.1021/jo900113s. [DOI] [PubMed] [Google Scholar]
- 17.Zhang QW, Xiang K, Tu YQ, Zhang SY, Zhang XM, Zhao YM, Zhang TC. Chem. Asian J. 2012;7:894–898. doi: 10.1002/asia.201101029. [DOI] [PubMed] [Google Scholar]
- 18.Gandhi V, Plunkett W, Cortes JE. Clin. Cancer Res. 2014;20:1735–1740. doi: 10.1158/1078-0432.CCR-13-1283. [DOI] [PMC free article] [PubMed] [Google Scholar]
- 19.Puhr HC, Ilhan-Mutlu A. ESMO Open. 2019;4:e000482. doi: 10.1136/esmoopen-2018-000482. [DOI] [PMC free article] [PubMed] [Google Scholar]
- 20.Barrueto L, Caminero F, Cash L, Makris C, Lamichhane P, Deshmukh RR. Transl. Oncol. 2020;13:100738. doi: 10.1016/j.tranon.2019.12.010. [DOI] [PMC free article] [PubMed] [Google Scholar]
- 21.Ruffo E, Wu RC, Bruno TC, Workman CJ, Vignali DA. Semin. Immunol. 2019;42:101305. doi: 10.1016/j.smim.2019.101305. [DOI] [PMC free article] [PubMed] [Google Scholar]
- 22.Graydon CG, Balasko AL, Fowke KR. PLoS Pathog. 2019;15:e1007429. doi: 10.1371/journal.ppat.1007429. [DOI] [PMC free article] [PubMed] [Google Scholar]
- 23.Collin M. Expert Opin. Ther. Pat. 2016;26:555–564. doi: 10.1080/13543776.2016.1176150. [DOI] [PubMed] [Google Scholar]
- 24.Wang J, Sanmamed MF, Datar I, Su TTJ, Ji L, Sun JW, Chen L, Chen YS, Zhu GF, Yin WW, Zheng LH, Zhou T, Badri T, Yao S, Zhu S, Boto A, Sznol M, Melero I, Vignali DAA, Schalper K, Chen LP. Cell. 2019;176:334–347. doi: 10.1016/j.cell.2018.11.010. [DOI] [PMC free article] [PubMed] [Google Scholar]
- 25.Andrews LP, Marciscano AE, Drake CG, Vignali DAA. Immunol. Rev. 2017;276:80–96. doi: 10.1111/imr.12519. [DOI] [PMC free article] [PubMed] [Google Scholar]
- 26.Solinas C, Migliori E, Silva PD, Willard-Gallo K. Cancers. 2019;11:1213. doi: 10.3390/cancers11081213. [DOI] [PMC free article] [PubMed] [Google Scholar]
- 27.Wang WX, Li ZH, Ai HL, Li J, He J, Zheng YS, Feng T, Liu JK. Fitoterapia. 2019;137:104253. doi: 10.1016/j.fitote.2019.104253. [DOI] [PubMed] [Google Scholar]
- 28.Wang WX, Li ZH, He J, Feng T, Li J, Liu JK. Fitoterapia. 2019;137:104278. doi: 10.1016/j.fitote.2019.104278. [DOI] [PubMed] [Google Scholar]
- 29.Minato H, Katayama T. J. Chem. Soc. Perkin. 1970;1:45–47. doi: 10.1039/j39700000045. [DOI] [PubMed] [Google Scholar]
- 30.Li YY, Lu CH, Hu ZY, Huang YJ, Shen YM. Nat. Prod. Res. 2009;23:70–76. doi: 10.1080/14786410701852818. [DOI] [PubMed] [Google Scholar]
- 31.Xu H, Fang WS, Chen XG, He WY, Cheng KD. J. Asian Nat. Prod. Res. 2001;3:151–155. doi: 10.1080/10286020108041383. [DOI] [PubMed] [Google Scholar]
- 32.Fujii Y, Tani H, Ichinoe M, Nakajima H. J. Nat. Prod. 2000;63:132–135. doi: 10.1021/np990331t. [DOI] [PubMed] [Google Scholar]
- 33.Wei H, Xu YM, Espinosa-Artiles P, Liu MX, Luo JG, U’Ren JM, Elizabeth Arnold A, Leslie Gunatilaka AL. Phytochemistry. 2015;118:102–108. doi: 10.1016/j.phytochem.2015.08.010. [DOI] [PMC free article] [PubMed] [Google Scholar]
- 34.Milhas S, Raux B, Betzi S, Derviaux C, Roche P, Restouin A, Basse MJ, Rebuffet E, Lugari A, Badol M, Kashyap R, Lissitzky JC, Eydoux C, Hamon V, Gourdel ME, Combes S, Zimmermann P, Aurrand-Lions M, Roux T, Rogers C, Müller S, Knapp S, Trinquet E, Collette Y, Guillemot JC, Morelli X, Chem ACS. Biol. 2016;11:2140–2148. doi: 10.1021/acschembio.6b00286. [DOI] [PubMed] [Google Scholar]
- 35.Alpha-Bazin B, Quéméneur E. Anal. Chem. 2012;84:9963–9970. doi: 10.1021/ac3021505. [DOI] [PubMed] [Google Scholar]
Associated Data
This section collects any data citations, data availability statements, or supplementary materials included in this article.


