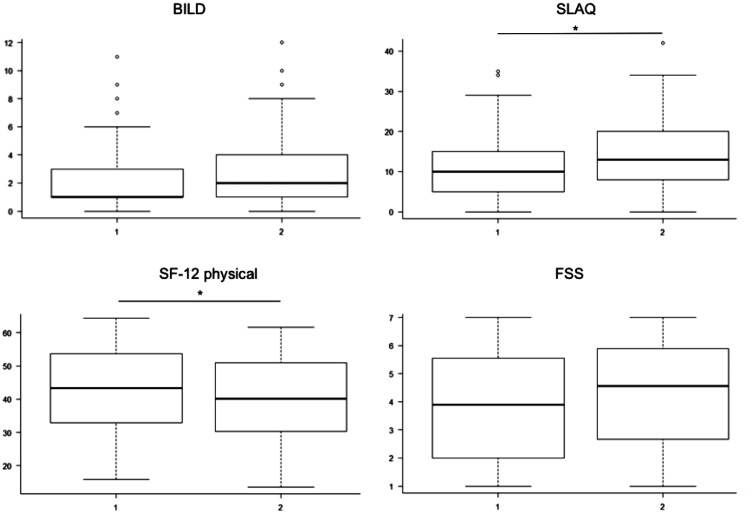
Figure 2.
Effects of time to diagnosis on disease-related damage (BILD), disease activity (SLAQ), health related quality of life (SF-12) and fatigue in the year 2012. Boxplots presenting two groups of patients: 1 presenting patients that reported a time to diagnosis of less than 6 month from the onset of symptoms (n = 264), 2 presenting patients that reported a time of more than 6 month (n = 321). T-Test for comparison of the two groups. *p < 0.05.

