Abstract
Mitochondrial dysfunction contributes to the pathophysiology of acute kidney injury (AKI). Mitophagy selectively degrades damaged mitochondria and thereby regulates cellular homeostasis. RNA‐binding proteins (RBPs) regulate RNA processing at multiple levels and thereby control cellular function. In this study, we aimed to understand the role of human antigen R (HuR) in hypoxia‐induced mitophagy process in the renal tubular cells. Mitophagy marker expressions (PARKIN, p‐PARKIN, PINK1, BNIP3L, BNIP3, LC3) were determined by western blot analysis. Immunofluorescence studies were performed to analyze mitophagosome, mitolysosome, co‐localization of p‐PARKIN/TOMM20 and BNIP3L/TOMM20. HuR‐mediated regulation of PARKIN/BNIP3L expressions was determined by RNA‐immunoprecipitation analysis and RNA stability experiments. Hypoxia induced mitochondrial dysfunction by increased ROS, decline in membrane potential and activated mitophagy through up‐regulated PARKIN, PINK1, BNIP3 and BNIP3L expressions. HuR knockdown studies revealed that HuR regulates hypoxia‐induced mitophagosome and mitolysosome formation. HuR was significantly bound to PARKIN and BNIP3L mRNA under hypoxia and thereby up‐regulated their expressions through mRNA stability. Altogether, our data highlight the importance of HuR in mitophagy regulation through up‐regulating PARKIN/BNIP3L expressions in renal tubular cells.
Keywords: acute kidney injury, BNIP3L, HK‐2, HuR, mitophagy, PARKIN
1. INTRODUCTION
Mitochondria provide high energy needs to perform pleiotropic functions of the kidney such as metabolism, nutrients' reabsorption, fluid and electrolytes' balance. 1 Mitochondrial dysfunction caused by ischemia‐reperfusion injury is one of the most important contributor in AKI pathogenesis. 2 Maintenance of mitochondrial health is pivotal as they are prime source of ROS and apoptotic regulators. 3 Dysfunction causes decreased ATP production and activation of mitochondrial stress responses. Loss of mitochondrial function has been previously reported in experimental AKI models of sepsis and cisplatin‐induced nephrotoxicity. 4 , 5 , 6 , 7 Disturbed mitochondrial dynamics, redox status and energetics are all implicated during AKI. 5 , 8 , 9 , 10 Thus, mitochondria regulate complex cellular signalling of cell survival and death mechanisms. 11 Removal of dysfunctional mitochondria by organelle‐specific autophagy termed as mitochondrial autophagy (mitophagy) replenishes with functional mitochondria. 12 Impaired mitophagy mechanisms might promote inflammation and cell death causing AKI progression to chronic kidney disease (CKD). 13 Since mitophagy process maintains functional mitochondria it is important to understand its regulatory mechanisms.
Mitophagy is a protective response against oxidative damage in AKI. 14 During increased oxidative stress, dysfunctional mitochondria with relatively low membrane potential are segregated during mitochondrial fission process. 15 Further, priming of mitochondria through PINK1 (PTEN‐induced kinase 1)/PARKIN (Parkin RBR E3 ubiquitin protein ligase) and BNIP3 (BCL2 interacting protein 3)/BNIP3L (BCL2 interacting protein 3 like)‐dependent mechanisms help in recognition by autophagic machinery to form mitophagosome. Finally, mitochondria degradation occurs in the endolysosomal compartment (mitolysosme) through the fusion of mitophagosome with lysosomes. Studies show the functional role of mitophagy in the pathogenesis of disease. 16 , 17 Renoprotective role of mitophagy has been demonstrated in a hyperglycaemic rabbit model, 18 acid‐loaded metabolic acidosis, 19 high‐calorie diet‐induced injury, 20 ischemia‐reperfusion injury, 17 sepsis 21 and kidney fibrosis. 22 Despite abundant knowledge on mitophagy, the regulatory mechanisms involved in the removal of dysfunctional mitochondria remains elusive. For a better therapeutic strategy, understanding the homeostatic regulatory mitophagy mechanisms involved in AKI is paramount.
RNA‐binding proteins (RBPs) regulate gene expression through post‐transcriptional processing of RNA. RBPs regulate cellular adaptation to stress response by modulating functionally related proteins through RNA regulation. 23 RBPs specifically bind to the A/U rich regions of the target transcripts through RNA‐binding domains (RBDs) and regulate its mRNA stability and translation. 24 In addition, these RBPs bound to the AU rich regions at 3'UTRs of RNA transcripts protect from miRNA‐mediated translational repression. 25 , 26 , 27 HuR is ubiquitously expressed RBP which is mainly involved in post‐transcriptional regulation of RNA. HuR belongs to embryonic lethal abnormal vision (ELAV) family of Hu proteins and regulates cellular functions including proliferation, immune regulation, differentiation, senescence, apoptosis and stress responses. 28 The functional importance of RNA‐binding proteins in regulating nuclear‐encoded mitochondrial protein expression and mitochondrial function has been reviewed elsewhere. 29 We have previously demonstrated that under hypoxia, HuR regulates cellular autophagy and apoptosis in renal cells. 30 However, the importance of RBPs in mitophagy process is not clear. In this study, we focussed on identifying whether HuR might play an important regulatory role in mitophagy.
Our findings show novel evidence that HuR functionally regulates mitophagy under hypoxia‐induced stress in renal tubular cells. HuR‐mediated post‐transcriptional function up‐regulates PARKIN and BNIP3L expressions through mRNA stabilization and thereby regulates hypoxia‐induced mitophagy in renal tubular cells.
2. MATERIALS AND METHODS
2.1. Cells, antibodies and reagents
HK‐2 cells (Human, kidney proximal tubular 2) were obtained from ATCC (ATCC® CRL‐2190™). The primary antibodies used in this study include anti‐PARKIN (Cat no: #2132, 1:500; Cell Signaling Technology), anti‐p‐PARKIN (Cat no: orb312554, 1:250, Biorbyt), anti‐PINK1 (Cat no: #6946, 1:500; Cell Signaling Technology), anti‐BNIP3L (Cat no: GTX111876, 1:1000, GeneTex), anti‐BNIP3 (Cat no: GTX10433, 1:1000, GeneTex), anti‐HuR (Cat no: #12582, 1:1000, Cell Signaling Technology), anti‐TOMM20 (Cat no: ab56783, 1:200, Abcam), anti‐LC3 (Cat no: NB100‐2220, 1:200, Novus Biologicals), anti‐COXIV (Cat no: 4850, 1:1000, Cell Signaling Technology), anti‐LAMP2 (Cat no: 49067, 1:200, Cell Signaling Technology), and anti‐β‐ACTIN (Cat no: A1978, 1:1000, Sigma‐Aldrich). Secondary antibodies‐rabbit/mouse IgG HRP, Alexa Fluor 546 anti‐mouse IgG (H + L), Alexa Fluor 488 anti‐goat IgG (H + L), Alexa Fluor 647 anti‐rabbit IgG (H + L) were purchased from Invitrogen™. 2′,7′‐dichlorofluorescin‐diacetate (DCFH2‐DA), JC‐1 and DAPI (4′,6‐diamidino‐2‐phenylindole) mount were purchased from Sigma Aldrich. Magna RIP™ RNA‐Binding Protein Immunoprecipitation Kit was procured from Sigma‐Aldrich. The SuperSignal West Femto Maximum Sensitivity Substrate detection reagents were purchased from Thermo Scientific Inc.
2.2. Cell culture and treatment
HK‐2 cells were cultured in RPMI 1640 medium with 10% FBS and 1% penicillin/streptomycin in a CO2 incubator at 37°C. The cells were treated under normoxia or 1% hypoxic conditions at indicated time points and harvested for further analysis.
2.3. Generation of HuR‐knockdown cells
Lentivirus‐mediated stable HK‐2‐shHuR knockdown cells were established as described previously. 30 The HuR and LacZ‐control shRNA targeting sequences in pLKO.1‐puro vector and packaging plasmids (pMD.G, pCMVDR8.91) were purchased from RNAiCore facility, Academia Sinica, Taiwan.
2.4. Confocal imaging
The HK‐2 cells or HuR knockdown cells were allowed to attach in coverslips and then exposed to normoxia or hypoxia conditions. Followed by fixation, the cells were permeabilized with Triton X‐100‐blocking buffer for 60 minutes. The cells were treated with primary antibodies overnight at 4°C. HuR localization in the nucleus/cytoplasm under normoxia and hypoxia was determined using anti‐HuR primary antibody and DAPI counter staining. To examine p‐PARKIN or BNIP3L mitochondrial localization, the cells were stained with anti‐p‐PARKIN or anti‐BNIP3L primary antibodies and co‐incubated with anti‐TOMM20 (Translocase of outer mitochondrial membrane 20) antibody (mitochondrial marker). To monitor hypoxia‐induced mitophagosome formation, the cells were incubated with anti‐LC3 (microtubule associated protein 1 light chain 3 alpha) and anti‐TOMM20 primary antibodies and mitolysosome formation were assessed through primary antibodies specific to LAMP2 (lysosomal associated membrane protein 2) (lysosome marker) and COXIV (cytochrome c oxidase subunit 4I1) (mitochondrial marker). The coverslips were washed with PBS for 3 times, 5 minutes each. The cells were incubated with a secondary antibody (1:100) for 2 hours at room temperature. The cells were DAPI mounted and analysed under Olympus DSU Spinning Disk‐confocal microscope. Pearson's coefficient for co‐localization of LC3/TOMM20, LAMP2/COXIV, p‐PARKIN/TOMM20, BNIP3L/TOMM20 were analysed using the JACoP plugin, ImageJ software.
2.5. RNA purification and RT‐qPCR
The total RNA isolated (TRIzol reagent) was reverse transcribed to cDNA using M‐MLV Reverse Transcriptase. Quantitative real‐time PCR analysis for PARKIN and BNIP3L expressions was performed using SYBR green fluorescent mix (Thermo Fisher Scientific). GAPDH was used as a normalization control. Primers specific for PARKIN (Forward‐ GGAGCTGAGGAATGACTGGA; Reverse: ACAATGTGAACAATGCTCTGCT), BNIP3L (Forward‐ GATGCACAACATGAATCAGGA; Reverse: CCATCTTCTTGTGGCGAAG), GAPDH (Forward‐AGCCACATCGCTCAGACAC; Reverse: GCCCAATACGACCAAATCC) were used.
2.6. Mitochondrial superoxide quantification
The mitochondrial superoxide levels were detected using mitochondrial superoxide detection kit (Abcam 19943). The HK‐2 cells were allowed for overnight attachment and exposed for normoxia and hypoxia (6 and 16 hours) conditions. Followed by this, mitoROS working solution was added and incubated at 37℃ for 60 minutes. The fluorescence intensity was measured at 540/590 nm using fluorescence reader (Hitachi Spectrofluorometer).
2.7. Mitochondrial membrane potential (Δψm)
The mitochondrial membrane potential assay was performed using JC‐1 cell‐permeant dye. After the respective treatment schedule of normoxia and hypoxia, cells were treated with JC‐1 dye for 30 minutes. The cells were PBS washed, and fluorescence intensity was measured using a fluorescence reader (Hitachi Spectrofluorometer).
2.8. Western blotting
The cells were exposed to normoxia or hypoxia, and the proteins were isolated using RIPA buffer. The SDS‐PAGE gel (10%‐12%) separated proteins were transferred to PVDF membrane (PerkinElmer, Life Science). The membranes were incubated in the blocking buffer for 1 minute and treated with primary antibodies overnight at 4°C. The blots were washed with TBST (thrice, 5 minutes each) and incubated with IgG HRP‐linked secondary antibodies for 1 hour at room temperature. The membranes were washed with TBST and exposed to enhanced chemiluminescence (ECL) solution for 1‐2 minutes, and images were captured in ImageQuant LAS4000 (GE Healthcare).
2.9. HuR‐RNA immunoprecipitation
The RNA immunoprecipitation was performed to analyse HuR bound PARKIN and BNIP3L mRNAs. The experiment was performed as per the manufacturer's protocol (Magna RIP™ RNA‐Binding Protein Immunoprecipitation Kit; Millipore). The HuR‐RNA complexes in the cell lysate were immunoprecipitated using protein G beads‐HuR antibody. The purified RNA was analysed for PARKIN and BNIP3L expressions using RT‐qPCR analysis.
2.10. mRNA stability
To determine HuR‐mediated RNA stability, WT and knockdown HuR cells were treated with actinomycin D (2.5 μg/mL). The isolated RNAs after treatment were analysed for PARKIN and BNIP3L expressions using RT‐qPCR analysis and half‐life was calculated. 7SL, stable lncRNA was used as a positive control.
2.11. Statistics
Data are expressed as mean values ± SD. The significant differences were calculated using one‐way or two‐way analysis of variance followed by Dunnett's or Sidak's or Tukey's multiple comparison analysis. The differences were considered statistically significant for P < .05, P < .01, P < .001. NS represents non‐significant. The data were analysed using Prism6 (GraphPad Software Inc).
3. RESULTS
3.1. Hypoxia induces mitochondrial dysfunction and mitophagy proteins (PINK1/PARKIN, BNIP3/BNIP3L) in renal tubular cells
In order to understand the effect of hypoxia stress on mitochondrial dysfunction, we analysed mitochondrial ROS, mitochondrial membrane potential and mitophagy‐related protein expressions in the renal tubular cells. Figure 1A,B shows significant up‐regulation of PINK1, PARKIN, p‐PARKIN expressions in HK‐2 cells at 6 hours hypoxia compared to 0 hour. Figure 1C,D shows a significant increase in BNIP3, BNIP3L expressions under 6 hours, 16 hours hypoxia compared to 0 hour. Further, hypoxia induced oxidative stress in renal cells by increasing mitochondrial superoxide levels with concomitant mitochondrial depolarization (Figure 1E‐G). Since mitophagy protein expressions were significantly up‐regulated at 6 hours hypoxia, further experiments were carried out at this time point. Figure 1H shows that hypoxia increased LC3 mitochondrial translocation under hypoxia leading to mitophagosome formation compared to control cells. These results show that hypoxia induces mitophagy through increased mitophagosome formation in HK‐2 cells.
FIGURE 1.
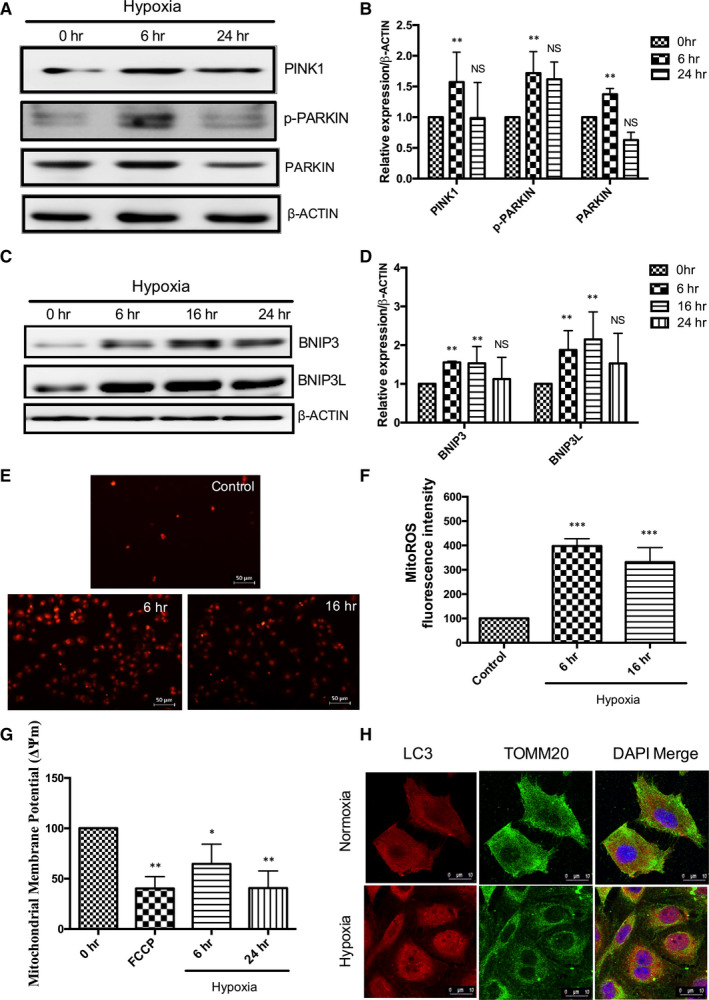
Hypoxia induces mitochondrial dysfunction and mitophagy in HK‐2 cells. (A, B) Hypoxia induces PINK1, p‐PARKIN and PARKIN expression under hypoxia. Results of densitometric analysis shown as mean ± SD, n = 3; non‐significant (NS),**P < .01 compared with 0 hour, two‐way ANOVA followed by Tukey's multiple comparisons test. (C, D) Increased BNIP3 and BNIP3L expressions under hypoxia. Results of densitometric analysis shown as mean ± SD, n = 3; non‐significant (NS),**P < .01 compared with 0 hour, two‐way ANOVA followed by Dunnett's multiple comparisons test. (E, F) Hypoxia induces MitoROS fluorescence intensity, Scale‐50 µm, Magnification‐200×; (G) Hypoxia induces change in mitochondrial membrane potential. The results are shown as mean ± SD, n = 3, *P < .05,**P < .01,***P < .001 compared with control, one‐way ANOVA followed by Dunnett's multiple comparisons test. (H) Hypoxia induces LC3 localization with mitochondria (TOMM20). LC3‐Red; TOMM20 (green); DAPI (Blue). Scale‐10 µm, Magnification‐1,260×
3.2. Human antigen R (HuR) regulates hypoxia‐induced mitophagosome formation in renal tubular cells
To identify whether the RNA‐binding protein (HuR) regulates hypoxia‐induced mitophagy, the HuR expression was analysed under normoxia and hypoxia. Figure 2A,B shows that hypoxia up‐regulates HuR expression compared to normoxia. Further, HuR translocated from nucleus to cytoplasm under hypoxia (Figure 2C). To evaluate the role of HuR on mitophagosome formation, we established knockdown HuR (shHuR) cells (Figure 2D). Hypoxia‐induced LC3II expressions was significantly decreased in the HuR knockdown cells (Figure 2E,F). Immunofluorescence results of LC3 co‐localization with TOMM20 show that HuR knockdown cells significantly reduced hypoxic stress‐induced mitophagosome formation (Figure 2G,H).
FIGURE 2.
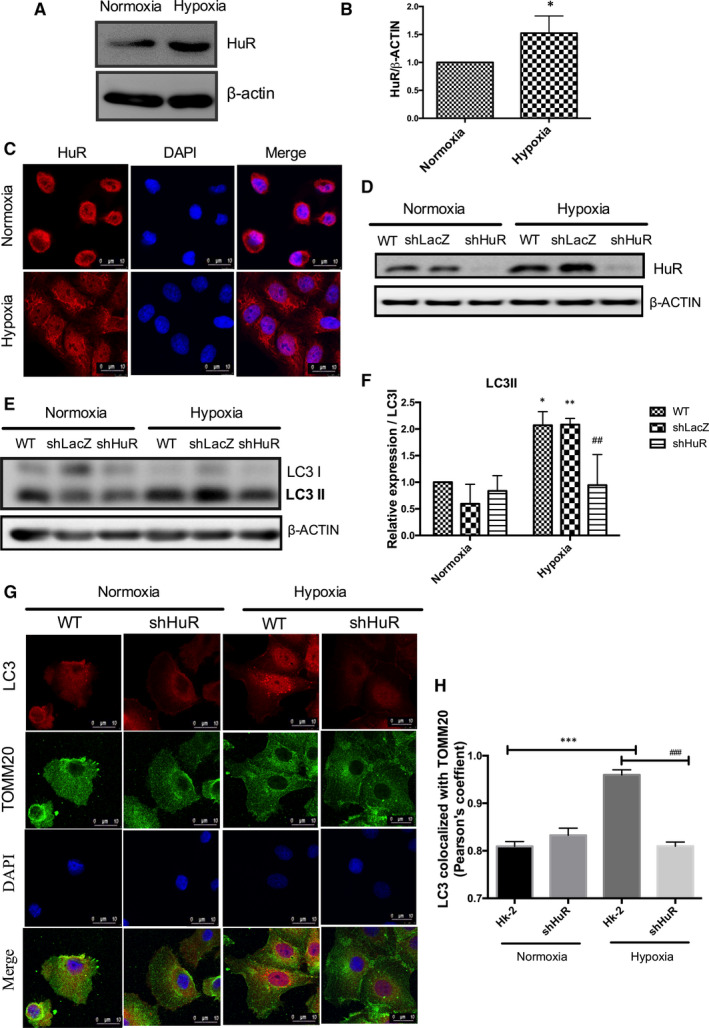
HuR regulates hypoxia‐induced mitophagosome formation in renal tubular cells. (A, B) Hypoxia up‐regulates HuR expression compared to normoxia. The data are expressed as mean ± SD, n = 3, two‐tailed unpaired t‐test, *P < .05 compared to normoxia. (C) Confocal analysis of cytoplasmic localization of HuR under hypoxia. Red‐HuR, Blue‐DAPI. Scale‐10 µm, Magnification‐1260× (D) HK‐2 shHuR cells shows down‐regulated HuR expression under normoxia and hypoxia. (E, F) Knockdown HuR significantly down‐regulates hypoxia‐induced LC3II expression. The relative density of LC3II/LC3I expression is represented as mean ± SD, n = 3, *P < .05, **P < .01, compared with WT‐normoxia; ## P < .01 compared with WT‐hypoxia. Two‐way ANOVA followed by Sidak's multiple comparisons test. (G) Effect of HuR on mitophagosome formation under hypoxia as analysed by immunofluorescence analysis. LC3‐Red; TOMM20 (green); DAPI (Blue). Scale‐10 µm, Magnification‐1,260× (H) The bar graph shows Pearson's coefficient for the co‐localization of LC3 with TOMM20. The values are mean ± SD, n = 3, ***P < .001 compared with HK‐2 normoxia, ### P < .001 compared with HK‐2‐Hypoxia, two‐way ANOVA followed by Dunnett's multiple comparisons test
3.3. HuR regulates mitochondria co‐localization with lysosomes
Further, we analysed the involvement of HuR on mitolysosome formation under hypoxia. Figure 3A,B shows that HuR regulated hypoxia‐induced mitochondria (COX1V) co‐localization with lysosomes (LAMP2) by immunofluorescence studies. The findings show that, HuR regulated mitolysosome formation under hypoxia in renal tubular cells.
FIGURE 3.
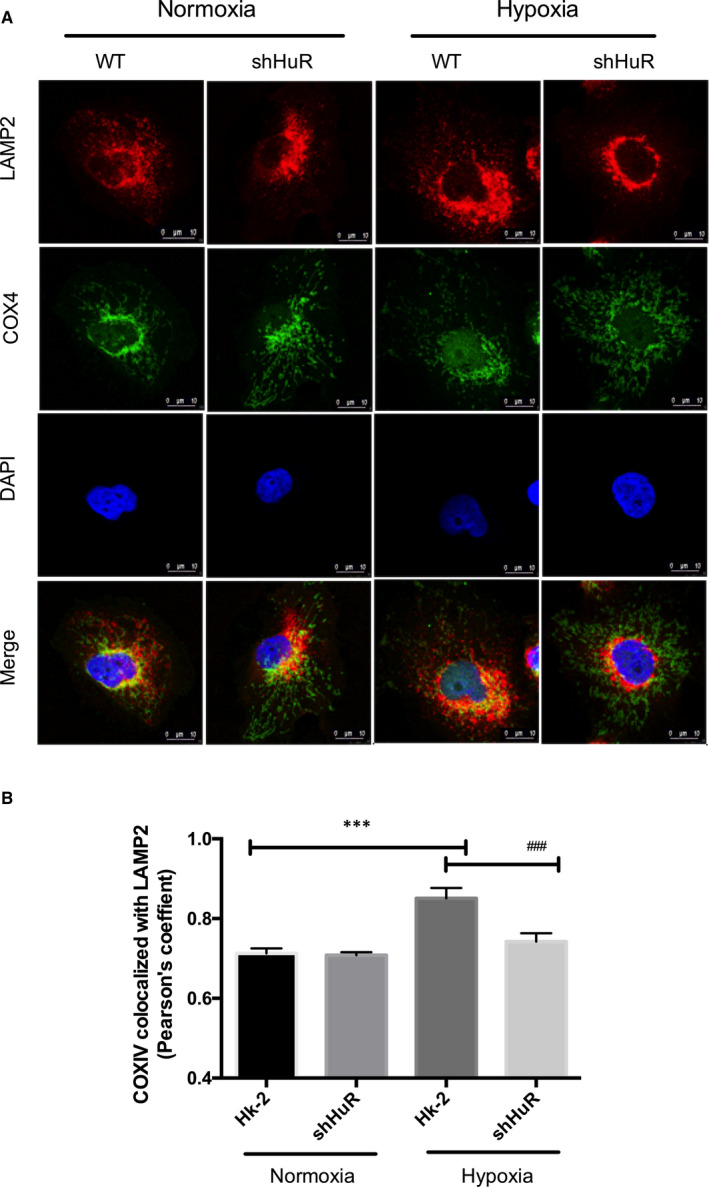
HuR regulates mitochondria co‐localization with lysosomes under hypoxia. (A) The effect of HuR on hypoxia‐induced mitolysosome in HK‐2 and shHuR cells. Immunofluorescence results showing HuR regulates LAMP2 (lysosome) co‐localization with COXIV (mitochondria). LAMP2‐Red; COXIV (green); DAPI (Blue). Scale‐10 µm, Magnification‐1,260× (B) The bar graph shows Pearson's coefficient for the co‐localization of COXIV with LAMP2. The values are mean ± SD, n = 3, ***P < .001 compared with HK‐2 normoxia, ### P < .001 compared with HK‐2‐Hypoxia, two‐way ANOVA followed by Dunnett's multiple comparisons test
3.4. HuR regulates hypoxia‐induced PARKIN expression
PARKIN/PINK1 mediates mitophagy process and removes dysfunctional mitochondria. 16 We analysed whether HuR regulates PARKIN/PINK1‐mediated mitophagy in renal tubular cells. Figure 4A,B shows that hypoxia up‐regulated PARKIN, p‐PARKIN, PINK1 expressions under hypoxia compared to control cells. However, knockdown HuR cells significantly down‐regulated the PARKIN and p‐PARKIN expressions under hypoxia. The immunofluorescence studies show that hypoxia increases mitochondrial localization of p‐PARKIN under hypoxia compared to normoxia. Further, there was significant reduction of mitochondrial p‐PARKIN in HuR knockdown cells compared to WT cells under hypoxia (Figure 4C,D). The results show that HuR regulates PARKIN expression during hypoxia‐induced mitophagy in HK‐2 cells.
FIGURE 4.
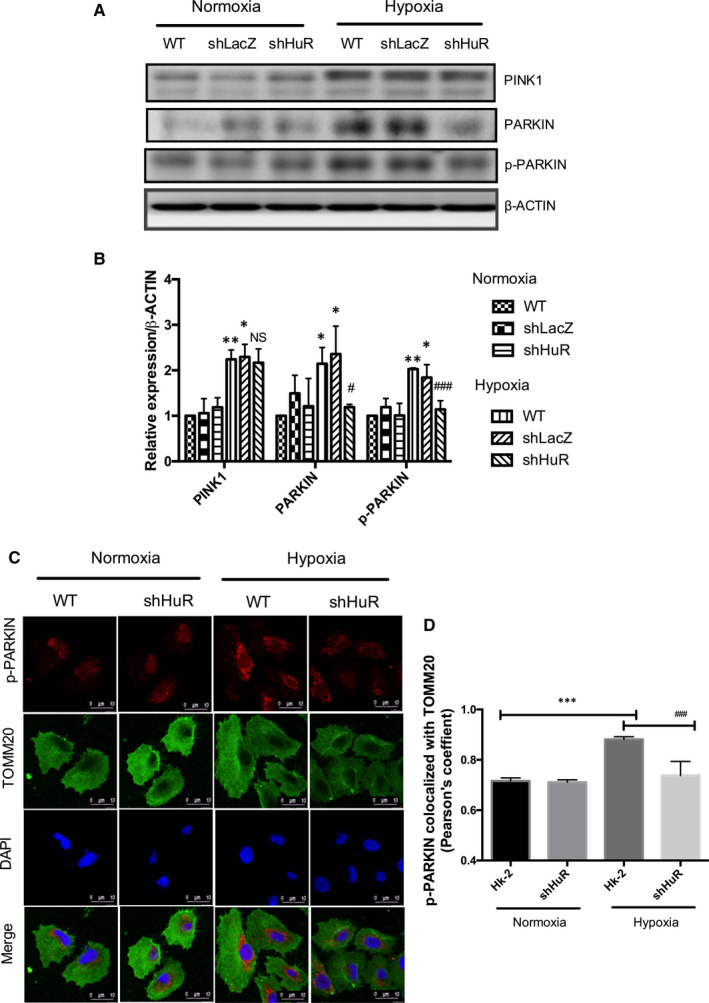
HuR regulates hypoxia‐induced p‐PARKIN/PARKIN expression. (A, B) Effect of HuR on hypoxia‐mediated mitophagy protein (PINK1, p‐PARKIN and PARKIN) expressions. The relative density of western blot results shows that shHuR cells significantly down‐regulated p‐PARKIN and PARKIN expressions compared to WT cells under hypoxia. The results are shown as mean ± SD, n = 3, *P < .05, **P < .01 compared to WT‐normoxia; non‐significant (NS), # P < .05, ### P < .001, compared to WT‐hypoxia; two‐way ANOVA followed by Sidak's multiple comparisons test. (C) Immunofluorescence showing p‐PARKIN translocation to mitochondria (TOMM20) regulated by HuR under hypoxia. p‐PARKIN‐Red; TOMM20 (green); DAPI (Blue). Scale‐10 µm, Magnification‐1260X (D) Pearson's coefficient for the co‐localization of p‐PARKIN with TOMM20. The values are mean ± SD, n = 3, ***P < .001 compared with HK‐2 normoxia, ### P < .001 compared with HK‐2‐Hypoxia, two‐way ANOVA followed by Dunnett's multiple comparisons test
3.5. HuR regulates BNIP3L expression under hypoxia
In order to assess whether HuR regulates BNIP3/BNIP3L pathway of mitophagy, we analysed their expressions in WT and shHuR cells under hypoxia. The results show that hypoxia up‐regulated BNIP3L expressions were significantly down‐regulated in HuR knockdown cells. However, HuR deficiency did not down‐regulate BNIP3 expressions under hypoxia (Figure 5A,B). To determine whether BNIP3L translocates to mitochondria under hypoxia, co‐localization studies were performed in WT and shHuR cells. The immunofluorescence results showed that knockdown HuR significantly reduced BNIP3L co‐localization with the mitochondria under hypoxia (Figure 5C,D). The findings reveal that HuR involves in the mitophagy process by regulating BNIP3L expression.
FIGURE 5.
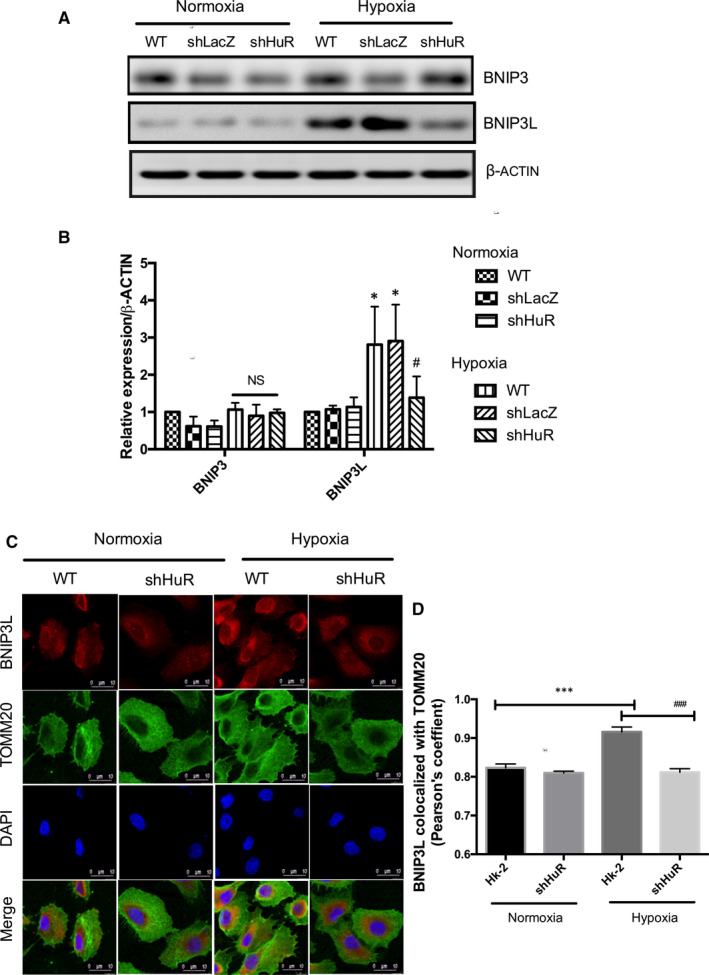
HuR regulates hypoxia‐induced BNIP3L expression. (A, B) Effect of HuR on hypoxia‐induced BNIP3 and BNIP3L expressions. The relative density of western blot results shows that shHuR cells significantly down‐regulated BNIP3L expressions compared to control cells under hypoxia. The results are shown as mean ± SD, n = 3, *P < .05, compared to WT‐normoxia; non‐significant (NS), # P < .05, compared to WT‐hypoxia; two‐way ANOVA followed by Sidak's multiple comparisons test. (C) Immunofluorescence studies on BNIP3L translocation to mitochondria (TOMM20) regulated by HuR under hypoxia. BNIP3L‐Red; TOMM20 (green); DAPI (Blue). Scale‐10 µm, Magnification‐1260X (D) Pearson's coefficient for the BNIP3L co‐localization with TOMM20. The values are mean ± SD, n = 3, ***P < .001 compared with HK‐2 normoxia, ### P < .001 compared with HK‐2‐Hypoxia, two‐way ANOVA followed by Dunnett's multiple comparisons test
3.6. HuR promotes PARKIN/BNIP3L expressions through mRNA stability
Further, to understand the mechanism of HuR‐mediated PARKIN and BNIP3L expressions, bioinformatics analysis was performed. From the AU‐Rich Element (ARE) database (https://brp.kfshrc.edu.sa/ared/Home/BasicSearch), we found that HuR binds to ARE sites on PARKIN and BNIP3L mRNA (Figure 6A). HuR bound RNAs were isolated by HuR‐IP and the results showed that HuR was significantly bound to PARKIN and BNIP3L mRNA under hypoxia conditions. (Figure 6 B‐D). To validate the effect of HuR, RNA stability experiments were performed to determine the mRNA half‐life of PARKIN and BNIP3L. Figure 6 E‐G, shows that the absence of HuR under hypoxic conditions declined the mRNA half‐life (t1/2) of PARKIN from 6 hours to <2 hours as compared to wild‐type HK‐2 cells. Similarly, HuR knockdown reduced BNIP3L half‐life (t1/2) from 6 hours to 3 hours. 7SL lncRNA, a stable lncRNA was used as a positive control. Altogether, the results show that HuR binds and stabilizes PARKIN and BNIP3L mRNA and regulates its expression under hypoxia and in the renal tubular cells.
FIGURE 6.
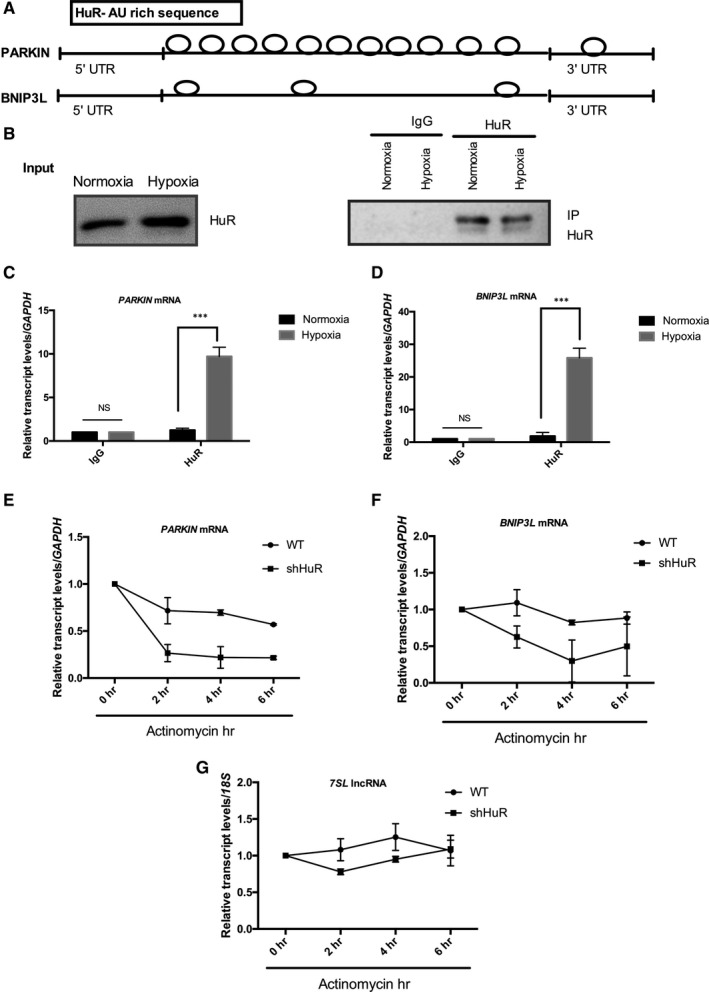
HuR regulates PARKIN and BNIP3L expressions through RNA stability. (A) Bioinformatics analysis showing HuR bound to A/U rich regions in PARKIN and BNIP3L mRNA. (B‐D) HuR RNA immunoprecipitation analysis shows PARKIN and BNIP3L mRNA were significantly bound to HuR under hypoxia. The results are shown as mean ± SD, n = 3, non‐significant (NS) between IgG under normoxia and hypoxia, ***P < .001 compared to normoxia; two‐way ANOVA followed by Sidak's multiple comparisons test. (E‐G) Effects of HuR on the mRNA stability of PARKIN and BNIP3L mRNA expressions were determined in the presence of actinomycin D. Stable lncRNA 7SL was used as control
4. DISCUSSION
The findings of the study show that hypoxia induces mitophagy in the renal tubular cells. Further, the RNA‐binding protein (HuR) regulates PARKIN and BNIP3L expressions through post‐transcriptional stabilization of mRNA (Figure 7).
FIGURE 7.
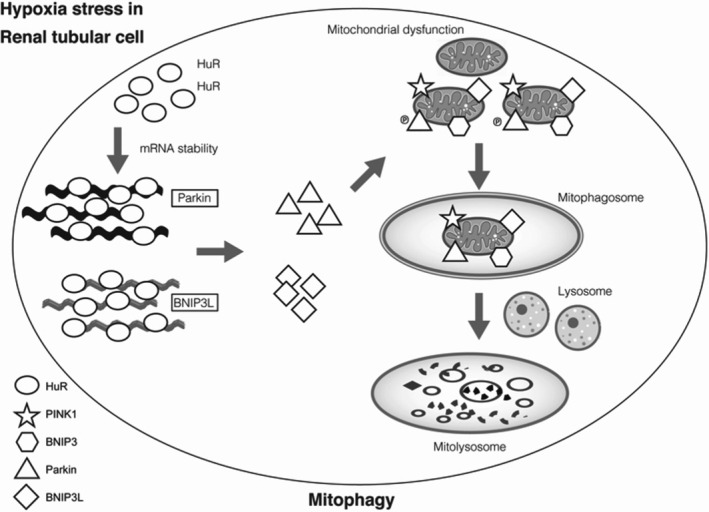
Mitophagy regulation by RNA‐Binding Protein‐HuR in HK‐2 cells
Mitochondria homeostasis plays a critical role in the pathogenesis of AKI. Mitochondria under stress undergo changes in mitochondrial membrane potential, mitochondrial biogenesis, mitochondrial fusion‐fission mechanisms and mitophagy. 31 Elevated ROS levels and mitochondrial dysfunction has been reported in cisplatin‐induced I/R injury 32 and sepsis‐associated AKI. 33 Mitochondrial ROS generation and activation of mitophagy have been demonstrated in contrast‐induced AKI. 34 The protective role of mitochondrial clearance through mitophagy has been demonstrated in kidney I/R injury. 35 In addition, several studies demonstrate the adverse effects of impaired mitophagy. 36 , 37 Notably, insufficient mitochondrial autophagy in the hyperglycaemic rats showed severe organ failure of the liver and kidney. 38 In this present study, we show a rise in oxidative stress was accompanied with up‐regulated mitophagy proteins (PARKIN, p‐PARKIN, PINK1, BNIP3 and BNIP3L) and mitophagosome formation under hypoxia in HK‐2 cells. Thus, hypoxia‐induced mitophagy might regulate mitochondrial function in renal tubular cells.
RNA‐binding proteins and its post‐transcriptional mechanisms maintain gene regulatory networks during normal physiology and pathological conditions. 39 RBPs play a crucial role during adaptive cellular responses through mitochondrial functional reprogramming. 40 RBPs are master regulators of translation efficiency and thereby maintain mitochondrial health and homeostasis. Several RBPs, including ZC3H10, SMG, LARRP, TTP, CLUH regulate oxidative phosphorylation. 41 , 42 , 43 , 44 Lin28a through its cold‐shock domain and CCHC‐type zinc fingers stimulates the translation of mitochondrial metabolic enzymes. 45 The previous study on endoplasmic reticulum (ER) induced stress showed the predominant role of HuR and TIA‐1 on the regulation of cytochrome C expression through translation enhancer and repressor function respectively. 46 HuR was found to stabilize COQ7 enzyme and thereby regulates mitochondrial function through CoQ biosynthesis. 47 Increased translation efficiency mediated by HuR on the OPA1 regulation promoted mitochondrial respiratory activity and the findings emphasis the role of HuR in mitochondrial physiology. 48 Previously findings from our group report on the role of HuR in the up‐regulation of autophagy and suppression of apoptosis under hypoxic stress. 30 Here, we show that silencing HuR expression abolished hypoxia‐regulated mitophagy through the decreased formation of mitophagosome and mitolysosome. Thus, HuR might regulate hypoxia‐induced cell stress in renal tubular cells through enhanced mitophagy.
Mitophagy is regulated by PINK1/PARKIN and BNIP3/BNIP3L dependent pathways. PINK1, PTEN‐induced Kinase 1 acts as a sensor for depolarized mitochondria and recruits cytosolic PARKIN, RBR E3 ubiquitin‐protein ligase. The recruited PARKIN in the mitochondria ubiquitinates outer mitochondrial membrane proteins and directs for autophagic degradation. 49 The other pathway involves BNIP3L/NIX and BNIP3, which belong to the family of BH3‐only Bcl‐2 pro‐apoptotic proteins. Under mitophagy activation, BNIP3 and BNIP3L translocate to the dysfunctional mitochondria and interact with LC3/GABARAP proteins at their N‐terminal site to promote mitochondrial degradation. 50 In this study, we show evidence that HuR regulates PARKIN and BNIP3L protein expressions under hypoxic conditions. Increased HuR binding and RNA stabilization of PARKIN and BNIP3L mRNA promoted its expression under hypoxia. The importance of PARK2‐mediated mitophagy induction in sepsis‐induced acute kidney injury (SI‐AKI) has been demonstrated earlier. 51 PINK1 and PARKIN knockdown studies in CI‐AKI showed the protective role of PINK1‐PARKIN‐mediated mitophagy in reducing oxidative stress and NLRP3 inflammasome‐mediated apoptosis. 52 Protective role of PINK1/PARKIN‐mediated mitophagy in cisplatin‐induced AKI, renal ischemia‐reperfusion injury and renal epithelial cell injury has been reported in PINK1 and PARKIN knockout (KO) models. 53 , 54 , 55 BNIP3/BNIP3L family of proteins are regarded as mitochondrial stress sensors. 56 BNIP3/NIX‐mediated mitophagy and ROS removal regulated NK cell survival and memory. 57 Yuan and colleagues in 2017 demonstrated the neuroprotective roles of BNIP3L against ischaemic brain injury through the regulation of mitophagy. 58 The present findings highlight that HuR regulates mitophagy in renal tubular cells through post‐transcriptional mRNA stabilization of PARKIN/BNIP3L.
5. CONCLUSION
In conclusion, hypoxia induces mitophagy through mitophagosome and mitolysosome formation in renal tubular cells. The findings show that RNA‐binding protein‐HuR regulates mitophagy through RNA stabilization of PARKIN and BNIP3L expressions.
CONFLICT OF INTEREST
The authors confirm that there are no conflicts of interest.
AUTHOR CONTRIBUTIONS
Shao‐Hua Yu: Conceptualization (lead); Data curation (equal); Funding acquisition (lead); Investigation (lead); Methodology (lead); Resources (equal); Supervision (equal); Validation (equal); Writing‐original draft (lead); Writing‐review & editing (equal). Kalaiselvi Palanisamy: Conceptualization (lead); Data curation (equal); Formal analysis (equal); Funding acquisition (supporting); Methodology (lead); Validation (equal); Visualization (equal); Writing‐original draft (lead); Writing‐review & editing (equal). Kuo‐Ting Sun : Conceptualization (lead); Funding acquisition (lead); Investigation (lead); Methodology (equal); Resources (lead); Supervision (lead); Visualization (lead); Writing‐review & editing (equal). Xin Li: Data curation (supporting); Formal analysis (equal); Methodology (equal); Software (equal); Validation (equal); Visualization (equal). Yao‐Ming Wang : Investigation (equal); Project administration (equal); Resources (equal); Supervision (equal); Visualization (equal). Feng‐Yen Lin: Formal analysis (equal); Investigation (equal); Project administration (equal); Visualization (equal). Kuen‐Bao Chen: Formal analysis (equal); Project administration (equal); Resources (supporting); Visualization (equal). I‐Kuan Wang: Conceptualization (equal); Funding acquisition (lead); Investigation (equal); Project administration (equal); Resources (lead); Supervision (lead). Tung‐Min Yu: Conceptualization (equal); Funding acquisition (lead); Project administration (lead); Resources (lead); Supervision (lead); Visualization (equal). Chi yuan Li: Conceptualization (equal); Funding acquisition (lead); Investigation (lead); Resources (lead); Supervision (lead); Writing‐review & editing (lead).
ACKNOWLEDGEMENTS
This work was supported by a grant from the Ministry of Science and Technology, Taiwan, Grant/Award Numbers: MOST 107‐2314‐B‐039‐054‐MY2, MOST 106‐2314‐B‐039‐013‐MY3, MOST 108‐2811‐B‐039‐508; China Medical University Hospital, Grant/Award Number: CMUH DMR‐109‐060, DMR‐108‐202.
Yu S‐H, Palanisamy K, Sun K‐T, et al. Human antigen R regulates hypoxia‐induced mitophagy in renal tubular cells through PARKIN/BNIP3L expressions. J Cell Mol Med. 2021;25:2691–2702. 10.1111/jcmm.16301
Shao‐Hua Yu, Kalaiselvi Palanisamy and Kuo‐Ting Sun: Joint first author
I‐Kuan Wang, Tung‐Min Yu and Chi‐Yuan Li: Joint corresponding author
DATA AVAILABILITY STATEMENT
The data used to support the findings of this study are available from the corresponding author upon reasonable request.
REFERENCES
- 1. Che R, Yuan Y, Huang S, Zhang A. Mitochondrial dysfunction in the pathophysiology of renal diseases. Am J Physiol Renal Physiol. 2014;306:F367‐F378. [DOI] [PubMed] [Google Scholar]
- 2. Makris K, Spanou L. Acute kidney injury: definition, pathophysiology and clinical phenotypes. Clin Biochem Rev. 2016;37:85‐98. [PMC free article] [PubMed] [Google Scholar]
- 3. Pan JS, Sheikh‐Hamad D. Mitochondrial dysfunction in acute kidney injury and sex‐specific implications. Med Res Arch. 2019;7:1898. [DOI] [PMC free article] [PubMed] [Google Scholar]
- 4. Xiao X, Hu Y, Quirós PM, Wei Q, López‐Otín C, Dong Z. OMA1 mediates OPA1 proteolysis and mitochondrial fragmentation in experimental models of ischemic kidney injury. Am J Physiol Renal Physiol. 2014;306:F1318‐F1326. [DOI] [PMC free article] [PubMed] [Google Scholar]
- 5. Parikh SM, Yang Y, He L, Tang C, Zhan M, Dong Z. Mitochondrial function and disturbances in the septic kidney. Semin Nephrol. 2015;35:108‐119. [DOI] [PMC free article] [PubMed] [Google Scholar]
- 6. Kruidering M, de Van Water B, de Heer E, Mulder GJ, Nagelkerke JF. Cisplatin‐induced nephrotoxicity in porcine proximal tubular cells: mitochondrial dysfunction by inhibition of complexes I to IV of the respiratory chain. J Pharmacol Exp Ther. 1997;280:638‐649. [PubMed] [Google Scholar]
- 7. Yang Y, Liu H, Liu F, Dong Z. Mitochondrial dysregulation and protection in cisplatin nephrotoxicity. Arch Toxicol. 2014;88:1249‐1256. [DOI] [PMC free article] [PubMed] [Google Scholar]
- 8. Zhan M, Brooks C, Liu F, Sun L, Dong Z. Mitochondrial dynamics: regulatory mechanisms and emerging role in renal pathophysiology. Kidney Int. 2013;83:568‐581. [DOI] [PMC free article] [PubMed] [Google Scholar]
- 9. Agarwal A, Dong Z, Harris R, et al. Cellular and molecular mechanisms of AKI. J Am Soc Nephrol. 2016;27:1288‐1299. [DOI] [PMC free article] [PubMed] [Google Scholar]
- 10. Bhargava P, Schnellmann RG. Mitochondrial energetics in the kidney. Nat Rev Nephrol. 2017;13:629‐646. [DOI] [PMC free article] [PubMed] [Google Scholar]
- 11. Wang Y, Cai J, Tang C, Dong Z. Mitophagy in acute kidney injury and kidney repair. Cells. 2020;9:338. [DOI] [PMC free article] [PubMed] [Google Scholar]
- 12. Palikaras K, Lionaki E, Tavernarakis N. Mechanisms of mitophagy in cellular homeostasis, physiology and pathology. Nat Cell Biol. 2018;20:1013‐1022. [DOI] [PubMed] [Google Scholar]
- 13. Tang C, He L, Liu J, Dong Z. Mitophagy: basic mechanism and potential role in kidney diseases. Kidney Dis (Basel). 2015;1:71‐79. [DOI] [PMC free article] [PubMed] [Google Scholar]
- 14. Ishimoto Y, Inagi R. Mitochondria: a therapeutic target in acute kidney injury. Nephrol Dial Transplant. 2016;31:1062‐1069. [DOI] [PubMed] [Google Scholar]
- 15. Bhatia D, Choi ME. The emerging role of mitophagy in kidney diseases. J Life Sci (Westlake Village). 2019;1:13‐22. [DOI] [PMC free article] [PubMed] [Google Scholar]
- 16. Deas E, Wood NW, Plun‐Favreau H. Mitophagy and Parkinson's disease: the PINK1‐parkin link. Biochim Biophys Acta. 2011;1813:623‐633. [DOI] [PMC free article] [PubMed] [Google Scholar]
- 17. Tang C, Han H, Liu Z, et al. Activation of BNIP3‐mediated mitophagy protects against renal ischemia‐reperfusion injury. Cell Death Dis. 2019;10:677. [DOI] [PMC free article] [PubMed] [Google Scholar]
- 18. Gunst J, Derese I, Aertgeerts A, et al. Insufficient autophagy contributes to mitochondrial dysfunction, organ failure, and adverse outcome in an animal model of critical illness. Crit Care Med. 2013;41:182‐194. [DOI] [PubMed] [Google Scholar]
- 19. Namba T, Takabatake Y, Kimura T, et al. Autophagic clearance of mitochondria in the kidney copes with metabolic acidosis. J Am Soc Nephrol. 2014;25:2254‐2266. [DOI] [PMC free article] [PubMed] [Google Scholar]
- 20. Cui J, Shi S, Sun X, et al. Mitochondrial autophagy involving renal injury and aging is modulated by caloric intake in aged rat kidneys. PLoS One. 2013;8:e69720. [DOI] [PMC free article] [PubMed] [Google Scholar]
- 21. Liu JX, Yang C, Zhang WH, et al. Disturbance of mitochondrial dynamics and mitophagy in sepsis‐induced acute kidney injury. Life Sci. 2019;235:e116828. [DOI] [PubMed] [Google Scholar]
- 22. Bhatia D, Chung KP, Nakahira K, et al. Mitophagy‐dependent macrophage reprogramming protects against kidney fibrosis. JCI Insight. 2019;4:e132826. [DOI] [PMC free article] [PubMed] [Google Scholar]
- 23. García‐Mauriño SM, Rivero‐Rodríguez F, Velázquez‐Cruz A, et al. RNA binding protein regulation and cross‐talk in the control of AU‐rich mRNA fate. Front Mol Biosci. 2017;4:71. [DOI] [PMC free article] [PubMed] [Google Scholar]
- 24. Otsuka H, Fukao A, Funakami Y, Duncan KE, Fujiwara T. Emerging evidence of translational control by AU‐rich element‐binding proteins. Front Genet. 2019;10:332. [DOI] [PMC free article] [PubMed] [Google Scholar]
- 25. Bhattacharyya SN, Habermacher R, Martine U, Closs EI, Filipowicz W. Relief of microRNA‐mediated translational repression in human cells subjected to stress. Cell. 2006;125:1111‐1124. [DOI] [PubMed] [Google Scholar]
- 26. Grimson A, Farh KK, Johnston WK, Garrett‐Engele P, Lim LP, Bartel DP. MicroRNA targeting specificity in mammals: determinants beyond seed pairing. Mol Cell. 2007;27:91‐105. [DOI] [PMC free article] [PubMed] [Google Scholar]
- 27. Hausser J, Landthaler M, Jaskiewicz L, Gaidatzis D, Zavolan M. Relative contribution of sequence and structure features to the mRNA binding of Argonaute/EIF2C‐miRNA complexes and the degradation of miRNA targets. Genome Res. 2009;19:2009‐2020. [DOI] [PMC free article] [PubMed] [Google Scholar]
- 28. Srikantan S, Gorospe M. HuR function in disease. Front Biosci (Landmark Ed). 2012;17:189‐205. [DOI] [PMC free article] [PubMed] [Google Scholar]
- 29. Schatton D, Rugarli EI. A concert of RNA‐binding proteins coordinates mitochondrial function. Crit Rev Biochem Mol Biol. 2018;53:652‐666. [DOI] [PubMed] [Google Scholar]
- 30. Palanisamy K, Tsai TH, Yu TM, et al. RNA‐binding protein, human antigen R regulates hypoxia‐induced autophagy by targeting ATG7/ATG16L1 expressions and autophagosome formation. J Cell Physiol. 2019;234:7448‐7458. [DOI] [PubMed] [Google Scholar]
- 31. Ralto KM, Parikh SM. Mitochondria in acute kidney injury. Semin Nephrol. 2016;36:8‐16. [DOI] [PMC free article] [PubMed] [Google Scholar]
- 32. Brooks C, Wei Q, Cho SG, Dong Z. Regulation of mitochondrial dynamics in acute kidney injury in cell culture and rodent models. J Clin Invest. 2009;119:1275‐1285. [DOI] [PMC free article] [PubMed] [Google Scholar]
- 33. Tran M, Tam D, Bardia A, et al. PGC‐1α promotes recovery after acute kidney injury during systemic inflammation in mice. J Clin Invest. 2011;121:4003‐4014. [DOI] [PMC free article] [PubMed] [Google Scholar]
- 34. Lei R, Zhao F, Tang CY, et al. Mitophagy plays a protective role in iodinated contrast‐induced acute renal tubular epithelial cells injury. Cell Physiol Biochem. 2018;46:975‐985. [DOI] [PubMed] [Google Scholar]
- 35. Ishihara M, Urushido M, Hamada K, et al. Sestrin‐2 and BNIP3 regulate autophagy and mitophagy in renal tubular cells in acute kidney injury. Am J Physiol Renal Physiol. 2013;305:F495‐F509. [DOI] [PubMed] [Google Scholar]
- 36. Saxena S, Mathur A, Kakkar P. Critical role of mitochondrial dysfunction and impaired mitophagy in diabetic nephropathy. J Cell Physiol. 2019;234:19223‐19236. [DOI] [PubMed] [Google Scholar]
- 37. Luciani A, Schumann A, Berquez M, et al. Impaired mitophagy links mitochondrial disease to epithelial stress in methylmalonyl‐CoA mutase deficiency. Nat Commun. 2020;11:970. [DOI] [PMC free article] [PubMed] [Google Scholar]
- 38. Gunst J, Derese I, Aertgeerts A, Ververs EJ, Wauters A. Van den Berghe G, Vanhorebeek I. Insufficient autophagy relates to mitochondrial dysfunction, organ failure and adverse outcome in an animal model of critical illness. Crit Care. 2012;16:P11. [DOI] [PubMed] [Google Scholar]
- 39. Hentze MW, Castello A, Schwarzl T, Preiss T. A brave new world of RNA‐binding proteins. Nat Rev Mol Cell Biol. 2018;19:327‐341. [DOI] [PubMed] [Google Scholar]
- 40. Schatton D, Pla‐Martin D, Marx MC, et al. CLUH regulates mitochondrial metabolism by controlling translation and decay of target mRNAs. J Cell Biol. 2017;216:675‐693. [DOI] [PMC free article] [PubMed] [Google Scholar]
- 41. Audano M, Pedretti S, Cermenati G, et al. Zc3h10 is a novel mitochondrial regulator. EMBO Rep. 2018;19:e45531. [DOI] [PMC free article] [PubMed] [Google Scholar]
- 42. Aviv T, Lin Z, Lau S, Rendl LM, Sicheri F, Smibert CA. The RNA‐binding SAM domain of Smaug defines a new family of post‐transcriptional regulators. Nat Struct Mol Biol. 2003;10:614‐621. [DOI] [PubMed] [Google Scholar]
- 43. Bousquet‐Antonelli C, Deragon J‐M. A comprehensive analysis of the La‐motif protein superfamily. RNA. 2009;15:750‐764. [DOI] [PMC free article] [PubMed] [Google Scholar]
- 44. Brooks SA, Blackshear PJ. Tristetraprolin (TTP): interactions with mRNA and proteins, and current thoughts on mechanisms of action. Biochem Biophys Acta. 2013;1829:666‐679. [DOI] [PMC free article] [PubMed] [Google Scholar]
- 45. Shyh‐Chang N, Zhu H, de Yvanka Soysa T, et al. Lin28 enhances tissue repair by reprogramming cellular metabolism. Cell. 2013;155:778‐792. [DOI] [PMC free article] [PubMed] [Google Scholar]
- 46. Kawai T, Lal A, Yang X, Galban S, Mazan‐Mamczarz K, Gorospe M. Translational control of cytochrome c by RNA‐binding proteins TIA‐1 and HuR. Mol Cell Biol. 2006;26:3295‐3307. [DOI] [PMC free article] [PubMed] [Google Scholar]
- 47. Cascajo MV, Abdelmohsen K, Noh JH, et al. RNA‐binding proteins regulate cell respiration and coenzyme Q biosynthesis by post‐transcriptional regulation of COQ7. RNA Biol. 2016;13:622‐634. [DOI] [PMC free article] [PubMed] [Google Scholar]
- 48. Carrascoso I, Alcalde J, Sánchez‐Jiménez C, González‐Sánchez P, Izquierdo JM. T‐cell intracellular antigens and Hu antigen R antagonistically modulate mitochondrial activity and dynamics by regulating optic atrophy 1 gene expression. Mol Cell Biol. 2017;37:e00174‐17. [DOI] [PMC free article] [PubMed] [Google Scholar]
- 49. Jin SM, Youle RJ. PINK1‐ and Parkin‐mediated mitophagy at a glance. J Cell Sci. 2012;125:795‐799. [DOI] [PMC free article] [PubMed] [Google Scholar]
- 50. Zhang J, Ney PA. Role of BNIP3 and NIX in cell death, autophagy, and mitophagy. Cell Death Differ. 2009;16:939‐946. [DOI] [PMC free article] [PubMed] [Google Scholar]
- 51. Gao Y, Dai X, Li Y, et al. Role of Parkin‐mediated mitophagy in the protective effect of polydatin in sepsis‐induced acute kidney injury. J Transl Med. 2020;18:114. [DOI] [PMC free article] [PubMed] [Google Scholar]
- 52. Lin Q, Li S, Jiang N, et al. PINK1‐parkin pathway of mitophagy protects against contrast‐induced acute kidney injury via decreasing mitochondrial ROS and NLRP3 inflammasome activation. Redox Biol. 2019;26:e101254. [DOI] [PMC free article] [PubMed] [Google Scholar]
- 53. Zhao C, Chen Z, Xu X, et al. Pink1/Parkin‐mediated mitophagy play a protective role in cisplatin induced renal tubular epithelial cells injury. Exp Cell Res. 2017;350:390‐397. [DOI] [PubMed] [Google Scholar]
- 54. Tang C, Han H, Yan M, et al. PINK1‐PRKN/PARK2 pathway of mitophagy is activated to protect against renal ischemia‐reperfusion injury. Autophagy. 2018;14:880‐897. [DOI] [PMC free article] [PubMed] [Google Scholar]
- 55. Wang Y, Tang C, Cai J, et al. PINK1/Parkin‐mediated mitophagy is activated in cisplatin nephrotoxicity to protect against kidney injury. Cell Death Dis. 2018;9:1113. [DOI] [PMC free article] [PubMed] [Google Scholar]
- 56. Chinnadurai G, Vijayalingam S, Gibson SB. BNIP3 subfamily BH3‐only proteins: mitochondrial stress sensors in normal and pathological functions. Oncogene. 2008;27(Suppl 1):S114‐S127. [DOI] [PMC free article] [PubMed] [Google Scholar]
- 57. O'Sullivan TE, Johnson LR, Kang HH, Sun JC. BNIP3‐ and BNIP3L‐mediated mitophagy promotes the generation of natural killer cell memory. Immunity. 2015;43:331‐342. [DOI] [PMC free article] [PubMed] [Google Scholar]
- 58. Yuan Y, Zheng Y, Zhang X, et al. BNIP3L/NIX‐mediated mitophagy protects against ischemic brain injury independent of PARK2. Autophagy. 2017;13:1754‐1766. [DOI] [PMC free article] [PubMed] [Google Scholar]
Associated Data
This section collects any data citations, data availability statements, or supplementary materials included in this article.
Data Availability Statement
The data used to support the findings of this study are available from the corresponding author upon reasonable request.


