

Abstract
Purpose:
The aim of our study was to evaluate the macular pigment optical density in patients with acute and chronic central serous chorioretinopathy and to describe the association between central retinal thickness and choroidal thickness with the macular pigment optical density.
Materials and Methods:
Eyes with acute central serous chorioretinopathy and chronic central serous chorioretinopathy (patients, who were diagnosed as having disease activity for 6 months) were included in this study. Macular pigment was measured using the heterochromatic flicker technique of the MPS II device for both eyes in patients with acute and chronic central serous chorioretinopathy and in control subjects.
Results:
Twenty-seven eyes with acute central serous chorioretinopathy, 23 eyes with chronic central serous chorioretinopathy, and 25 control eyes were enrolled. The mean macular pigment optical density in chronic central serous chorioretinopathy (0.480 ± 0.16 density unit (95% confidence interval: 0.390–0.570) was found to be significantly lower than in the control eyes (0.571 ± 0.128 density unit) (95% confidence interval: 0.480–0.670) (p = 0.007). In correlation analysis, no significant association was detected between the central retinal thickness, choroidal thickness, and macular pigment optical density values in central serous chorioretinopathy group (p = 0.31, p = 0.71).
Conclusion:
Macular pigment optical density levels were significantly lower in chronic central serous chorioretinopathy patients than in controls, possibly due to degeneration of the neurosensorial retina, as a result of the long-term persistence of subretinal fluid. There was not a significant correlation between choroidal thickness and macular pigment optical density levels in central serous chorioretinopathy group.
Keywords: Central retinal thickness, central serous chorioretinopathy, choroidal thickness, macular pigment optical density
Introduction
Central serous chorioretinopathy (CSC) is characterized by serous detachment of the sensorial retina and affects the macula in the majority of cases. Patients present with variable loss of vision, metamorphopsia, and reduced scotopic sensitivity. In the etiology, male sex, type A personality, use of steroids, and pregnancy have been suggested.1,2 There are several accepted theories about the pathogenesis of CSC, including choroidal vascular alterations and retinal pigment epithelial dysfunction. These are supported by fluorescein angiography (FA) and enhanced depth imaging optical coherence tomography (OCT) findings.3,4 High levels of glucocorticoids and catecholamines, Helicobacter pylori and genetic factors have also been associated with CSC.1
CSC may present with an acute or chronic course. The presence of subretinal fluid for more than 6 months is considered chronic CSC.1 Acute presentation tends to resolve spontaneously and generally does not damage the retinal structures. However, chronic disease leads to diffuse retinal pigment epitheliopathy, photoreceptor damage, and a higher risk of choroidal neovascularization development.5
Macular carotenoids such as lutein, zeaxanthin, and meso-zeaxanthin are distributed in the Henle fiber layer, in the fovea, and in the inner nuclear layer at the parafoveal region. They have anti-oxidative functions in the macula.6 Several studies have reported on the role of macular pigments in various diseases, such as diabetic retinopathy, retinopathy of prematurity, age-related macular degeneration (AMD), cataract, and CSC. Low macular pigment optical density (MPOD) has been shown to be associated with AMD in the Japanese population.7,8 The amount and distribution of macular pigment is thought to be associated with ethnicity.9–11 However, the presence of an association between macular pigment density and the age, sex, and smoking status is controversial.12
The aim of our study was to evaluate the MPOD in patients with acute and chronic CSC and to describe the association between central retinal thickness (CRT) and choroidal thickness (CT) with the MPOD in CSC patients.
Materials and methods
48 consecutive patients (31 men and 17 women) diagnosed with CSC from March 2017 to March 2018 and 25 healthy controls (15 men and 10 women) were enrolled.
Patients who were found to have serous macular detachment during fundus examination and spectral domain-OCT imaging were included in the study. Eyes with other retinal disorders leading to serous detachment of the macula, such as AMD, retinal detachment, diabetic retinopathy, or retinal vein occlusion were excluded by a detailed fundus examination. Subjects taking supplements containing lutein and zeaxanthin were excluded. Patients who had previously received subthreshold laser therapy were also excluded.
All patients underwent a complete ophthalmic examination, including measurement of best-corrected visual acuity (BCVA) with a Snellen chart, slit-lamp biomicroscopy and fundus examination with a 90-D lens, measurement of intraocular pressure, color fundus photography, fundus autofluorescence, and spectral-domain OCT imaging (Cirrus; Carl Zeiss Meditec, Dublin, CA, USA). After the spectral-domain OCT images were obtained, CRT was measured as the vertical distance between the inner limiting membrane and the surface of the retinal pigment epithelium (RPE). CT was measured using the enhanced depth imaging mode of OCT at the subfoveal region. It was measured as the vertical distance between the outer border of the hyperreflective line corresponding to the RPE and the inner surface of the sclera. The choroidal and retinal thickness measurements were taken manually and the measurements taken during a single session were evaluated.
In patients with acute CSC, FA was performed to determine the leakage area. The presence of RPE damage was determined by evaluating color fundus photographs or the FA images. If the size of the areas with RPE damage was 5 disc areas or more, the eye was described as having diffuse RPE damage. In eyes with subretinal detachment (SRD), the size of the SRD area was measured from the fundus photograph.
Macular pigment was measured using the MPS II (Electron Technology, Topcon, UK) device that uses a novel heterochromatic flicker technique (HFP) to measure MPOD. The MPS II device is widely accepted as a quick, consistent, and repeatable screening tool for monitoring and assessing the efficacy of lutein/zeaxanthin uptake. All measurements were performed by the same investigator (B.P.G.). One limitation of this method is that it requires the subject to fixate on the target and follow the operator’s instructions. The test was repeated until the results were complete.
Statistical analysis was performed using the SPSS v18 software (SPSS Inc., Chicago, IL, USA). The Kruskal–Wallis test was used for comparing groups in terms of MPOD values. The Bonferroni test with a p value of 0.0167 was used for post hoc analysis. Spearman’s rank-correlation test was used to evaluate the relationship between MPOD and the age, SRD size, CRT, and CT. The threshold for statistical significance was p < 0.05.
Results
48 CSC patients (31 men, 17 women) and 25 healthy subjects (15 men, 10 women) were included in the study. There were 27 affected eyes among 27 patients in the acute CSC group and 23 affected eyes among 21 patients in the chronic CSC group. Two patients had bilateral chronic CSC. The fellow eyes were also evaluated. The control group included 50 eyes of 25 patients. The acute CSC group consisted of 17 men (63%) and 10 women (37%), while the chronic CSC group contained 14 men (67%) and 7 women (33%). The mean age in the acute CSC group, the chronic CSC group, and the control group was 40.0 ± 7.47 years, 43.9 ± 9.91 years, and 44.7 ± 6.21 years, respectively (Table 1).
Table 1.
Baseline characteristics.
| Acute CSC (n = 27) | Chronic CSC (n = 21) | Control (n = 25) | |||
|---|---|---|---|---|---|
| Affected eyes | Fellow eyes | Affected eyes | Fellow eyes | ||
| Number of eyes | 27 | 27 | 23 | 19 | 50 |
| Age (years, mean ± SD) | 40.0 ± 7.47 | 43.9 ± 9.91 | 44.7 ± 6.21 | ||
| Sex (F/M) | 10/17 | 7/14 | 10/15 | ||
| SRD (yes/no) | 21/27 | 0/27 | 15/23 | 0/19 | 0 |
| Size of SRD (disc area, mean ± SD) | 1.9 ± 0.7 | 1.5 ± 0.6 | 0 | ||
| Smoking (yes/no) | 18/27 | 16/21 | 22/50 | ||
| RPE damage | 19/27 | 3/27 | 15/23 | 7/19 | 0 |
| Diffuse RPE atrophy | 0/27 | 0/27 | 3/23 | 2/19 | 0 |
| Duration (months, mean ± SD) | 2.56 ± 1.3 | 11.6 ± 7.4 | 0 | ||
CSC, central serous chorioretinopathy; SRD, subretinal detachment; RPE, retinal pigment epithelium.
The OCT images revealed RPE damage in 19 eyes (70%) on OCT images among the affected eyes with acute CSC. In the chronic CSC group, 15 eyes had RPE damage (65%), 3 eyes had diffuse RPE atrophy (13%), and 5 eyes had both RPE damage and diffuse RPE atrophy (22%) (Figure 1). No statistically significant difference was found between the acute and chronic CSC groups in terms of RPE damage (p = 0.62).
Figure 1.

(a–c) Spectral-domain OCT images from acute CSC, chronic CSC, and control group, respectively.
The mean MPOD, CRT, and CT values in three groups are depicted in Table 2.
Table 2.
Mean MPOD, CRT, and CT values in three groups.
| Acute CSC (n = 27) | Chronic CSC (n = 21) | Control eyes (n = 25) | |||
|---|---|---|---|---|---|
| Affected eyes | Fellow eyes | Affected eyes | Fellow eyes | ||
| MPOD | 0.491 ± 0.22 | 0.548 ± 0.17a | 0.480 ± 0.16 | 0.499 ± 0.15 | 0.571 ± 0.128a |
| CRT | 258.40 ± 50.17b | 243.80 ± 36.61 | 244.40 ± 46.75 | 235.20 ± 41.63 | 243.20 ± 34.7b |
| CT | 322.20 ± 60.25c | 260.20 ± 48.79 | 303.20 ± 70.07 | 278.93 ± 78.71 | 281 ± 39.77c |
CRT, central retinal thickness, µm; CSC, central serous chorioretinopathy; CT, choroidal thickness, µm; MPOD, macular pigment optical density.
p = 0.007; bp = 0.014; cp = 0.016, Mann–Whitney U test.
MPOD in CSC and control eyes
There was no statistically significant difference between MPOD in the affected eyes and the fellow eyes in the acute CSC group (p = 0.69). Likewise, MPOD in the eyes affected with chronic CSC did not significantly differ from MPOD in the fellow eyes (p = 0.22). No statistical difference was found between MPOD values when eyes with acute CSC or the fellow eyes were compared with the eyes in the control group (p = 0.07 and p = 0.83, respectively). MPOD was found to be significantly lower in the eyes with chronic CSC than in the controls (p = 0.007). There was no statistically significant difference between MPOD in the fellow eyes of the chronic CSC group and the eyes of the controls (p = 0.064) and there was also no statistically significant difference between eyes with acute CSC and those with chronic CSC (p = 0.848) (Figure 2).
Figure 2.

MPOD in acute and chronic CSC and in the control group.
The MPOD was significantly lower in eyes with chronic CSC (*p = 0.007).
Covariates in all eyes affecting MPOD
The CRT value was found thicker in the affected eyes with acute CSC than in the controls (p = 0.014). No statistically significant difference was found between the CRT values of the fellow eyes with acute CSC and the control group (p = 0.62). The CRT value did not differ significantly when the affected eyes with chronic CSC and fellow eyes were compared with the control group (p = 0.09 and p = 0.31, respectively). There was no statistically significant difference in CRT value between the eyes with acute CSC and those with chronic CSC (p = 0.436) (Figure 3). The correlation analysis between the CRT and MPOD values revealed no statistical significance (p = 0.31).
Figure 3.

The correlation analysis between MPOD (DU) and central retinal thickness (µm) in acute and chronic CSC (p = 0.31).
The CT was statistically thicker in affected eyes with acute CSC than in the control group (p = 0.016). The difference in CT values between the fellow eyes in patients with chronic CSC and the control eyes was not significant (p = 0.133) CT in the affected eyes with chronic CSC and the fellow eyes did not differ significantly from that in the control group (p = 0.181 and p = 0.907, respectively). The mean CT was higher in the affected eyes with acute CSC than in the affected eyes with chronic CSC, but without statistical significance (p = 0.465) (Figure 4). There was no statistically significant correlation between CT and MPOD values in any group (p = 0.71).
Figure 4.
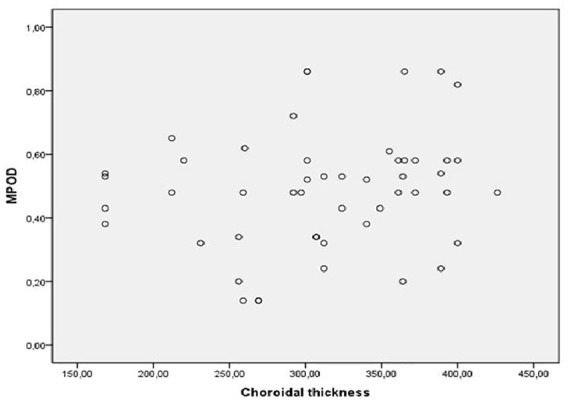
The correlation analysis between MPOD (DU) and choroidal thickness (µm) in acute and chronic CSC (p = 0.71).
We found no statistically significant association between the MPOD values and the sex, age, and smoking status of the subjects. Correlation analysis was used to determine the relationship between MPOD and the age, SRD size, CRT, and CT in acute and chronic cases and revealed no significant correlation (Table 3).
Table 3.
Correlation table between MPOD and covariates in acute and chronic CSC (n = 48).
| Selected variable | r | p |
|---|---|---|
| Age | 0.09 | 0.64 |
| Size of the subretinal detachment | 0.23 | 0.21 |
| Central retinal thickness | 0.18 | 0.31 |
| Choroidal thickness | 0.06 | 0.71 |
CSC, central serous chorioretinopathy; MPOD, macular pigment optical density.
Discussion
Macular pigment is mainly composed of carotenoid pigments including lutein, zeaxanthin, and meso-zeaxanthin. The functions of macular carotenoids can be summarized as blue-light filtration effects including glare reduction, decrease in chromatic aberration, improving fine detail distinction, and enhancing contrast, and anti-oxidant effects including acting as scavengers of free radicals and neutralizing singlet oxygen.13 MPOD can be measured by several in vivo and ex vivo techniques. In vivo modalities include physical (optical) techniques such as fundus reflectance spectroscopy, Raman spectrometry, and autofluorescence spectrometry, in addition to psychophysical techniques such as heterochromatic flicker photometry (HFP) and motion detection photometry.14
HFP is the best-known and commonly used method and employs the subjective psychophysical technique. It calculates MPOD based on the luminance ratio of the short wavelength blue light presented at the macula compared with that presented at the peripheral retina. This system needs blue light with a maximum level close to the macular pigment maximum absorption level in addition to green light as a stimulant. The luminance of the two wavelengths is not perceived as equal and the combined stimulus therefore appears to flicker. The calculation of MPOD is obtained by taking the logarithm of the proportion of blue-light intensities at the foveal and perifoveal locations with maximum and minimum levels of macular pigment. This repeatable, noninvasive method is reported to be highly correlated with fundus reflectance spectroscopy that employs an objective optical technique.15,16
Loughman and colleagues17 have reported a statistically significant and positive correlation between MPOD and BCVA and also between MPOD and contrast sensitivity under mesopic and photopic conditions at intermediate spatial frequencies in a young healthy population. Other studies have similarly reported positive associations between macular pigment and several parameters of vision including photophobia, veiling glare, visual discomfort, and the photostress recovery time.9,14 Decreased macular pigment has also been reported in some disorders including AMD and CSC.8,12
Liew and colleagues18 and Trieschmann and colleagues19 have previously reported the mean MPOD values in the normal population as 0.41 ± 0.15 and 0.50 ± 0.19 density unit (DU), respectively. Sasamoto and colleagues12 have found an MPOD value of 0.548 ± 0.15 in the Japanese population. Compared with those reports, we found a higher mean MPOD of 0.572 ± 0.12 DU in healthy subjects. The difference in the results may be due to the different measurement methods used or the ethnicity of the subjects.
The Macular Pigment Research Group has demonstrated that older age, smoking status, and family history of AMD are associated with lower macular pigment levels.9 There are some studies suggesting lower macular pigment density in women, people with high body fat, and light-colored eyes.13,20–25 Although some studies have declared a positive correlation between age and smoking status and MPOD, it is reported that sex, age, and smoking may not be associated with MPOD in a Japanese population.12 We also found no significant correlation between MPOD and the sex, age, or smoking status of the study subjects.
Sasamoto and colleagues12 and Liew and colleagues18 have shown that CRT is positively correlated with MPOD in normal subjects. Nolan and colleagues26 have reported that the relationship between the CRT and MPOD is positive and significant in non-White subjects. Macular pigments have been demonstrated to be significantly inversely associated with CRT in several retinal degenerations such as retinitis pigmentosa, Usher syndrome, and choroideremia.27,28 Sasamoto and colleagues12 have reported that the CRT is correlated positively with MPOD in eyes with chronic CSC, as seen in normal subjects. However, we did not find any significant correlation between CRT and MPOD levels in healthy controls or the acute and chronic CSC groups.
The correlation of CT and MPOD levels was also not statistically significant in CSC group (p = 0.71). Recently, Nagai and colleagues29 have demonstrated a positive correlation between MPOD and CRT, but not a significant correlation between MPOD and CT values in healthy subjects.
CSC is characterized by the accumulation of subretinal fluid at the level of the RPE. It results in neurosensorial retinal detachment accompanied by serous RPE detachment. Ahlers and colleagues30 have demonstrated intraretinal structural changes and hyperreflectivity in the outer nuclear or plexiform layers in CSC cases using high-definition OCT. The disruption in the central part of the neurosensorial retina in CSC may affect the distribution of macular pigments within the Henle fiber and inner plexiform layers.
Sasamoto and colleagues12 have found decreased MPOD in the eyes with chronic CSC together with a slight decrease in the fellow eyes. They could not explain the reason for bilateral MPOD reduction in CSC patients but suggested the thinner central retina in these patients as a possible reason. Sawa and colleagues31 have reported a mean MPOD value of 0.433 ± 0.085 DU in acute CSC and 0.446 ± 0.125 DU in chronic CSC with no significant difference between the two groups. Higher MPOD values have been found in the eye affected with CSC in a very recent report of two cases. A decrease in MPOD value was reported after the resolution of the subretinal fluid. The authors suggested that the presence of subretinal fluid probably causes hypermetropic shift and detachment of the photoreceptors from the RPE influencing the perception of the test stimuli and leading to higher MPOD measurements.32 In our study, we found that MPOD in the affected eyes with chronic CSC was significantly lower than in the controls. The prognosis is known to be usually worse in chronic CSC compared with the acute form. It is possible that persistent subretinal exudation and atrophy of the retina and RPE cause this MPOD reduction and the poor visual prognosis in chronic CSC patients.
In conclusion, we found that MPOD levels in chronic CSC patients were significantly lower than in controls. The reason could be the long-term persistence of subretinal fluid resulting in degeneration of the neurosensorial retina and affecting supplementation of macular pigments from the RPE and choroid. Future large-scale studies may be beneficial for determining the best way to manage CSC patients.
Footnotes
Conflict of interest statement: The authors declared no potential conflicts of interest with respect to the research, authorship, and/or publication of this article.
Funding: The authors received no financial support for the research, authorship, and/or publication of this article.
Ethical statement: The study followed the Declaration of Helsinki. The study was approved by the Institutional Review Board of Ankara Numune Education and Research Hospital (IRB No. E-16-2468). All participants provided written informed consents.
ORCID iD: Burcu Polat Gultekin  https://orcid.org/0000-0001-9121-3041
Contributor Information
Burcu Polat Gultekin, Department of Ophthalmology, Ministry of Health Ankara City Hospital, Ankara 06800, Turkey.
Esra Sahli, Department of Ophthalmology, Ankara University Medical Faculty, Ankara, Turkey.
References
- 1. Yannuzzi LA. Central serous chorioretinopathy: a personal perspective. Am J Ophthalmol 2010; 149: 361–363.e1. [DOI] [PubMed] [Google Scholar]
- 2. Haimovici R, Koh S, Gagnon DR, et al. Risk factors for central serous chorioretinopathy: a case–control study. Ophthalmology 2004; 111: 244–249. [DOI] [PubMed] [Google Scholar]
- 3. Ruiz-Medrano J, Pellegrini M, Cereda MG, et al. Choroidal characteristics of acute and chronic central serous chorioretinopathy using enhanced depth imaging optical coherence tomography. Eur J Ophthalmol 2017; 27: 476–480. [DOI] [PubMed] [Google Scholar]
- 4. Imamura Y, Fujiwara T, Margolis R, et al. Enhanced depth imaging optical coherence tomography of the choroid in central serous chorioretinopathy. Retina 2009; 29: 1469–1473. [DOI] [PubMed] [Google Scholar]
- 5. Nicholson B, Noble J, Forooghian F, et al. Central serous chorioretinopathy: update on pathophysiology and treatment. Surv Ophthalmol 2013; 58: 103–126. [DOI] [PMC free article] [PubMed] [Google Scholar]
- 6. Trieschmann M, van Kuijk FJ, Alexander R, et al. Macular pigment in the human retina: histological evaluation of localization and distribution. Eye 2008; 22: 132–137. [DOI] [PubMed] [Google Scholar]
- 7. Beatty S, Murray IJ, Henson DB, et al. Macular pigment and risk for age-related macular degeneration in subjects from a Northern European population. Invest Ophthalmol Vis Sci 2001; 42: 439–446. [PubMed] [Google Scholar]
- 8. Obana A, Hiramitsu T, Gohto Y, et al. Macular carotenoid levels of normal subjects and age-related maculopathy patients in a Japanese population. Ophthalmology 2008; 115: 147–157. [DOI] [PubMed] [Google Scholar]
- 9. LaRowe TL, Mares JA, Snodderly DM, et al. Macular pigment density and age-related maculopathy in the Carotenoids in Age-Related Eye Disease Study: an ancillary study of the Women’s Health Initiative. Ophthalmology 2008; 115: 876–883.e1. [DOI] [PubMed] [Google Scholar]
- 10. Iannaccone A, Mura M, Gallaher KT, et al. Macular pigment optical density in the elderly: findings in a large biracial Midsouth population sample. Invest Ophthalmol Vis Sci 2007; 48: 1458–1465. [DOI] [PMC free article] [PubMed] [Google Scholar]
- 11. Wolf-Schnurrbusch UE, Röösli N, Weyermann E, et al. Ethnic differences in macular pigment density and distribution. Invest Ophthalmol Vis Sci 2007; 48: 3783–3787. [DOI] [PubMed] [Google Scholar]
- 12. Sasamoto Y, Gomi F, Sawa M, et al. Macular pigment optical density in central serous chorioretinopathy. Invest Ophthalmol Vis Sci 2010; 51: 5219–5225. [DOI] [PubMed] [Google Scholar]
- 13. Eandi CM, Nassisi M, Lavia C, et al. Macular pigment density and quantitative fundus autofluorescence in young healthy subjects. Invest Ophthalmol Vis Sci 2017; 58: 2284–2290. [DOI] [PubMed] [Google Scholar]
- 14. Ozawa Y, Shigeno Y, Nagai N, et al. Absolute and estimated values of macular pigment optical density in young and aged Asian participants with or without age-related macular degeneration. BMC Ophthalmol 2017; 17: 161. [DOI] [PMC free article] [PubMed] [Google Scholar]
- 15. van der Veen RL, Berendschot TT, Makridaki M, et al. Correspondence between retinal reflectometry and a flicker-based technique in the measurement of macular pigment spatial profiles. J Biomed Opt 2009; 14: 064046. [DOI] [PubMed] [Google Scholar]
- 16. Whitehead AJ, Mares JA, Danis RP. Macular pigment: a review of current knowledge. Arch Ophthalmol 2006; 124: 1038–1045. [DOI] [PubMed] [Google Scholar]
- 17. Loughman J, Akkali MC, Beatty S, et al. The relationship between macular pigment and visual performance. Vision Res 2010; 50: 1249–1256. [DOI] [PubMed] [Google Scholar]
- 18. Liew SM, Gilbert CE, Spector TD, et al. Central retinal thickness is positively correlated with macular pigment optical density. Exp Eye Res 2006; 82: 915–920. [DOI] [PubMed] [Google Scholar]
- 19. Trieschmann M, Beatty S, Nolan JM, et al. Changes in macular pigment optical density and serum concentrations of its constituent carotenoids following supplemental lutein and zeaxanthin: the LUNA study. Exp Eye Res 2007; 84: 718–728. [DOI] [PubMed] [Google Scholar]
- 20. Kirby ML, Beatty S, Loane E, et al. A central dip in the macular pigment spatial profile is associated with age and smoking. Invest Ophthalmol Vis Sci 2010; 51: 6722–6728. [DOI] [PubMed] [Google Scholar]
- 21. Broekmans WM, Berendschot TT, Klöpping-Ketelaars IA, et al. Macular pigment density in relation to serum and adipose tissue concentrations of lutein and serum concentrations of zeaxanthin. Am J Clin Nutr 2002; 76: 595–603. [DOI] [PubMed] [Google Scholar]
- 22. Hammond BR, Jr, Caruso-Avery M. Macular pigment optical density in a Southwestern sample. Invest Ophthalmol Vis Sci 2000; 41: 1492–1497. [PubMed] [Google Scholar]
- 23. Hammond BR, Jr, Curran-Celentano J, Judd S, et al. Sex differences in macular pigment optical density: relation to plasma carotenoid concentrations and dietary patterns. Vision Res 1996; 36: 2001–2012. [DOI] [PubMed] [Google Scholar]
- 24. Hammond BR, Jr, Fuld K, Snodderly DM. Iris color and macular pigment optical density. Exp Eye Res 1996; 62: 293–297. [DOI] [PubMed] [Google Scholar]
- 25. Ciulla TA, Curran-Celantano J, Cooper DA, et al. Macular pigment optical density in a midwestern sample. Ophthalmology 2001; 108: 730–737. [DOI] [PubMed] [Google Scholar]
- 26. Nolan JM, Stringham JM, Beatty S, et al. Spatial profile of macular pigment and its relationship to foveal architecture. Invest Ophthalmol Vis Sci 2008; 49: 2134–2142. [DOI] [PubMed] [Google Scholar]
- 27. Aleman TS, Duncan JL, Bieber ML, et al. Macular pigment and lutein supplementation in retinitis pigmentosa and Usher syndrome. Invest Ophthalmol Vis Sci 2001; 42: 1873–1881. [PubMed] [Google Scholar]
- 28. Duncan JL, Aleman TS, Gardner LM, et al. Macular pigment and lutein supplementation in choroideremia. Exp Eye Res 2002; 74: 371–381. [DOI] [PubMed] [Google Scholar]
- 29. Nagai N, Asato T, Minami S, et al. Correlation between macular pigment optical density and neural thickness and volume of the retina. Nutrients 2020; 12: 888. [DOI] [PMC free article] [PubMed] [Google Scholar]
- 30. Ahlers C, Geitzenauer W, Stock G, et al. Alterations of intraretinal layers in acute central serous chorioretinopathy. Acta Ophthalmol 2009; 87: 511–516. [DOI] [PubMed] [Google Scholar]
- 31. Sawa M, Gomi F, Hara C, et al. Effects of a lutein supplement on the plasma lutein concentration and macular pigment in patients with central serous chorioretinopathy. Invest Ophthalmol Vis Sci 2014; 55: 5238–5244. [DOI] [PubMed] [Google Scholar]
- 32. Tudosescu R, Alexandrescu CM, Istrate SL, et al. Macular pigment density changes in central serous chorioretinopathy. Rom J Ophthalmol 2018; 62: 222–227. [PMC free article] [PubMed] [Google Scholar]