Abstract
Objectives:
When iodinated contrast is administered during CT simulation, standard practice requires a separate non-contrast CT for dose calculation. The objective of this study is to validate our hypothesis that since iodine affects Hounsfield units (HUs) more than electron density (ED), the information from post-contrast dual-layer CT (DLCT) would be sufficient for accurate dose calculation for both photon and proton therapy.
Methods and materials:
10 pediatric patients with abdominal tumors underwent DLCT scans before and after iodinated contrast administration for radiotherapy planning. Dose distributions with these DLCT-based methods were compared to those with conventional calibration-curve methods that map HU images to ED and stopping-power ratio (SPR) images.
Results:
For photon plans, conventional and DLCT approaches based on post-contrast scans underestimated the PTV D99 by 0.87 ± 0.70% (p = 0.18) and 0.36 ± 0.31% (p = 0.34), respectively, comparing to their non-contrast optimization plans. Renal iodine concentration was weakly associated with D99 deviation for both conventional (R2 = 0.10) and DLCT (R2 = 0.02) approaches. For proton plans, the clinical target volume D99 errors were 3.67 ± 2.43% (p = 0.0001) and 0.30 ± 0.25% (p = 0.40) for conventional and DLCT approaches, respectively. The proton beam range changed noticeably with the conventional approach. Renal iodine concentration was highly associated with D99 deviation for the conventional approach (R2 = 0.83) but not for DLCT (R2 = 0.007).
Conclusion:
Conventional CT with iodine contrast resulted in a large dosimetric error for proton therapy, compared to true non-contrast plans, but the error was less for photon therapy. These errors can be greatly reduced in the case of the proton plans if DLCT is used, raising the possibility of using only a single post-contrast CT for radiotherapy dose calculation, thus reducing the time and imaging dose required.
Advances in knowledge:
This study is the first to compare directly the differences in the calculated dose distributions between pre- and post-contrast CT images generated by single-energy CT and dual-energy CT methods for photon and proton therapy.
Introduction
To calculate absorbed dose, most radiotherapy planning systems convert the Hounsfield unit (HU) values of CT images to the electron density (ED) for photon therapy or the proton stopping-power ratio (SPR) for proton therapy via stoichiometric calibration curves. 1 This conversion leads to an error in the ED determination 2,3 such that two tissue types with different EDs may be assigned incorrectly to the same ED because they have the same HU values. Given that the proton SPR strongly depends on the relative ED based on the Bethe formula, 4 accurate calculation of the SPR 5,6 is paramount to minimize the effects of range uncertainty in the beam path. Several groups have reported on the benefits of using dual-energy CT (DECT) rather than conventional single-energy CT (SECT) for radiotherapy applications. 7–9 It was reported 10 that the relative EDs of all tissue substitutes could be determined with accuracy better than 1%. The past studies 11,12 determined that the root-mean-square error (RMSE) of the SPR with the DECT approach was 1% or less according to proton beam measurements. The two groups 6,13 performed extensive SPR analyses and demonstrated the overall range uncertainties with DECT to be 2.2 and 2.4%, respectively, based on experimental measurements. Nevertheless, applications other than the reduction of range uncertainty and the enhancement of tumor visibility remain to be discovered.
Current clinical practice for radiation therapy simulation with contrast administration is to acquire two CT scans back to back: one scan before contrast injection for dose calculation and another scan after contrast administration to aid in tumor delineation. The use of intravenous iodinated contrast is an integral part of CT-based radiotherapy planning for certain tumors and treatment sites. Contrast is particularly useful to discern tumor from normal tissues and to define regional anatomy. Iodine, one of the most commonly used contrast media, has a high atomic number of 53, which enables it to be distinguished from most tissues in the body. Different photoelectric absorption interactions produce iodine contrast images with increased HU values. If left uncorrected, the increased HU values from the contrast scan could lead to an inaccurate dose calculation for both photons and protons as a result of the incorrect mapping of HU-ED and HU-SPR calibration curves, respectively.
The impact of contrast agent administration has been investigated by several groups. The presence of contrast agent introduced errors of 1–2% in the photon dose calculation, 14–17 whereas the contrast agent used for proton dose calculation resulted in errors of up to 10 mm in the proton range. 18,19 It was reported 7 that the DECT method predicts the SPR of iodinated intravenous contrast with an accuracy of 1%, whereas accuracy with SECT calibration remains at the level of 20–25%. In these ex vivo validations with animal tissues, 7 the differences between measured SPR and derived SPR were found to be <1% with DECT because the SPR accuracy strongly depends on the accuracy of electron density than that of the atomic number of a material. However, the SPR accuracy with the conventional SECT simply reflects the accuracy in HU. For a high-Z material such as iodine, the HU can be incorrectly mapped to the SPR of a high density material such as bone.
In this work, we used a new type of dual-layer DECT (DLCT) scanner (the IQon Spectral CT from Philips Healthcare) that acquires high- and low-energy X-ray projection data simultaneously without exposing the patient to additional radiation. The DLCT scanner directly generates not only conventional HU images but also ED, effective atomic number (EAN), and monoenergetic (MonoE, 40–200 keV) images in a single scan. To test the hypothesis that a single post-contrast CT would be sufficient for dose calculation in radiation therapy, we analyzed the pre- and post-contrast CT images of patients who had previously undergone CT simulation with DLCT. Institutional review board approval was obtained for the retrospective analysis. Our demonstration of the feasibility of this approach should help reduce CT simulation time and radiation exposure. For pediatric patients, the anesthesia time can also be decreased.
To our knowledge, this study is the first to compare directly the differences in the calculated dose distributions between pre- and post-contrast CT images generated by SECT and DLCT methods for photon and proton therapy.
Methods and materials
This section describes the retrospective analysis of 10 patients with abdominal tumors, whose pre- and post-contrast DLCT scans were used to simulate the treatment planning process for the SECT approach and the DECT approach. It also details how doses calculated on contrast CT images were compared to those on true non-contrast CT images for photon and proton treatment scenarios.
Patient selection
The patients included in this study were randomly selected from among those with tumor sites close to the kidneys who had undergone DLCT scans for CT simulation. Because iodine is excreted by glomerular filtration in the kidneys, these organs often exhibit relatively high iodine concentrations on post-contrast scans and are, therefore, ideal for assessing the impact of contrast presence on dose calculation. Figure 1 shows sample CT images of a study patient (Patient 9), showing the peritoneal disease site adjacent to the kidneys with the post-operative retroperitoneal clinical target volume (CTV).
Figure 1.

(a) Non-contrast HU image as conventionally used for radiation therapy dose calculation. (b) Iodine density image showing higher iodine concentrations in the kidneys. (c) Post-contrast HU image acquired 4 min after iodine contrast administration. HU, Hounsfield unit.
For each patient, the iodine concentration was determined by contouring the kidneys on HU images and overlaying the contours on iodine density images to calculate the average iodine concentration, as shown in Figure 1b. The average iodine density for both kidneys was recorded as the renal iodine uptake in milligrams per milliliter. Table 1 lists the 10 study patients in order of increasing renal iodine concentration.
Table 1.
Patient characteristics at the time of post-contrast CT
| Patient # | Diagnosis | Disease site | Age (y) | Renal iodine uptake (mg mL−1) |
|---|---|---|---|---|
| 1 | Neuroblastoma | Adrenal (left) | 13 | 2.39 |
| 2 | Neuroblastoma | Adrenal (left) | 6 | 2.46 |
| 3 | Neuroblastoma | Adrenal (left) | 5 | 3.10 |
| 4 | Neuroblastoma | Adrenal (right) | 4 | 3.31 |
| 5 | Neuroblastoma | Adrenal (left) | 6 | 3.37 |
| 6 | Neuroblastoma | Adrenal (right) | 4 | 3.39 |
| 7 | Neuroblastoma | Adrenal (right) | 11 | 4.56 |
| 8 | Hodgkin lymphoma | Retroperitoneal LN | 20 | 4.74 |
| 9 | Hodgkin lymphoma | Porta hepatis LN | 11 | 4.83 |
| 10 | Rhabdomyosarcoma | Para-aortic LN | 18 | 5.33 |
LN, Lymph nodes.
Image acquisition
All imaging data for 10 study patients were acquired before and after iodine administration with a Philips IQon spectral CT, using the clinical helical scan protocol of abdomen (120 kVp, auto collimation, 500 mm field of view, 512 × 512 matrix size, Standard (B) reconstruction kernel, and dose right index of 20). Each abdominal scan protocol delivers an imaging dose of 10.2 mGy measured on 32 cm CTDI body phantom. iDose4 Level 3 iterative reconstruction and 1.5 mm slice thicknesses were selected. In order to obtain non-contrast and contrast images, two spectral CT scans were acquired, and hence doubled the imaging dose. However, a single DLCT scan can be used to derive electron density, effective atomic number, iodine density, and conventional HU images. The patient dose saving is gained by performing a single DLCT scan as opposed to two SECT scans. The potential anatomic misalignment between two scans can also be eliminated.
Conventional SECT method for mapping HU to ED and SPR
A stoichiometric calibration method 1 was used for the conventional SECT approach. The calibration curves in our clinical treatment-planning systems mapped HU to ED for photon dose calculation and HU to SPR for proton dose calculation. Figure 2a shows the data flow for the SECT method.
Figure 2.
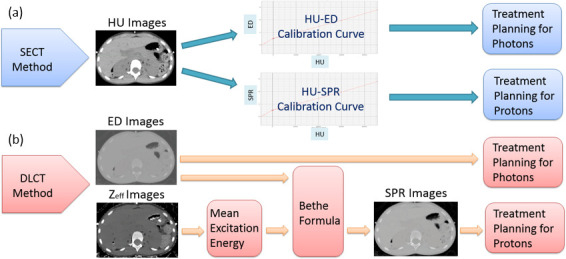
(a) Data flow for the SECT method using HU images and the calibration-curve mapping. (b) Data flow for the DLCT method using ED or SPR images calculated from ED and Zeff images. Both contrast and non-contrast images went through these workflows. DLCT, dual layer CT; ED, electron density; HU, Hounsfield unit; SECT, single-energy CT; SPR, stopping-power ratio.
DLCT method for directly calculating ED and SPR
The DLCT scanner simultaneously acquires energy-sensitive data via its dual-layer detectors. The upper layer absorbs lower photon energies, whereas the lower layer detects higher photon energies. The physical interactions at different photon energy, such as photoelectric or Compton scatter components, can be separated from each other. 20 This enables the calculation of high- and low-energy attenuation coefficients 21 and, hence, the density and composition of the materials can be determined. In DLCT, electron density estimation is calculated based on a linear combination of Compton scatter and photoelectric interactions where Compton scatter component dominates. The two parameters of the linear combination coefficients are determined by fitting the expected electron densities of literature tissues provided in International Commission on Radiation Units and Measurement (ICRU) Report 44 (ICRU 1989). Effective atomic number is determined based on a method 10 where the ratio of two measured monoenergetic attenuation coefficients from a DLCT scan is compared to the theoretical plot of effective atomic number vs the ratio of the linear attenuation coefficients at two energies. The theoretical effective atomic number for a tissue can be calculated based on elemental compositions and their fractional weights. The theoretical monoenergy attenuations can be calculated based on the photon cross-section database of National Institute of Standards and Technology. After a single spectral scan, DLCT can automatically generate electron density (ρe ), effective atomic number (Zeff ), and monoenergetic (MonoE, 40─200 keV) images.
The SPR images for the DLCT method were computed based on the Bethe formula in Equation. 1
| (1) |
where ρe is the relative electron density, Im and Iwater are the mean excitation energies of the materials and water, respectively, me is the electron mass, c is the speed of light in a vacuum, and β is the ratio of the proton speed to the speed of light for the proton’s energy taken as 219 MeV. In accordance with National Institute of Standards and Technology recommendations, the Iwater value is taken as 75 eV. The latest recommendation of the value is 78 eV per ICRU (Errata and Addenda: ICRU Report 73). ρe and the Zeff values are extracted directly from DLCT images. Based on this Bethe equation, Zeff is converted to Im to be substituted into the SPR calculation. Two functions have been proposed for converting Zeff into lnIm . 5,22 Both functions were used to fit the data provided in ICRU Report 46 (ICRU 1992). After the fitting functions are used, lnIm is calculated using the Bragg additivity rule (Equation 2):
| (2) |
where ωi denotes the fractional weight of element i in the tissue, Ai is the mass number, and zi is the atomic number. After Im is calculated, the expression is inserted into the Bethe formula shown in Equation 1. A dedicated algorithm in MATLAB (MathWorks, Inc. Natick, MA) was used to generate SPR images for the DLCT method. Figure 2b shows a block diagram of this DLCT workflow.
Comparing non- and post-contrast treatment plan dosimetry for photon and proton therapy scenarios
All study patients originally underwent proton therapy; their photon treatment plans were created retrospectively solely for research purposes in Varian Eclipse treatment planning system (TPS) (v. 13.7). For both photon and proton scenarios, we first generated the treatment plans (termed “optimization plans”) based on true non-contrast images in TPS. These plans were then applied to images with post-contrast to recalculate the dose distributions using the same beam parameters from the original plans without reoptimization. In this paper, we use the term “verification plans” to represent the latter. Figures 3 and 4 illustrate the treatment-planning process.
Figure 3.
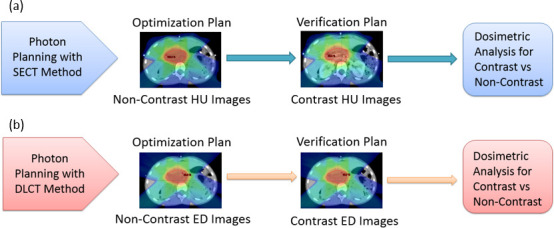
(a) The SECT method using HU images for photon therapy planning. (b) The DLCT method using ED images for photon therapy planning. DLCT, dual layer CT; ED, electron density; HU, Hounsfield unit; SECT, single-energy CT.
Figure 4.
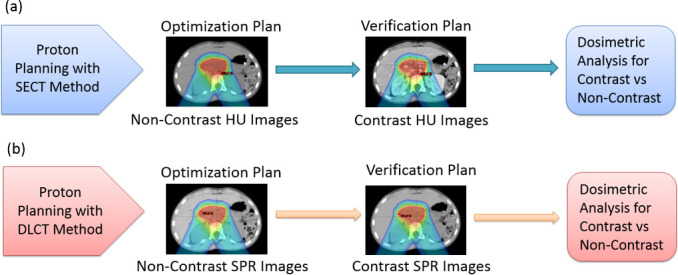
(a) The SECT method using HU images for proton therapy planning. (b) The DLCT method using SPR images for proton therapy planning. DLCT, dual layer CT; HU, Hounsfield unit; SECT, single-energy CT; SPR, stopping-power ratio.
For photon therapy, 7-field co-planar IMRT plans were generated using gantry angles of 0°, 50°, 130°, 230°, 280°, 290°, and 310°. The prescription dose to the target was 23.4 Gy (1.8 Gy per fraction x 13 fractions). The planning target goals for PTV (photon) and CTV (proton) were the same as D100% = 95%, D99% ≥ 95% and V110% ≤ 10%. Planning constraints for critical organs were mean dose ≤14.4 Gy, D50% ≤ 18 Gy (ipsilateral), and D50% ≤ 8 Gy (contralateral) for kidneys; D50% ≤ 18 Gy for liver; D100% < 24 Gy for heart; and D80% =±20% of the prescription dose for vertebral bodies.
As shown in Figure 3, the optimization plans were created separately on non-contrast HU images for the SECT method and on non-contrast ED images for the DLCT method. These two plans were not directly compared with each other. Instead, they were compared to the subsequent verification plans for contrast images to determine the effect of the presence of iodine contrast on target dosimetry.
For proton therapy, treatment plans were designed for spot-scanning proton beams from a commercial proton beam therapy system (PROBEAT-V, Hitachi America, Ltd). Beam arrangements, identical to those in the original clinical plans, comprised two posterior-oblique beams, each positioned 30° away from the posterior axis to avoid traversing bowel gas pockets, which vary daily. Either multifield optimization (MFO) or a single-field uniform-dose (SFUD) optimization technique was used. Dose constraints for target and critical structures were identical to those for photon plans. 3% range and 3 mm setup uncertainties were used for robust optimization. The results were displayed based on the nominal scenario. An RBE factor of 1.1 was applied. As shown in Figure 4, the optimization plans were created based on non-contrast HU images for the SECT method, whereas non-contrast SPR images were used for the DLCT method. Subsequent verification plans were generated by using contrast images for comparison.
Results
The conventional approach was selected as the SECT method for both photon and proton plans, whereas ED images for photon plans and SPR images for proton plans were used for the direct calculation with the DLCT method. The dosimetric and statistical analyses were also performed for the two methods with and without contrast agent to demonstrate the feasibility of relying on only a single post-contrast DLCT scan, which was found to be sufficient for dose calculation in both photon and proton clinics.
Effect of iodine contrast on photon plan dosimetry
Overall, treatment plans calculated on post-contrast scans underestimated the PTV D99 by 0.87 ± 0.70% (p = 0.18) and 0.36 ± 0.31% (p = 0.34) for the SECT and DLCT methods, respectively, which revealed no statistically significant difference between non-contrast optimization and post-contrast verification plans. Renal iodine concentration was weakly associated with the deviation in D99 for the SECT (R2 = 0.10) and DLCT (R2 = 0.02) methods. The individual iodine concentrations and D99 deviations are listed in Table 2, where liver and uninvolved kidney (not overlapped with the target) mean doses showing ≤14.4 Gy as planned for the two SECT and DLCT methods with no significant difference.
Table 2.
Individual and average differences in PTV coverage between contrast and non-contrast plans for photon therapy as well as mean doses of liver and kidney for SECT and DLCT methods. The 7-field IMRT technique was used for all study patients
| Patient # | Renal iodine uptake (mg ml−1) | SECTMethod ΔD99% | DLCTMethod ΔD99% | Liver/Kidney Mean Dose (Gy) | |
|---|---|---|---|---|---|
| SECT | DLCT | ||||
| 1 | 2.39 | 1.4 | 0.9 | 9.2/8.6 | 9.3/8.7 |
| 2 | 2.46 | 0.2 | 0.1 | 10.3/11.3 | 9.5/11.5 |
| 3 | 3.10 | 0.4 | 0.1 | 7.0/11.0 | 7.0/11.2 |
| 4 | 3.31 | 0.5 | 0.2 | 10.4/9.4 | 9.9/9.7 |
| 5 | 3.37 | 1.5 | 0.9 | 4.9/12.6 | 4.8/12.2 |
| 6 | 3.39 | 0.6 | 0.1 | 8.0/8.9 | 8.0/9.4 |
| 7 | 4.56 | 0.2 | 0.2 | 13.6/13.8 | 13.2/13.6 |
| 8 | 4.74 | 0.4 | 0.5 | 5.7/12.7 | 5.8/13.0 |
| 9 | 4.83 | 1.2 | 0.3 | 7.8/8.8 | 7.5/9.1 |
| 10 | 5.33 | 2.3 | 0.3 | 4.6/9.2 | 4.5/8.7 |
| Mean ± SD | 3.75 ± 1.02 | 0.87 ± 0.70 | 0.36 ± 0.31 | ||
DLCT, dual layer CT; PTV, planning target volume; SD, standard deviation; SECT, single-energy CT.
For the SECT method, the mean target dose was generally lower in the verification plan than in the optimization plan because the high-Z material (contrast agent) in the beam path attenuated some of the beams. The dose distribution and dose–volume histograms for an example patient (Patient 9) are shown in Figures 5 and 6.
Figure 5.
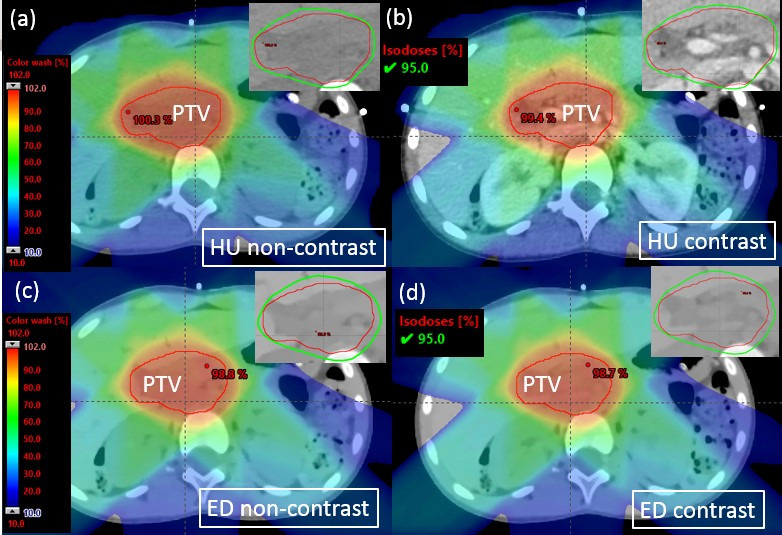
Photon dose distribution in an example patient (Patient 9) with zoomed-in figures showing 95% isodose line affixed on the right top corner. (a) Optimization plan on non-contrast HU images. (b) Verification plan on post-contrast HU images. (c) Optimization plan on non-contrast ED images. (d) Verification plan on post-contrast ED images. ED, electron density; HU, Hounsfield unit; PTV, panning target volume.
Figure 6.

Dose–volume histograms for an example patient (Patient 9) planned for photon therapy. (a) Optimization (non-contrast) vs verification (contrast) for the SECT method. (b) Optimization (non-contrast) vs verification (contrast) for the DLCT method. DLCT, dual layer CT; ED, electron density; HU, Hounsfield unit; PTV, panning target volume; SECT, single-energy CT; SPR, stopping-power ratio.
Effect of iodine contrast on proton plan dosimetry
For proton plan dosimetry, the decreases in target coverage, as evaluated with the CTV D99, were 3.67 ± 2.43% (p = 0.0001) and 0.30 ± 0.25% (p = 0.40) for the SECT and DLCT approaches, respectively, as detailed in Table 3, where liver and uninvolved kidney (not overlapped with the target) mean doses showing ≤14.4 Gy as planned for the two SECT and DLCT methods with no significant difference. Changes to the proton beam range were quite noticeable with the SECT approach, with an average pullback of 3 mm as measured at the R90 of the spread-out Bragg peaks between contrast and non-contrast plans. Renal iodine concentration was therefore highly associated with the deviation in D99 for the SECT approach (R2 = 0.83) but there was no such association for the DLCT approach (R2 = 0.007).
Table 3.
Individual and average differences in CTV coverage between contrast and non-contrast plans for proton therapy as well as mean doses of liver and kidney for SECT and DLCT methods
| Patient # | Technique | Renal iodine uptake (mg ml−1) | Range pullback (cm) | SECT method ΔD99% | DLCT method ΔD99% | Liver/Kidney mean dose (Gy) | |
|---|---|---|---|---|---|---|---|
| SECT | DLCT | ||||||
| 1 | MFO | 2.39 | 0.3 | 1.1 | 0.1 | 1.2/3.7 | 1.0/3.5 |
| 2 | SFUD | 2.46 | 0.3 | 2.5 | 0.1 | 3.3/9.4 | 2.8/9.2 1 |
| 3 | MFO | 3.10 | 0.2 | 1.2 | 0.4 | 1.0/5.9 | 1.0/5.5 2.9 |
| 4 | MFO | 3.31 | 0.2 | 2.8 | 0.2 | 3.4/2.6 | 2.9/2.8 |
| 5 | MFO | 3.37 | 0.3 | 1.8 | 0.8 | 1.0/11.2 | 1.2/10.3 |
| 6 | SFUD | 3.39 | 0.5 | 2.3 | 0.2 | 1.4/1.9 | 1.4/1.9 |
| 7 | SFUD | 4.56 | 0.4 | 4.1 | 0.7 | 4.5/10.7 | 4.8/10.4 |
| 8 | MFO | 4.74 | 0.3 | 6.5 | 0.2 | 1.3/9.3 | 1.2/9.3 |
| 9 | SFUD | 4.83 | 0.4 | 7.3 | 0.1 | 2.8/7.2 | 2.6/7.1 |
| 10 | SFUD | 5.33 | 0.3 | 7.1 | 0.2 | 0.5/3.7 | 0.5/3.6 |
| Mean ± SD | - | 3.75 ± 1.02 | 0.3 ± 0.1 | 3.67 ± 2.43 | 0.30 ± 0.25 | ||
CTV, clinical target volume; DLCT, dual layer CT; ED, electron density; HU, Hounsfield unit; MFO, multifield optimization;SD, standard deviation; SECT, single-energy CT; SFUD, single-field uniform-dose optimization.
Dose distributions and dose–volume histograms for an example patient (Patient 9) are shown in Figures 7 and 8. The zoomed-in regions (black rectangles) in Figure 7a, b highlight the calculated range pullback when iodine contrast was in the beam path, moving the distal edge of the Bragg peak closer to the beam entrance because of the increased water-equivalent path length.
Figure 7.
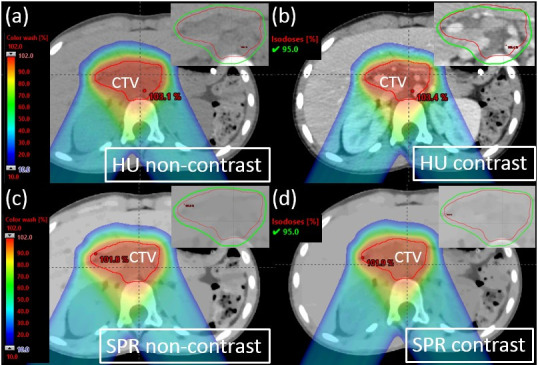
Proton dose distribution for an example patient (Patient 9) with zoomed-in figures showing 95% isodose line affixed on the right top corner. (a) Optimization plan on non-contrast HU images. (b) Verification plan on contrast HU images. (c) Optimization plan on non-contrast SPR images. (d) Verification plan on contrast SPR images. HU, Hounsfield unit; SPR, stopping-power ratio.
Figure 8.

Dose–volume histogram for an example patient (Patient 9) planned for proton therapy. (a) Optimization (non-contrast) vs verification (contrast) for the SECT method. (b) Optimization (non-contrast) vs verification (contrast) for the DLCT method. CTV, clinical target volume; DLCT, dual layer CT; HU, Hounsfield unit; SECT, single-energy CT; SPR, stopping-power ratio.
Photon and proton dosimetry comparison
For the patients included in this study, the presence of iodine contrast did not significantly affect the photon dosimetry (p = 0.18, R2 = 0.10) but it did significantly affect the proton dosimetry (p = 0.0001, R2 = 0.83) when treatment plans were designed with the conventional SECT method. Using multiple beam angles in the IMRT plan decreases the impact of a few angles passing through iodine-containing organs. The average change in D99% was <1%, reaching up to 2.3% in individual patients for photon plans. The impact of iodinated contrast on proton therapy was more significant, because the kidneys were in the beam paths of both posterior-oblique fields, resulting in range pullback (by an average of 3 mm) at the distal edge of the spread-out Bragg peak for the SECT method. The average change in D99% was 3.7%, reaching up to 7.3% in individual patients for proton plans.
When the DLCT method was adopted, we demonstrated that ED and SPR images were directly used in the treatment planning system for photon and proton dosimetry, respectively. The dosimetric difference was not statistically significant for photon plans (p = 0.34, R2 = 0.02) or proton plans (p = 0.40, R2 = 0.007) when contrast medium was present in the image.
Proton treatment planning based on the HU contrast image with the SECT method dramatically affected the plan qualities. Figure 9 demonstrates this phenomenon for Patient 9 when the proton range was pulled back by 4 mm, resulting in a severe cold region at the distal end of the spread-out Bragg peak that showed the total plan dose difference as large as 7.5 Gy compared to original plan (the prescription dose was 23.4 Gy). With the DLCT method that directly uses SPR images for planning, the range pullback was negligible. Figure 10 shows these minimal differences in the spread-out Bragg peak and dose distribution difference between non-contrast and contrast plans when the DLCT method was adopted.
Figure 9.
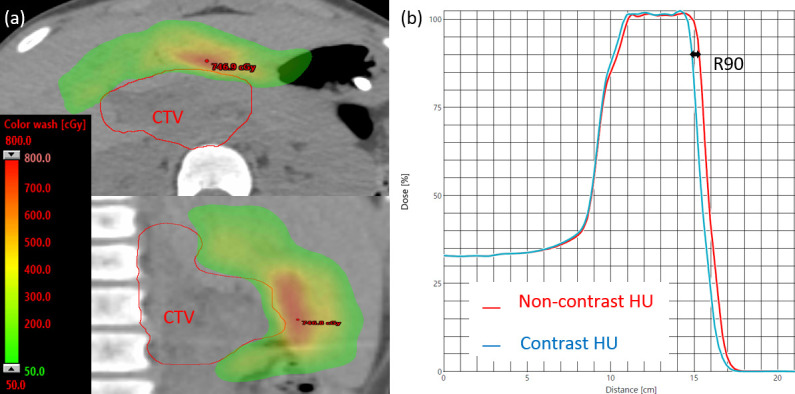
(a) The proton dose difference between non-contrast and contrast plans (for Patient 9) with the SECT method, shown in the transverse (top) and sagittal (bottom) planes. (b) A 4 mm range pullback was observed in the R90 of the spread-out Bragg peaks of the two plans. HU, Hounsfield unit; SECT, single-energy CT.
Figure 10.
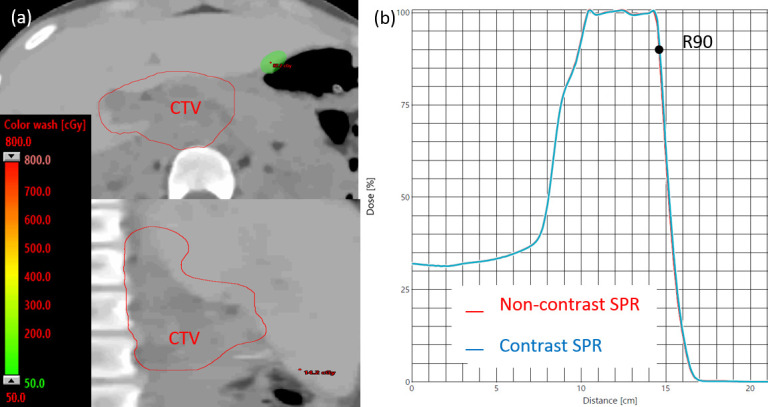
(a) The proton dose difference between non-contrast and contrast plans (for Patient 9) with the DLCT method, shown in transverse (top) and sagittal (bottom) planes. (b) With this approach, no range pullback was observed in the R90 of the spread-out Bragg peaks of the two plans. CTV, clinical target volume; DLCT, dual layer CT; SPR, stopping-power ratio.
Discussion
In diagnostic kilovoltage X-ray CT scans, the photoelectric effect and Compton scatter are the primary interactions between photons and matter. Compton scattering is nearly independent of the photon energy and depends on the electron density of matter. The probability of photoelectric absorption dominates in diagnostic X-ray imaging and is approximately proportional to (Z/E), 3 where Z is the atomic number of the matter and E is the photon energy. Iodine has a high atomic number of 53 and an ideal K-shell binding energy (37.4 keV) for absorption which is close to the mean energy of the most diagnostic X-ray beams. Thus, iodine shows as enhanced HU on conventional CT scans. For the SECT approach, when the CT calibration curve of HU-ED or HU-SPR is used, enhanced HU in iodine could result in incorrect mapping of ED or SPR. For DLCT method, material composition can be analyzed through image acquisition at two different energy level. This makes DLCT sensitive to atomic number and density, but it is not sensitive to chemical binding.
For the photon dosimetry, there is a constant relation between collision kerma and absorbed dose beyond electronic equilibrium during photon attenuation and scattering in the medium. The most important characteristic of the photon’s stopping power ratios is that they are almost constant beyond the depth of transient electronic equilibrium according to Spencer-Attix cavity theory. Therefore, the average energy of the generated electrons and their range does not change by depth which causes only minimal deviation when introduced contrast media in the beam path. The depth-dose distribution for photons reveals a maximum dose close to the entry point and a decreasing dose deposition with increasing depth in the tissue. Because of this phenomenon, multiple gantry beams around the patient can still ensure a high dose to the tumor region. Although high-Z materials such as contrast media are expected to be avoided for photon planning, using multiple IMRT beams could still enable overall tumor conformity of the treatment.
Unlike photons, protons are charged particles that undergo frequent interactions in media and have a finite range in tissue. The proton dose increases with depth, resulting in a Bragg peak at the end of the range of the beam. When the Bragg peak occurs, the protons start to deposit the maximum energy per path length close to the end of the beam range. This phenomenon enables fewer beam angles to be used when compared to photon techniques. However, any changes in proton range will shift the Bragg peak and, hence, adversely affect the dose deposition at the target. Contrast media such as those containing iodine are considered high-Z materials; they elevate the HU values in the SECT scan and cause an erroneous dose calculation if present in the beam path. The DLCT method could greatly reduce the errors in calculated doses by directly utilizing the ED of the contrast CT which is not significantly affected with the presence of the contrast media when compared to HU.
In this study, we tested the performance of the SECT and DLCT methods when iodine contrast was present in images used for treatment planning. Non-contrast and contrast plans were compared to determine whether a single post-contrast CT could be used for treatment planning without introducing a large dosimetric error. We have demonstrated that this deviation could be significant when post-contrast HU images were used for proton dose calculation, whereas the deviation was less than 1% if post-contrast SPR images generated from DECT were used instead. Although we did not compare the SPR-based dose calculation with measurements to prove its superiority over the conventional HU-based approach, many researchers 13,23,24 have already reported improved accuracy with DECT-based SPR estimation.
Conclusion
We have demonstrated that the presence of iodine contrast in HU images can introduce a large dosimetric error into proton therapy for some patients with abdominal disease sites. For photon therapy, this error was less significant as a result of the use of multiple intensity modulated radiation therapy beam angles and had the lower sensitivity of photon attenuation to high-Z material in the beam path. These errors can be greatly reduced if ED and SPR images derived from DLCT, instead of HU images, are used for treatment planning. This approach would enable us to rely on only a single post-contrast scan for radiation therapy simulation and dose calculation, thus reducing the imaging dose and the anesthesia time for younger children.
Footnotes
Acknowledgements: The authors thank the Department of Radiation Oncology at St. Jude Children’s Research Hospital, American Lebanese Syrian Associated Charities (ALSAC), and Philips Healthcare for research support. They also thank Tina Davis MBA RHIA CCRP for IRB approval support, and Keith A. Laycock PhD ELS for scientific editing of the manuscript.
Conflicts of interest: St. Jude Children’s Research Hospital has a collaborative research agreement with Philips Healthcare on CT imaging research. However, Philips did not provide any research funds for the present study.
Funding: This work was supported by St. Jude Children’s Research Hospital, Memphis, TN, USA.
Contributor Information
Ozgur Ates, Email: Ozgur.Ates@STJUDE.ORG.
Chia-ho Hua, Email: Chia-Ho.Hua@STJUDE.ORG.
Li Zhao, Email: li.zhao@stjude.org.
Nadav Shapira, Email: nadav.shapira@pennmedicine.upenn.edu.
Yoad Yagil, Email: Yoad.Yagil@philips.com.
Thomas E Merchant, Email: Thomas.Merchant@STJUDE.ORG.
Matthew Krasin, Email: Matthew.Krasin@STJUDE.ORG.
REFERENCES
- 1. Schneider U, Pedroni E, Lomax A. The calibration of CT Hounsfield units for radiotherapy treatment planning. Phys Med Biol 1996; 41: 111–24. doi: 10.1088/0031-9155/41/1/009 [DOI] [PubMed] [Google Scholar]
- 2. Schneider W, Bortfeld T, Schlegel W. Correlation between CT numbers and tissue parameters needed for Monte Carlo simulations of clinical dose distributions. Phys Med Biol 2000; 45: 459–78. doi: 10.1088/0031-9155/45/2/314 [DOI] [PubMed] [Google Scholar]
- 3. van Abbema JK, van Goethem M, Greuter M, van der Schaaf A. Brandenburg S, and van der Graaf E R. relative electron density determination using a physics based parametrization of photon interactions in medical dual energy CT. Phys. Med. Biol 2015; 60: 3825–46. [DOI] [PubMed] [Google Scholar]
- 4. Bethe HA, Ashkin J. Passage of radiations through matter. Experimental nuclear physics vol 1. E Segrè. New York, NY: John Wiley & Sons; 1953. pp. 166–357. [Google Scholar]
- 5. Yang M, Virshup G, Clayton J, Zhu XR, Mohan R, Dong L. Theoretical variance analysis of single- and dual-energy computed tomography methods for calculating proton stopping power ratios of biological tissues. Phys Med Biol 2010; 55: 1343–62. doi: 10.1088/0031-9155/55/5/006 [DOI] [PubMed] [Google Scholar]
- 6. Li B, Lee HC, Duan X, Shen C, Zhou L, Jia X, et al. Comprehensive analysis of proton range uncertainties related to stopping-power-ratio estimation using dual-energy CT imaging. Phys Med Biol 2017; 62: 7056–74. doi: 10.1088/1361-6560/aa7dc9 [DOI] [PMC free article] [PubMed] [Google Scholar]
- 7. Xie Y, Ainsley C, Yin L, Zou W, McDonough J, Solberg TD, et al. Ex vivo validation of a stoichiometric dual energy CT proton stopping power ratio calibration. Phys Med Biol 2018; 63: 055016. doi: 10.1088/1361-6560/aaae91 [DOI] [PubMed] [Google Scholar]
- 8. Lalonde A, Xie Y, Burgdorf B, O'Reilly S, Ingram WS, Yin L, et al. Influence of intravenous contrast agent on dose calculation in proton therapy using dual energy CT. Phys Med Biol 2019; 64: 125024. doi: 10.1088/1361-6560/ab1e9d [DOI] [PubMed] [Google Scholar]
- 9. Möhler C, Russ T, Wohlfahrt P, Elter A, Runz A, Richter C, et al. Experimental verification of stopping-power prediction from single- and dual-energy computed tomography in biological tissues. Phys Med Biol 2018; 63: 025001. doi: 10.1088/1361-6560/aaa1c9 [DOI] [PubMed] [Google Scholar]
- 10. Hua C-H, Shapira N, Merchant TE, Klahr P, Yagil Y. Accuracy of electron density, effective atomic number, and iodine concentration determination with a dual-layer dual-energy computed tomography system. Med Phys 2018; 45: 2486–97. doi: 10.1002/mp.12903 [DOI] [PubMed] [Google Scholar]
- 11. Bär E, Lalonde A, Royle G, Lu H-M, Bouchard H. The potential of dual-energy CT to reduce proton beam range uncertainties. Med Phys 2017; 44: 2332–44. doi: 10.1002/mp.12215 [DOI] [PubMed] [Google Scholar]
- 12. Taasti VT, Michalak GJ, Hansen DC, Deisher AJ, Kruse JJ, Krauss B, et al. Validation of proton stopping power ratio estimation based on dual energy CT using fresh tissue samples. Phys Med Biol 2017; 63: 015012. doi: 10.1088/1361-6560/aa952f [DOI] [PubMed] [Google Scholar]
- 13. Bär E, Lalonde A, Zhang R, Jee K-W, Yang K, Sharp G, et al. Experimental validation of two dual-energy CT methods for proton therapy using heterogeneous tissue samples. Med Phys 2018; 45: 48–59. doi: 10.1002/mp.12666 [DOI] [PubMed] [Google Scholar]
- 14. Ramm U, Damrau M, Mose S, Manegold KH, Rahl CG, Böttcher HD. Influence of CT contrast agents on dose calculations in a 3D treatment planning system. Phys Med Biol 2001; 46: 2631–5. doi: 10.1088/0031-9155/46/10/308 [DOI] [PubMed] [Google Scholar]
- 15. Shibamoto Y, Naruse A, Fukuma H, Ayakawa S, Sugie C, Tomita N. Influence of contrast materials on dose calculation in radiotherapy planning using computed tomography for tumors at various anatomical regions: a prospective study. Radiother Oncol 2007; 84: 52–5. doi: 10.1016/j.radonc.2007.05.015 [DOI] [PubMed] [Google Scholar]
- 16. Lee FK-H, Chan CC-L, Law C-K. Influence of CT contrast agent on dose calculation of intensity modulated radiation therapy plan for nasopharyngeal carcinoma. J Med Imaging Radiat Oncol 2009; 53: 114–8. doi: 10.1111/j.1754-9485.2009.02046.x [DOI] [PubMed] [Google Scholar]
- 17. Choi Y, Kim J-K, Lee H-S, Hur W-J, Hong Y-S, Park S, et al. Influence of intravenous contrast agent on dose calculations of intensity modulated radiation therapy plans for head and neck cancer. Radiother Oncol 2006; 81: 158–62. doi: 10.1016/j.radonc.2006.09.010 [DOI] [PubMed] [Google Scholar]
- 18. Wertz H, Jäkel O. Influence of iodine contrast agent on the range of ion beams for radiotherapy. Med Phys 2004; 31: 767–73. doi: 10.1118/1.1650871 [DOI] [PubMed] [Google Scholar]
- 19. Hwang U-J, Shin DH, Kim TH, Moon SH, Lim YK, Jeong H, et al. The effect of a contrast agent on proton beam range in radiotherapy planning using computed tomography for patients with locoregionally advanced lung cancer. Int J Radiat Oncol Biol Phys 2011; 81: e317–24. doi: 10.1016/j.ijrobp.2011.02.025 [DOI] [PubMed] [Google Scholar]
- 20. Alvarez RE, Macovski A. Energy-Selective reconstructions in X-ray computerized tomography. Phys Med Biol 1976; 21: 733–44. doi: 10.1088/0031-9155/21/5/002 [DOI] [PubMed] [Google Scholar]
- 21. Su K-H, Kuo J-W, Jordan DW, Van Hedent S, Klahr P, Wei Z, et al. Machine learning-based dual-energy CT parametric mapping. Phys Med Biol 2018; 63: 125001. doi: 10.1088/1361-6560/aac711 [DOI] [PubMed] [Google Scholar]
- 22. Bourque AE, Carrier J-F, Bouchard H. A stoichiometric calibration method for dual energy computed tomography. Phys Med Biol 2014; 59: 2059–88. doi: 10.1088/0031-9155/59/8/2059 [DOI] [PubMed] [Google Scholar]
- 23. Taasti VT, Muren LP, Jensen K, Petersen JBB, Thygesen J, Tietze A, et al. Comparison of single and dual energy CT for stopping power determination in proton therapy of head and neck cancer. Physics and Imaging in Radiation Oncology 2018; 6: 14–19. doi: 10.1016/j.phro.2018.04.002 [DOI] [PMC free article] [PubMed] [Google Scholar]
- 24. Wohlfahrt P, Möhler C, Richter C, Greilich S. Evaluation of stopping-power prediction by dual- and single-energy computed tomography in an anthropomorphic ground-truth phantom. Int J Radiat Oncol Biol Phys 2018; 100: 244–53. doi: 10.1016/j.ijrobp.2017.09.025 [DOI] [PubMed] [Google Scholar]


