Predicting the clinical trajectory of individual patients hospitalized with COVID-19 is necessary to inform clinical care. This article describes the development of an online tool to predict severe illness or death in patients hospitalized with COVID-19.
Visual Abstract. Development of Severe COVID-19 Adaptive Risk Predictor.
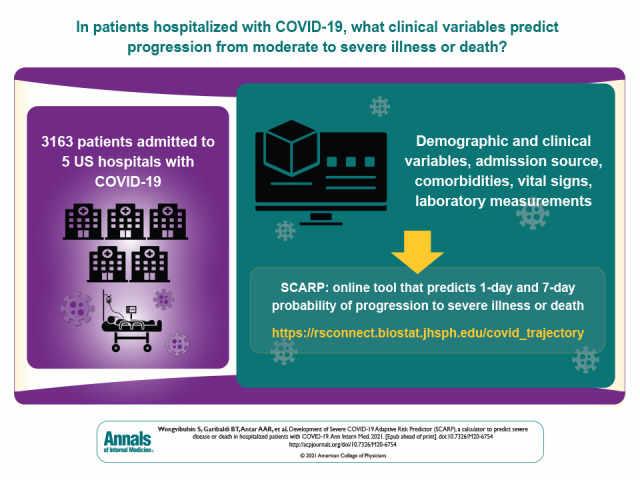
Predicting the clinical trajectory of individual patients hospitalized with COVID-19 is necessary to inform clinical care. This article describes the development of an online tool to predict severe illness or death in patients hospitalized with COVID-19.
Abstract
Background:
Predicting the clinical trajectory of individual patients hospitalized with coronavirus disease 2019 (COVID-19) is challenging but necessary to inform clinical care. The majority of COVID-19 prognostic tools use only data present upon admission and do not incorporate changes occurring after admission.
Objective:
To develop the Severe COVID-19 Adaptive Risk Predictor (SCARP) (https://rsconnect.biostat.jhsph.edu/covid_trajectory/), a novel tool that can provide dynamic risk predictions for progression from moderate disease to severe illness or death in patients with COVID-19 at any time within the first 14 days of their hospitalization.
Design:
Retrospective observational cohort study.
Setting:
Five hospitals in Maryland and Washington, D.C.
Patients:
Patients who were hospitalized between 5 March and 4 December 2020 with severe acute respiratory syndrome coronavirus 2 (SARS-CoV-2) confirmed by nucleic acid test and symptomatic disease.
Measurements:
A clinical registry for patients hospitalized with COVID-19 was the primary data source; data included demographic characteristics, admission source, comorbid conditions, time-varying vital signs, laboratory measurements, and clinical severity. Random forest for survival, longitudinal, and multivariate (RF-SLAM) data analysis was applied to predict the 1-day and 7-day risks for progression to severe disease or death for any given day during the first 14 days of hospitalization.
Results:
Among 3163 patients admitted with moderate COVID-19, 228 (7%) became severely ill or died in the next 24 hours; an additional 355 (11%) became severely ill or died in the next 7 days. The area under the receiver-operating characteristic curve (AUC) for 1-day risk predictions for progression to severe disease or death was 0.89 (95% CI, 0.88 to 0.90) and 0.89 (CI, 0.87 to 0.91) during the first and second weeks of hospitalization, respectively. The AUC for 7-day risk predictions for progression to severe disease or death was 0.83 (CI, 0.83 to 0.84) and 0.87 (CI, 0.86 to 0.89) during the first and second weeks of hospitalization, respectively.
Limitation:
The SCARP tool was developed by using data from a single health system.
Conclusion:
Using the predictive power of RF-SLAM and longitudinal data from more than 3000 patients hospitalized with COVID-19, an interactive tool was developed that rapidly and accurately provides the probability of an individual patient's progression to severe illness or death on the basis of readily available clinical information.
Primary Funding Source:
Hopkins inHealth and COVID-19 Administrative Supplement for the HHS Region 3 Treatment Center from the Office of the Assistant Secretary for Preparedness and Response.
Worldwide cases of coronavirus disease 2019 (COVID-19) continue to increase and are now responsible for over 100 million infections and 2 million deaths (1). COVID-19 stresses the limits of health care systems, even in high-income countries such as the United States, where 2021 began with more than 125 000 patients hospitalized with COVID-19 (2). Clinicians and health care systems urgently need reliable tools to determine which patients hospitalized with COVID-19 are at highest risk for severe disease or death, to ensure that patients are treated in a setting with the appropriate level of care. Such tools can also assist with communication to patients and their families about their prognosis and inform clinical decision making. Large observational cohorts of patients with COVID-19 have reported clinical characteristics that are associated with severe illness and death, but these findings are difficult to translate to the quantification of absolute risk in the context of informing care at the level of individual patients (3–5). Although clinical risk calculators have been created (6–9), there are currently no patient-level prediction tools in widespread use for COVID-19 because of the limitations of existing prediction tools. These limitations include disregarding clinical information beyond baseline data present upon hospital admission, not accounting for censoring, requiring values for all variables in the risk calculator to be entered to obtain a result, and using limited classification approaches rather than more robust survival analysis methodology.
We sought to develop a novel tool that can provide dynamic risk predictions for progression to severe illness or death in patients hospitalized with COVID-19. To overcome the shortcomings of current approaches and respond to the clinical demand for robust and individualized prediction of COVID-19 severity, we used a well-curated registry of patients admitted with COVID-19 to a 5-hospital health care system and used a machine learning approach, called random forest for survival, longitudinal, and multivariate (RF-SLAM) data analysis (10), to develop the Severe COVID-19 Adaptive Risk Predictor (SCARP).
Methods
The data for this study were collected at the 5 hospitals (Johns Hopkins Hospital and Johns Hopkins Bayview Medical Center, Baltimore, Maryland; Howard County General Hospital, Columbia, Maryland; Suburban Hospital, Bethesda, Maryland; and Sibley Memorial Hospital, Washington D.C.) that comprise Johns Hopkins Medicine, a system licensed to operate 2513 beds and 354 intensive care unit beds serving a population of approximately 7 million people. The institutional review boards of the participating hospitals approved this study as minimal risk and waived requirement for informed consent. The methods and reporting of results adhere to TRIPOD (Transparent Reporting of a multivariable prediction model for Individual Prognosis Or Diagnosis) guidelines (11).
Study Design, Participants, and Data Collection
Johns Hopkins created the JH-CROWN: COVID-19 Precision Medicine Analytic Platform Registry to serve as a comprehensive projection of structured clinical data for patients in the Johns Hopkins Medicine system who test positive for severe acute respiratory syndrome coronavirus 2 (SARS-CoV-2). The JH-CROWN database is constructed directly from the clinical electronic health record (as described in the Supplement) and serves as the data source for this study (12). Hospitalized patients diagnosed with COVID-19 who were admitted between 5 March and 4 December 2020 were considered for cohort inclusion. Diagnosis of COVID-19 was defined as the detection of SARS-CoV-2 from any nucleic acid test of any specimen type with an Emergency Use Authorization from the U.S. Food and Drug Administration and an International Classification of Diseases, 10th revision (ICD-10), code indicating the presence of symptomatic disease (Supplement Table 1). Given our goal of predicting future risk for severe illness or death, patients who developed severe illness or died within the first 6 hours of hospitalization were excluded. The remaining study cohort included adult patients (aged ≥18 years) at risk for severe disease or death after the first 6 hours of hospitalization. Some of the patients in this cohort have been included in other studies (13, 14).
Outcome and Variable Definitions
The JH-CROWN registry includes every vital sign, supplemental oxygen recording, and laboratory measurement that compose clinical flowsheets. In addition, structured demographic information and comorbid conditions derived from ICD-10 codes were included (Supplement Table 2) (15). Disease severity was defined with the World Health Organization (WHO) COVID-19 severity scale, a 10-point ordinal scale ranging from uninfected (0 = no viral RNA detected) and ambulatory mild disease (1 = asymptomatic; 2 = symptomatic, independent; 3 = symptomatic requiring assistance) to hospitalized with moderate disease (4 = room air, 5 = nasal cannula or facemask oxygen), hospitalized with severe disease (6 = high-flow nasal cannula or noninvasive ventilation, 7 = intubation and mechanical ventilation [PaO2:FiO2 ratio >150 or SpO2/FiO2 ratio >200], 8 = intubation and mechanical ventilation [PaO2/FiO2 ratio <150 or SpO2/FiO2 ratio <200] or vasopressor use, 9 = intubation and mechanical ventilation [PaO2/FiO2 ratio <150] and vasopressors, dialysis or extracorporeal membrane oxygenation), and 10 = death. The primary outcome was progression to severe illness or death, according to the WHO COVID-19 score of 6 or greater, which includes patients who have died or are hospitalized with respiratory support by noninvasive ventilation, high-flow nasal cannula, or mechanical ventilation (16). The health care workers recording the data used as variables in this clinical registry were blinded to subsequent patient outcomes.
We considered both fixed baseline clinical information and time-varying covariates as potential predictors of COVID-19 severity. Baseline clinical characteristics included demographic characteristics, admission source (for example, from a nursing home), behavioral risk factors (for example, tobacco use, alcohol use), comorbid conditions, and body mass index. Do-not-resuscitate and do-not-intubate statuses were not included as predictor variables, given their relationship with the outcome of interest in our analysis. Time-varying covariates included vital signs, components of a complete blood count with differential, basic metabolic panel, liver function tests, and markers of inflammation and coagulation (ferritin, lactate dehydrogenase, C-reactive protein, interleukin-6, d-dimer, fibrinogen, and international normalized ratio). All covariates and outcomes were binned into 6-hour intervals to account for the time-varying nature of the patient's health state (10). When a single interval contained multiple observations of the same time-varying covariate, the value that represented the most extreme deviation from the normal range was taken to represent the time-varying covariate for that interval. For example, the highest temperature in a 6-hour interval was recorded, whereas for oxygen saturation, the lowest measurement was recorded. Extreme values corresponding to the past 24 hours were also considered for vital signs. Laboratory measurements corresponding to the most abnormal value in the preceding 24 hours were used for the analysis, with the exception of laboratory measurements that are not typically performed daily; for these laboratory variables, the most abnormal values recorded in the past 72 hours were used. Ratios of common laboratory values were calculated and were considered as potential predictor variables. The 72-hour trajectory of vital signs and common laboratory values were reported as the slope calculated by fitting a linear regression model to the data available for the preceding 72 hours. For the analysis, missing data were handled in an adaptive manner during the tree construction process where imputed values for missing data are randomly drawn from the nonmissing data as the trees are constructed in the random forest algorithm (17). Further details regarding variable selection and methods for addressing missing data are found in the Supplement.
Statistical Analysis
We used the machine learning approach RF-SLAM to develop SCARP. A total of 105 variables were considered as inputs into the RF-SLAM predictive algorithm as potential predictors. By learning from data, RF-SLAM allows for the creation of a risk calculator to predict an individual's risk for developing severe illness or death in patients hospitalized with COVID-19. More specifically, RF-SLAM is a method that builds on the concept of decision trees for risk stratification and extends the ensemble learning methodology of random forest (a collection of decision trees) to the analysis of right-censored survival data with time-varying covariates (10). Risk predictions are determined from the ensemble hazard rates from the Bayes estimate of the event rate. The analyses were conducted by using a modification of the randomForestSRC package in the R statistical software (R Foundation) (17–19).
Model Performance
Model performance for the predicted risk for progression to severe illness or death in the next 1 day or 7 days was assessed in 3 ways: 1) estimates of cross-validated performance for predictions developed by using data across all hospital sites between 5 March and 4 December 2020; 2) hospital-specific, cross-validation of performance; and 3) prospective validation, where data from 5 March to 4 July 2020 were used for training and data from 5 July to 4 December 2020 were used to evaluate performance. Model discrimination was evaluated with the cross-validated time-varying area under the receiver-operating characteristic curve (AUC) (20). Model calibration was evaluated with the decile method, in which predicted risks are grouped into 10 deciles and plotted along with loess-based calibration curves (21). Additional details are found in the Supplement.
Interpretability: Variable Importance and Summary Trees
Although random forests are notable for their impressive predictive ability, they have minimal interpretability. This often limits their adoption in clinical practice because of the lack of ability to communicate how the predictions were generated (22). To provide an interpretable visual display as a summary of the RF-SLAM predictions, we created summary regression trees for the 1-day and 7-day predictions as simplified visualizations of the algorithm. In addition, although random forests can handle a large number of predictor variables, inherent variable selection is performed during the tree building process. Each of the many trees that compose the ensemble model (forest) uses only a small subset of available variables. We report the importance of each individual variable to the model by quantifying the percentage of trees that use the variable. To visualize the relationship between each top predictor variable and the predicted risk, we used a dependence plot. This is a scatter plot of the predictions against the predictor variable along with a smooth curve to show the dependence.
Predictor Variables and SCARP
The predictor variables identified in the 1-day and 7-day summary regression trees were included as part of the dynamic web-based risk calculator. The calculator was designed to dynamically provide progressively accurate estimates of the RF-SLAM predictions as users input additional variables. The order of variable input was determined by following the path an individual patient traverses in a combined summary regression tree of 1-day and 7-day predictions to maximize the improvement in prediction accuracy for each variable input. A collection of regression trees was created to best summarize the 1-day and 7-day RF-SLAM predictions for each possible sequence of variable inputs. The interactive, online SCARP tool was developed by using the shiny, shinyjs, and shinydashboard R packages. All analyses were conducted by using the R statistical software, version 3.6.2.
Role of the Funding Source
The data utilized were part of the JH-CROWN: The COVID PMAP Registry, which is based on the contribution of many patients and clinicians and is funded by Hopkins inHealth, the Johns Hopkins Precision Medicine Program. Drs. Garibaldi, Muschelli, Robinson, and Gupta received funding from the COVID-19 Administrative Supplement for the HHS Region 3 Treatment Center from the Office of the Assistant Secretary for Preparedness and Response. The funders had no role in the design, analysis, or conduct of the study or in the decision to submit the manuscript for publication.
Results
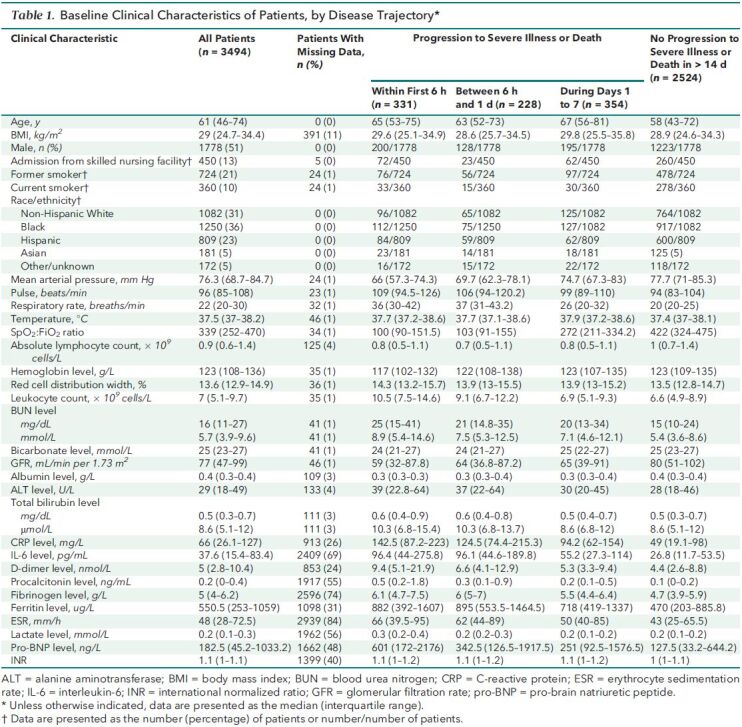
There were 3494 adults admitted between 5 March and 4 December 2020 who tested positive for SARS-CoV-2 by a nucleic acid test and had an ICD-10 code indicative of symptomatic disease. In the first 6 hours of hospitalization, 331 patients developed severe COVID-19; of these, 13 died. The median age of the cohort was 61 years (interquartile range, 46 to 74 years), and 13% were admitted from nursing homes (Table 1). Patients who developed severe illness in the first 6 to 24 hours had an elevated respiratory rate, low SpO2:FiO2 ratio, and elevated C-reactive protein level. There remained 3163 patients at risk for severe illness or death after the first 6 hours of hospitalization (Appendix Figure 1 and Supplement Figure 1).
Table 1. Baseline Clinical Characteristics of Patients, by Disease Trajectory*.
Appendix Figure 1. Study flow diagram.
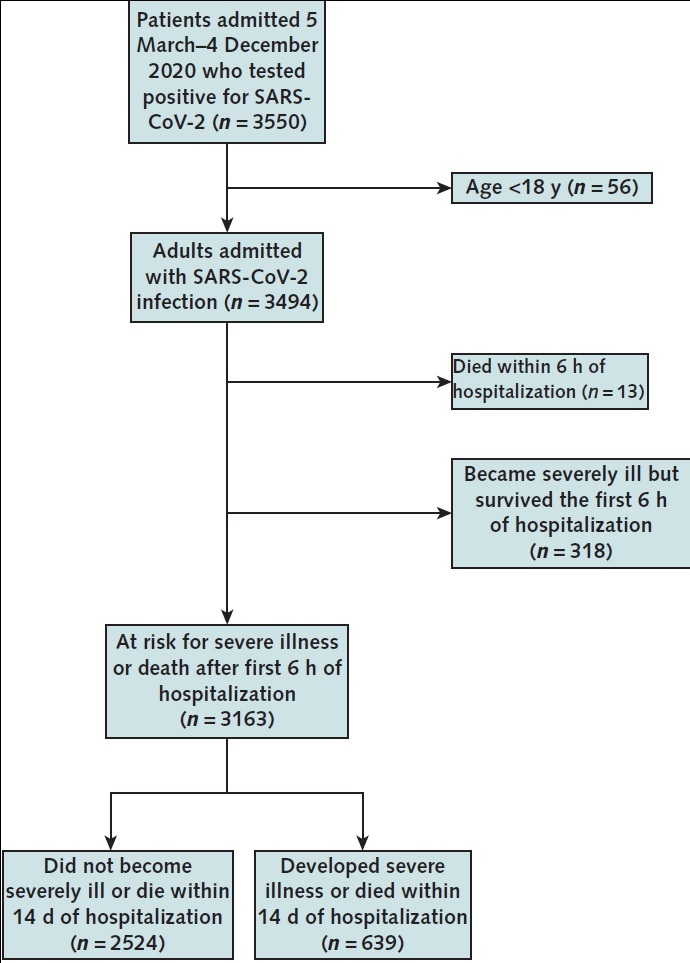
Among patients who were at risk for severe illness or death after the first 6 hours of hospitalization, 639 developed severe illness or death within 14 days of hospitalization. SARS-CoV-2 = severe acute respiratory syndrome coronavirus 2.
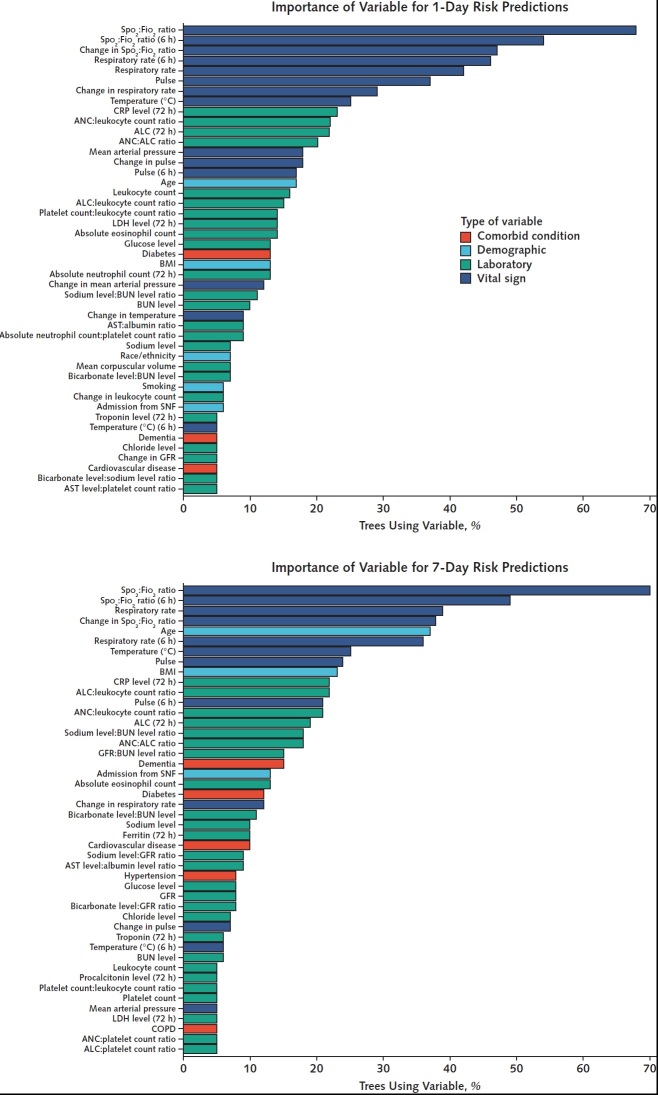
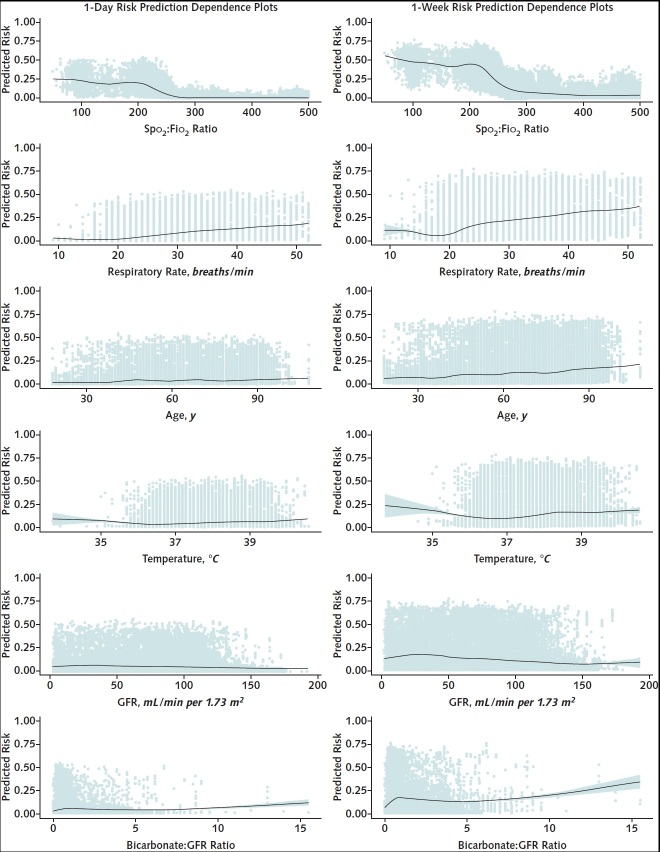
Completeness of laboratory data varied among individual laboratory tests (Table 1). Components of the complete blood count and basic metabolic panel were the most frequently reported laboratory results (Supplement Figure 2). At least 1 measurement of inflammatory markers in the first 7 days of hospitalization before onset of severe disease or death was available for C-reactive protein in 2629 patients (83%), interleukin-6 in 1237 patients (39%), d-dimer in 2678 patients (85%), ferritin in 2492 patients (79%), and lactate dehydrogenase in 1996 patients (63%). Among vital signs, data were missing for 7275 (3%) of 2 549 206-hour patient intervals. Baseline, time-varying, and derived variables were inputs into the RF-SLAM predictive algorithm. The variable importance, determined by the percentage of trees using the variable, was highest for SpO2:FiO2 ratio, respiratory rate, age, and pulse (Figure 1). We then visualized the relationship of the individual variables with the risk predictions (Figure 2).
Figure 1. Variable importance.
The percentage of trees incorporating each of the variables is used as a simple and interpretable measure of variable importance. The variables used by 5% or more of the trees are shown in the plots. Laboratory and vital sign values correspond to values obtained in the past 24 hours unless otherwise specified (for example, “6 h” indicates that the value corresponds to one obtained in the past 6 hours). ALC = absolute lymphocyte count; ANC = absolute neutrophil count; AST = aspartate aminotransferase; BMI = body mass index; BUN = blood urea nitrogen; COPD = chronic obstructive pulmonary disease; CRP = C-reactive protein; GFR: glomerular filtration rate, LDH = lactate dehydrogenase; SNF = skilled nursing facility.
Figure 2. Dependence plots for top predictors of progression to severe illness or death.
Individual data points versus the predicted risk are shown, and the line shows the relationship between the variable and predicted risk.
Performance
We reported the AUC of the RF-SLAM predictive algorithm separately for the first week and the second week to communicate model performance to clinicians and how performance varies during hospitalization (Table 2). The AUC for 1-day predictions was 0.89 (95% CI, 0.88 to 0.90) during the first week of hospitalization and 0.89 (CI, 0.87 to 0.91) during the second week of hospitalization. The AUC for 7-day predictions was 0.83 (CI, 0.83 to 0.84) during the first week of hospitalization and 0.87 (CI, 0.86 to 0.89) during the second week of hospitalization. Model calibration assessed by risk decile demonstrated that the 1-day and 7-day risk predictions were well calibrated (Appendix Figure 2).
Table 2. AUCs for 1-Day and 1-Week Risk Predictions*.

Appendix Figure 2. Calibration curves for predictions of severe illness or death in the next 1 day and 7 days.
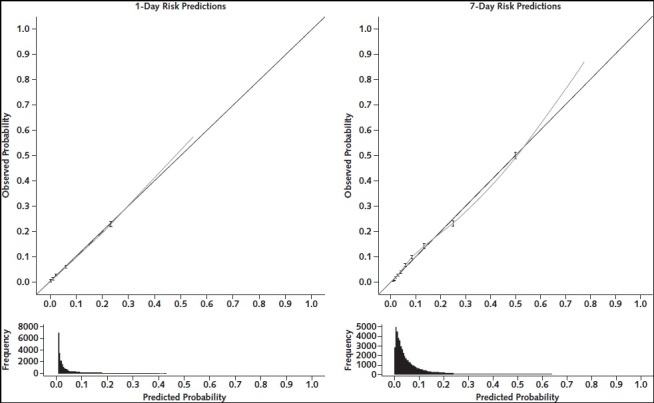
The points and 95% CIs show calibration by decile. Dashed lines indicate linear fit through the decile points. The dotted line shows the locally weighted smoothing (loess) curve through the predicted probabilities versus observed outcomes. Histograms of the distribution of predicted values are shown below the calibration plots.
Interpretability
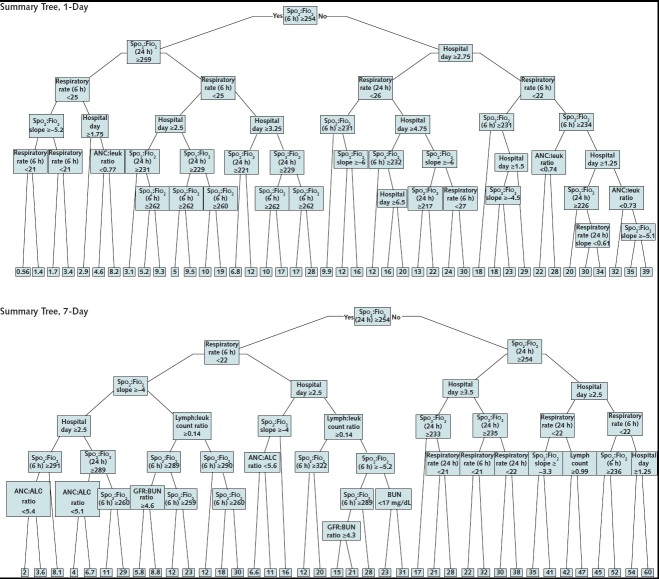
To provide an interpretable overview to clinicians of the logic underlying RF-SLAM predictions, summary decision trees were created for 1-day and 7-day predictions of progression to severe illness or death. The 1-day risk prediction summary tree captured 89% of the variance of the 1-day RF-SLAM risk predictions and the 7-day risk prediction summary tree captured 90% of the variance of the 7-day RF-SLAM risk predictions of severe illness or death (Appendix Figure 3).
Appendix Figure 3. Summary trees of random forest for survival, longitudinal, and multivariate predictions of 1-day and 1-week risk for severe disease or death.
The predicted probabilities are expressed in the terminal nodes and shaded according to predicted probability from lowest risk (0%) to highest risk (100%). ALC = absolute lymphocyte count; ANC = absolute neutrophil count; BUN = blood urea nitrogen; GFR = glomerular filtration rate; leuk = leukocyte; lymph = lymphocyte.
Dynamic Risk Score and Web Application Risk Predictor
For the web-based tool, summary regression trees fitted to the RF-SLAM predictions included at least 15 variables. However, risk prediction for an individual patient requires input of only the variables in the direct path from the start of the summary tree to its terminal leaf. Therefore, for any patient, only a maximum of 8 variables would be required as inputs. The web-based risk prediction calculator SCARP (https://rsconnect.biostat.jhsph.edu/covid_trajectory/) uses adaptive data entry, whereby upon entry of a variable, the algorithm prompts the user for the next variable that best increases the performance of the prediction for that particular patient. This allows users to input a limited number of variables but still benefit from the predictive power of the random forest, which incorporated 105 variables. Detailed instructions for using SCARP are provided in Supplement Figures 3 to 5.
Discussion
We developed SCARP, a novel risk calculator that provides clinically meaningful predictions of whether patients hospitalized with COVID-19 will progress to severe illness or death on the basis of variables that are readily available to treating clinicians. The purpose of this tool is to assist frontline clinicians with real-time prognostication of an individual patient's 1-day and 7-day risk for developing severe illness or death. This tool can inform decisions regarding appropriate level of care and use of scarce hospital resources and can assist clinicians with conversations with patients and family members about a patient's prognosis. Our novel risk calculator was developed with rigorous methodology, including the use of highly granular clinical observations, time-dependent covariates, and discrete time survival analysis in a registry from a diverse 5-hospital health care system. We found that readily available clinical information, such as pulse oximetry, oxygen supplementation, respiratory rate, and pulse, and their trends are highly predictive of progression to severe illness or death. The resulting risk calculator allows clinicians to input a sparse set of adaptively chosen variables for an individual patient into a web-based tool to obtain an accurate probability of progression to severe disease or death in time frames that are highly relevant to patient care.
Knowledge of the immediate risk for progression to severe COVID-19 within the next 24 hours is important to ensure that patients have access to life-saving care and therapeutics. Some patients with moderate COVID-19 progress rapidly from mild hypoxia to respiratory failure requiring intubation (23). As the COVID-19 pandemic has spread from large cities in high-income countries with advanced tertiary care centers to every region of the United States as well as to low- and middle-income countries, patients with COVID-19 are more likely to receive care in settings without access to advanced supportive care. Mortality from COVID-19 is higher in hospitals with fewer intensive care unit beds and in poorer neighborhoods. Accurate prediction of the risk for clinical deterioration in the next 24 hours may guide transfer of patients to the most appropriate setting within an individual hospital or between hospitals in larger health care systems.
Most patients with COVID-19, even those who are hospitalized, recover with only supportive care. For patients with low risk for progression to severe illness or death, the benefit of unproven therapeutics may be limited. Some emerging therapeutics for COVID-19 are most efficacious when administered early in the disease course (24). Clinicians therefore face the challenge of striving to prescribe therapeutics as early as possible, but given resource limitations, may only do so for a subset of patients with COVID-19 (23, 25). The ability to identify the minority of patients with the greatest risk for progression to severe illness or death will allow clinicians to make informed decisions regarding the use of therapeutics and provide clinical trialists with tools to target patients who may benefit most from novel interventions.
Numerous clinical prediction tools for COVID-19 have already been described, but these have several limitations (6, 26–28). Liang and colleagues (6, 26) created calculators to predict severe illness or death that achieved AUCs of 0.88 by using the least absolute shrinkage and selection operator (LASSO) and logistic regression to develop a predictive risk score (called COVID-GRAM) and 0.91 by using a deep learning survival Cox model. However, these methods depend on baseline variables and have limited tolerance to missing data. Furthermore, when applied to a large United Kingdom cohort, COVID-GRAM did not outperform CURB-65, a simple pneumonia severity score (29). The Coronavirus Clinical Characterisation Consortium (4C) mortality score used observations from more than 35 000 patients in the United Kingdom to derive a score that predicts inpatient mortality with an AUC of 0.77. However, the 4C mortality score only provides predictions at hospital admission, and values for all variables must be available for the calculator to function, including C-reactive protein, a laboratory value that is not always available (29). The Northwell COVID-19 Survival Calculator derived from patients in New York has a stable AUC of approximately 0.86 over the first 10 days of hospitalization to predict 7-day mortality, but it also requires input of all variables, including components of a complete blood cell count with differential, which are not always readily available (27). Our prior tool provides accurate prediction of progression to severe disease or death at the time of admission, but it requires input of 23 variables including symptoms, Charlson Comorbidity Index score, and a full suite of laboratory values with limited tolerance for missingness and is applicable only on the day of admission (8). These existing tools do not taken advantage of the predictive potential of time-dependent covariates, including updated measurements of vital signs and the changes in these values, which are among the most important predictors we found for progression to severe illness or death.
The SCARP tool substantially advances the performance and reliability of clinical prediction of COVID-19 severity by using time-varying covariates, highly granular clinical information, and robust survival analysis methods. It is designed to provide interpretable and personalized risk prediction for severe disease or death in patients hospitalized with COVID-19 at any time in the first 2 weeks of their hospitalization. The tool is adaptive and interactive in that it allows users to sequentially input variables to increase the usability and interpretability of clinical prediction. The prediction windows for this tool were based on the clinical demand for determining the trajectory of hospitalized patients at an individual level to inform key decisions regarding clinical care in real time. Clinical features measured after or concomitant with the onset of severe illness do not contribute to prediction; for that reason, we chose to exclude patients who became severely ill or died within the first 6 hours of presentation because their presence would probably unfairly favor the model performance. To further aid in the transparency and interpretability of the predictions from SCARP, we use summary trees to provide visual representations underlying the predictions and further understanding of how the estimation of risk is influenced by each additional variable.
Our study has limitations. Although the JH-CROWN registry includes 5 hospitals serving a mix of urban and suburban populations, the hospitals are all members of a single health system, which may limit the generalizability of SCARP to patients in other health systems. However, as in our previous analyses (8), we observed limited heterogeneity in performance across the hospital sites in this study, suggesting that our tool has the potential to be more broadly applicable to other hospitals. By design, the focus of this work is on the prediction of severe illness or death and is therefore not intended to predict the trajectory of patients who are already severely ill and only predicts outcomes up to a 1-week time frame in the future. Because almost all patients who develop severe illness or die do so in the first 2 weeks of their hospital admission (8), we believe that a 1-week forward-looking predictor will adequately predict progression of disease within a clinically useful timeframe. The cohort is observational and encompasses a period of more than 9 months, during which supportive care standards evolved, treatment options expanded, and clinical trials enrolled participants. As treatment options for COVID-19 expand and outcomes improve, the risk probabilities reported here may overstate the risk for progression to severe disease or death in future patients. We are committed to preserving the long-term utility of this risk calculator by continuously updating the tool and reporting its prospective performance as treatment options for COVID-19 expand and clinical outcomes improve.
In conclusion, we developed SCARP, a novel, easy-to-use clinical prediction tool that adaptively and dynamically reports the probability that an individual patient with COVID-19 will progress to severe illness or death. The tool uses readily available clinical information and has undergone internal and temporal validation. Further studies with national-level, external data sets have been planned for larger-scale validation and generalizability. In addition, work is under way to integrate a simplified version of SCARP into the electronic medical record and assess its utility in clinical practice. SCARP has the potential to serve as a quantitative tool to help guide clinicians managing patients hospitalized with COVID-19, whose clinical courses are complex and seemingly unpredictable, and inform hospital operations to best use resources in meeting the ever-changing demand for intensive care.
Supplementary Material
Footnotes
This article was published at Annals.org on 2 March 2021.
References
- 1. Dong E , Du H , Gardner L . An interactive web-based dashboard to track COVID-19 in real time [Letter]. Lancet Infect Dis. 2020;20:533-534. [PMID: ] doi: 10.1016/S1473-3099(20)30120-1 [DOI] [PMC free article] [PubMed] [Google Scholar]
- 2. The COVID Tracking Project. The Atlantic. Accessed at https://covidtracking.com/data/national/hospitalization on 10 January 2021.
- 3. Richardson S , Hirsch JS , Narasimhan M , et al; the Northwell COVID-19 Research Consortium. Presenting characteristics, comorbidities, and outcomes among 5700 patients hospitalized with COVID-19 in the New York City area. JAMA. 2020;323:2052-2059. [PMID: ] doi: 10.1001/jama.2020.6775 [DOI] [PMC free article] [PubMed] [Google Scholar]
- 4. Williamson EJ , Walker AJ , Bhaskaran K , et al. Factors associated with COVID-19-related death using OpenSAFELY. Nature. 2020;584:430-436. [PMID: ] doi: 10.1038/s41586-020-2521-4 [DOI] [PMC free article] [PubMed] [Google Scholar]
- 5. Zhou F , Yu T , Du R , et al. Clinical course and risk factors for mortality of adult inpatients with COVID-19 in Wuhan, China: a retrospective cohort study. Lancet. 2020;395:1054-1062. [PMID: ] doi: 10.1016/S0140-6736(20)30566-3 [DOI] [PMC free article] [PubMed] [Google Scholar]
- 6. Liang W , Liang H , Ou L , et al; China Medical Treatment Expert Group for COVID-19. Development and validation of a clinical risk score to predict the occurrence of critical illness in hospitalized patients with COVID-19. JAMA Intern Med. 2020;180:1081-1089. [PMID: ] doi: 10.1001/jamainternmed.2020.2033 [DOI] [PMC free article] [PubMed] [Google Scholar]
- 7. Petrilli CM , Jones SA , Yang J , et al. Factors associated with hospital admission and critical illness among 5279 people with coronavirus disease 2019 in New York City: prospective cohort study. BMJ. 2020;369:m1966. [PMID: ] doi: 10.1136/bmj.m1966 [DOI] [PMC free article] [PubMed] [Google Scholar]
- 8. Garibaldi BT , Fiksel J , Muschelli J , et al. Patient trajectories among persons hospitalized for COVID-19: a cohort study. Ann Intern Med. 2021;174:33-41. doi: 10.7326/M20-3905 [DOI] [PMC free article] [PubMed] [Google Scholar]
- 9. Wynants L , Van Calster B , Collins GS , et al. Prediction models for diagnosis and prognosis of Covid-19 infection: systematic review and critical appraisal. BMJ. 2020;369:m1328. [PMID: ] doi: 10.1136/bmj.m1328 [DOI] [PMC free article] [PubMed] [Google Scholar]
- 10. Wongvibulsin S , Wu KC , Zeger SL . Clinical risk prediction with random forests for survival, longitudinal, and multivariate (RF-SLAM) data analysis. BMC Med Res Methodol. 2019;20:1. [PMID: ] doi: 10.1186/s12874-019-0863-0 [DOI] [PMC free article] [PubMed] [Google Scholar]
- 11. Collins GS , Reitsma JB , Altman DG , et al. Transparent Reporting of a multivariable prediction model for Individual Prognosis or Diagnosis (TRIPOD): the TRIPOD statement. Ann Intern Med. 2015;162:55-63. doi: 10.7326/M14-0697 [DOI] [PubMed] [Google Scholar]
- 12. Johns Hopkins Institute for Clinical and Translational Research. COVID-19 Precision Medicine Analytics Platform Registry (JH-CROWN). Accessed at https://ictr.johnshopkins.edu/coronavirus/jh-crown/ on 10 January 2021.
- 13. Ignatius EH , Wang K , Karaba A , et al. Tocilizumab for the treatment of COVID-19 among hospitalized patients: a matched retrospective cohort analysis. Open Forum Infect Dis. 2021;8:ofaa598. [PMID: ] doi: 10.1093/ofid/ofaa598 [DOI] [PMC free article] [PubMed] [Google Scholar]
- 14. Andersen KM , Mehta HB , Palamuttam N , et al. Association between chronic use of immunosuppresive drugs and clinical outcomes from coronavirus disease 2019 (COVID-19) hospitalization: a retrospective cohort study in a large US health system. Clin Infect Dis. 2021. [PMID: ] doi: 10.1093/cid/ciaa1488 [DOI] [PMC free article] [PubMed] [Google Scholar]
- 15. Gasparini A. comorbidity: an R package for computing comorbidity scores. J Open Source Softw. 2018;3:648.
- 16. WHO Working Group on the Clinical Characterisation and Management of COVID-19 infection.. A minimal common outcome measure set for COVID-19 clinical research. Lancet Infect Dis. 2020;20:e192-e197. [PMID: ] doi: 10.1016/S1473-3099(20)30483-7 [DOI] [PMC free article] [PubMed] [Google Scholar]
- 17. Ishwaran H, Kogalur UB, Blackstone EH, et al. Random survival forests. Ann Appl Stat. 2008;2:841-60.
- 18. Ishwaran H, Kogalur UB. Random survival forests for R. R News. 2007;7:25-31.
- 19. Ishwaran H, Kogalur UB. Fast unified random forests for survival, regression, and classification (RF-SRC). R package, version 2.9.3. 2020. Accessed at https://cran.r-project.org/package=randomForestSRC on 19 December 2020.
- 20. Bansal A , Heagerty PJ . A comparison of landmark methods and time-dependent ROC methods to evaluate the time-varying performance of prognostic markers for survival outcomes. Diagn Progn Res. 2019;3:14. [PMID: ] doi: 10.1186/s41512-019-0057-6 [DOI] [PMC free article] [PubMed] [Google Scholar]
- 21. Austin PC , Steyerberg EW . Graphical assessment of internal and external calibration of logistic regression models by using loess smoothers. Stat Med. 2014;33:517-35. [PMID: ] doi: 10.1002/sim.5941 [DOI] [PMC free article] [PubMed] [Google Scholar]
- 22. Wongvibulsin S , Wu KC , Zeger SL . Improving clinical translation of machine learning approaches through clinician-tailored visual displays of black box algorithms: development and validation. JMIR Med Inform. 2020;8:e15791. [PMID: ] doi: 10.2196/15791 [DOI] [PMC free article] [PubMed] [Google Scholar]
- 23. Gupta S , Hayek SS , Wang W , et al; STOP-COVID Investigators. Factors associated with death in critically ill patients with coronavirus disease 2019 in the US. JAMA Intern Med. 2020. [PMID: ] doi: 10.1001/jamainternmed.2020.3596 [DOI] [PMC free article] [PubMed] [Google Scholar]
- 24. Joyner MJ, Senefeld JW, Klassen SA, et al. Effect of convalescent plasma on mortality among hospitalized patients with COVID-19: initial three-month experience. medRxiv. Preprint posted online 12 August 2020. doi:10.1101/2020.08.12.20169359
- 25. Adhikari S , Pantaleo NP , Feldman JM , et al. Assessment of community-level disparities in coronavirus disease 2019 (COVID-19) infections and deaths in large US metropolitan areas. JAMA Netw Open. 2020;3:e2016938. [PMID: ] doi: 10.1001/jamanetworkopen.2020.16938 [DOI] [PMC free article] [PubMed] [Google Scholar]
- 26. Liang W , Yao J , Chen A , et al. Early triage of critically ill COVID-19 patients using deep learning. Nat Commun. 2020;11:3543. [PMID: ] doi: 10.1038/s41467-020-17280-8 [DOI] [PMC free article] [PubMed] [Google Scholar]
- 27. Levy TJ, Richardson S, Coppa K, et al. Development and validation of a survival calculator for hospitalized patients with COVID-19. medRxiv. Preprint posted online 2 June 2020. doi:10.1101/2020.04.22.20075416
- 28. Xiao LS , Zhang WF , Gong MC , et al. Development and validation of the HNC-LL score for predicting the severity of coronavirus disease 2019. EBioMedicine. 2020;57:102880. [PMID: ] doi: 10.1016/j.ebiom.2020.102880 [DOI] [PMC free article] [PubMed] [Google Scholar]
- 29. Knight SR , Ho A , Pius R , et al; ISARIC4C investigators. Risk stratification of patients admitted to hospital with Covid-19 using the ISARIC WHO Clinical Characterisation Protocol: development and validation of the 4C Mortality Score. BMJ. 2020;370:m3339. [PMID: ] doi: 10.1136/bmj.m3339 [DOI] [PMC free article] [PubMed] [Google Scholar]
Associated Data
This section collects any data citations, data availability statements, or supplementary materials included in this article.


