

Abstract
Polycystic ovary syndrome (PCOS) is an endocrine-related disease and global cause of infertility that is associated with abnormal folliculogenesis. Inhibited granulosa cell (GC) proliferation is recognized as a key factor that underlies aberrant follicle maturation. Many epigenetic landscape modifications have been characterized in PCOS patients. However, the epigenetic regulation pathways in follicular dysplasia are not completely understood. In this study, we reported a novel mechanism of DNA hypomethylation induced by long non-coding RNAs (lncRNAs) and its function in cell cycle progression. We observed that lnc-MAP3K13-7:1 was highly expressed in GCs from patients with PCOS, with concomitant global DNA hypomethylation, decreased DNA methyltransferase 1 (DNMT1) expression, and increased cyclin-dependent kinase inhibitor 1A (CDKN1A, p21) expression. In KGN cells, lnc-MAP3K13-7:1 overexpression resulted in cell cycle arrest in the G0/G1 phase, as well as the molecular inhibition and genetic silencing of DNMT1. Mechanistically, lnc-MAP3K13-7:1 inhibited DNMT1 expression by acting as a protein-binding scaffold and inducing ubiquitin-mediated DNMT1 protein degradation. Moreover, DNMT1-dependent CDKN1A promoter hypomethylation increased CDKN1A transcription, resulting in attenuated GC growth. Our work uncovered a novel and essential mechanism through which lnc-MAP3K13-7:1-dependent DNMT1 inhibition regulates CDKN1A/p21 expression and inhibits GC proliferation.
Keywords: DNMT1, epigenetics, granulosa cell proliferation, lncRNA, PCOS, DNA methylation
Graphical Abstract
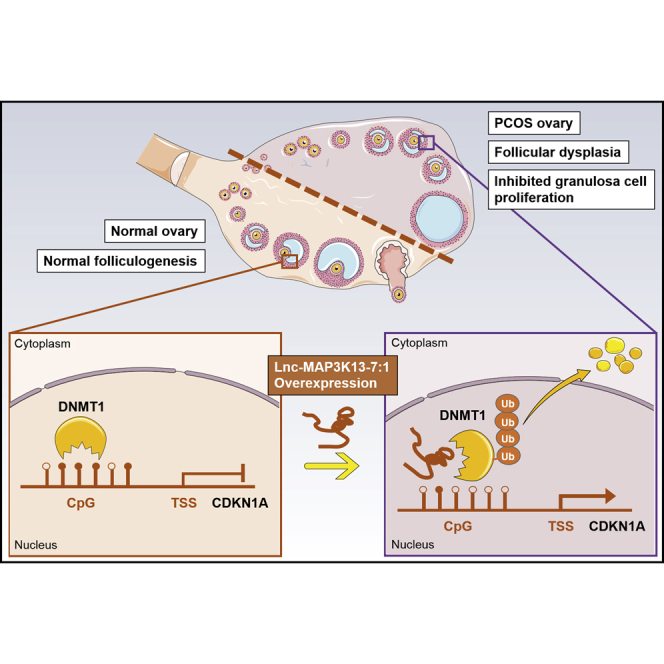
Polycystic ovary syndrome (PCOS) is a common cause of infertility in women that is linked with dysfunctional follicle development. Geng et al. revealed a mechanism by which lnc-MAP3K13-7:1 interacted with DNMT1 to regulate GC growth and potentially influenced folliculogenesis, providing a novel avenue to understand the epigenetic modifications involved in PCOS.
Introduction
Polycystic ovary syndrome (PCOS) is a common and heterogeneous endocrine disorder in reproductive-aged women. Its overall prevalence according to the criteria of Rotterdam is approximately 8%–15%.1, 2, 3 Women with PCOS experience ovarian defects such as arrested follicular development,4,5 anovulation and poor oocyte quality,6,7 which adversely affect their reproductive health. The pathogenesis of PCOS is largely unknown. The follicles of patients with PCOS are arrested in the small antral follicular stage,8 and they cannot be recruited to develop into mature follicles, thereby halting ovulation. The granulosa cells (GCs) in the follicles provide nutrients and growth regulators for the development of oocytes, which are essential for follicular development and ovulation.9,10 Therefore, delays in the proliferation of small antral follicle GCs can delay follicular development, which likely plays an important role in the pathogenesis of PCOS.
Although genetic variations and environmental factors are vital to the development and progression of PCOS,11,12 emerging studies suggest that epigenetics, especially DNA methylation, plays a key role in the pathogenesis of PCOS.13,14 Increased methylation is usually associated with gene silencing or reduced gene expression.15 Persistent changes in the ovarian epigenome lead to altered gene expression, which subsequently affects ovulation,16 steroid hormone synthesis,17 and lipid metabolism18 in ovarian GCs. Previous studies revealed a reduction in the global DNA methylation of ovarian GCs in women with PCOS compared with the findings in healthy controls;18 however, in-depth mechanistic research is needed to elucidate the role of DNA methylation in the pathogenesis of PCOS.
Long non-coding RNAs (lncRNAs) are defined as transcripts longer than 200 nt without coding potential19 that mediate a variety of cellular functions, including chromatin modification and transcriptional and post-transcriptional regulation.20 Despite recent studies demonstrating aberrant lncRNA expression in human GCs from women with and without PCOS,21, 22, 23 only a few of these differentially expressed lncRNAs have been carefully characterized concerning their functional roles in the development of PCOS. Based on available reports, lncRNAs are involved in oocyte development, GC proliferation, and steroidogenesis.24, 25, 26 The preliminary work of our group identified novel lncRNAs that were differentially expressed in luteinized GCs obtained from women with and without PCOS using microarray analysis and characterized that one such lncRNA, named LINC-01572:28, inhibited GC growth by decreasing p27 (Kip1) degradation.27 Despite these findings, the functions of other novel lncRNAs that we found in PCOS are indistinct.
Previous studies uncovered a novel regulatory mechanism of gene methylation governed by lncRNAs, specifically that DNA methyltransferases (DNMTs) may themselves be targets of lncRNAs.28 In accordance with this idea, recent studies have identified lncRNAs that interact with DNMTs to reprogram global DNA methylation, thereby regulating multiple cellular activities.29,30 However, the mechanism by which novel lncRNAs could interact with DNMTs in ovarian GC cells is unclear.
In this study, we identified lnc-MAP3K13-7:1 as a functional lncRNA that could directly bind to DNMT1 and increase its degradation. lnc-MAP3K13-7:1 controlled the expression of the proliferation inhibitor p21 (Waf1/Cip1) by regulating the methylation of its gene promoter region, thereby preventing G1/S cell cycle progression, inhibiting cell proliferation, and ultimately creating a GC growth arrest phenotype. Our study provided novel insights into the mechanisms by which lncRNAs regulate cell proliferation via epigenetic modulation, identified a novel site of epigenetic interpretation in the pathogenesis of PCOS, and led us to propose that lnc-MAP3K13-7:1 might be an important target for mediating GC function.
Results
lnc-MAP3K13-7:1 Expression Was Upregulated in PCOS, whereas the DNA Methylation Level Was Decreased
Given the prior findings of differentially expressed lncRNAs in microarray analysis, we identified a novel lncRNA, dubbed lnc-MAP3K13-7:1 (Figure S1A), and further confirmed this finding using the lncRNA databases LNCipedia and NONCODE (https://lncipedia.org/db/transcript/lnc-MAP3K13-7:1, http://www.noncode.org/show_rna.php?id=NONHSAT093752&version=2&utd=1#). To identify the full-length of the lnc-MAP3K13-7:1 transcript, 5′ and 3′ rapid amplification of cDNA ends (RACE) studies were performed, and the PCR product was validated via sequencing. We confirmed that the lnc-MAP3K13-7:1 transcript was 1,483 nt in length, with an additional 4 nt at the 3′ poly(A) tail compared to the sequence in LNCipedia (Figures S1B–S1D). lnc-MAP3K13-7:1 was identified as a sense intronic lncRNA within an intron of the coding gene VPS8 with no overlap of its exonic sequence, and the lncRNA was found to be highly conserved in humans and fruit flies with no similar sequences found in zebrafish, mice, and apes (Figures S1A and S1E). Analysis of its coding potential strongly indicated that lnc-MAP3K13-7:1 lacked protein-coding capacity (Figure S1F). Consistently, a cellular fractionation assay revealed that lnc-MAP3K13-7:1 transcripts were predominantly localized in the nuclear extract (Figure S1G).
We next confirmed the expression level of lnc-MAP3K13-7:1 in a cohort of 42 women with PCOS and in 42 controls. lnc-MAP3K13-7:1 expression was significantly elevated in GCs from patients with PCOS (Figure 1A). We characterized global DNA hypomethylation changes in another cohort of women with PCOS and controls by assessing 5-methylcytosine (5-mC) levels in the genomic DNA of GCs via ELISA with antibody specific to 5-mC. A significant reduction in the 5-mC level was noted in GCs from women with PCOS (Figure 1B).
Figure 1.

lnc-MAP3K13-7:1 Is Upregulated in Polycystic Ovary Syndrome (PCOS) and Associated with DNA Methyltransferase 1 (DNMT1) Levels
(A) Quantitative real-time PCR detection of lnc-MAP3K13-7:1 expression levels in ovarian granulosa cells (GCs) from 42 patients with PCOS and 42 normal controls (p = 0.0002). (B) Global DNA methylation of genomic DNA sequences from women with PCOS and normal controls. For each group, the whiskers indicate the 10th and 90th percentiles, the central solid line indicates the median, and the mean for each group is noted by “+” in each box (p < 0.0001). (C and D) Quantitative real-time PCR detection of DNMT1 (C) and DNMT3A (D) expression in the same cohort described in (A) (DNMT1, p = 0.0018; DNMT3A, p = 0.0173). (E) Western blot analysis of DNMT1 protein expression in GCs from 18 patients with PCOS and 18 normal controls (p = 0.0171). The 36 samples were derived from the same experiment. In (A)–(E), data are presented as the mean ± SD. In (A), (C), and (E), ∗p < 0.05, ∗∗p < 0.01, ∗∗∗p < 0.001 (Student’s t test). In B, ∗∗∗p < 0.001 (Mann-Whitney U test).
We further explored the expression of DNMTs in GCs between the two groups. The classic DNMTs DNMT1 and DNMT3A were both downregulated at the mRNA level in PCOS (Figures 1C and 1D), whereas DNMT3B mRNA expression remained unchanged (Figure S2A). In addition, DNMT1 protein levels were significantly decreased in another cohort of patients with PCOS versus the controls (Figure 1E), whereas DNMT3A expression did not differ between the groups (Figure S2B). To understand the clinical significance of lnc-MAP3K13-7:1 levels in PCOS, we performed a correlation study and found that lnc-MAP3K13-7:1 expression was positively correlated with serum luteinizing hormone (LH) levels in both patients with PCOS and controls (Figure S3).
lnc-MAP3K13-7:1 Reduced DNMT1 Expression and Prevented Cell Proliferation In Vitro
To explore the molecular mechanisms and functions of lnc-MAP3K13-7:1, we stably overexpressed lnc-MAP3K13-7:1 in KGN cells using a lentiviral system (Figure 2A). To clarify whether lnc-MAP3K13-7:1 could regulate the expression of its neighboring gene VPS8, we first demonstrated that lnc-MAP3K13-7:1 overexpression did not affect VPS8 expression (Figures S4A and S4B). In line with the findings of decreased DNA methylation and DNMT expression in GC cells from patients with PCOS (Figure 1), global DNA methylation levels tended to be lower in KGN cells after lnc-MAP3K13-7:1 transfection (Figure 2B). Real-time PCR demonstrated that lnc-MAP3K13-7:1 overexpression did not change DNMT1 or DNMT3A mRNA expression (Figure 2A). However, western blotting revealed that DNMT1 protein expression, but not DNMT3A protein expression, was decreased by lnc-MAP3K13-7:1 overexpression (Figure 2C).
Figure 2.

lnc-MAP3K13-7:1 Upregulation Decreased DNMT1 Protein Levels and Inhibited GC Proliferation In Vitro
(A) Quantitative real-time PCR analysis of lnc-MAP3K13-7:1 overexpression using lentiviral vectors in KGN cells. Expression of lnc-MAP3K13-7:1 in stably transfected cells in comparison with that in empty vector-transfected cells (left, n = 9, p < 0.0001). Quantitative real-time PCR analysis of DNMT1 and DNMT3A expression after lnc-MAP3K13-7:1 overexpression (middle and right, DNMT1, n = 9, p = 0.614; DNMT3A, n = 3, p = 0.433). (B) Global DNA methylation of KGN cells after lnc-MAP3K13-7:1 overexpression compared with that in empty vector-transfected cells (n = 3, p = 0.0864, Mann-Whitney U test). (C) Western blot analysis of DNMT1 and DNMT3A protein expression in KGN cells after lnc-MAP3K13-7:1 overexpression. The quantification of protein levels is presented at the bottom (n = 3 for each group; DNMT1, p < 0.0001; DNMT3A, p = 0.682). (D) Quantitative real-time PCR detection of cyclin-dependent kinase inhibitor 1A (CDKN1A) expression in GCs from 42 patients with PCOS and 42 normal controls (p = 0.0004). (E and F) Effects of lnc-MAP3K13-7:1 overexpression on KGN cell growth measured using the Cell Counting Kit-8 assay (E, n = 3, p < 0.0001) and cell cycle distribution determined using flow cytometry (F, n = 4, p < 0.0001 for each group). (G) Quantitative real-time PCR analysis of changes in proliferation-related marker expression (proliferating cell nuclear antigen [PCNA] as a positive regulator and CDKN1A and CDKN1B as negative regulators) 72 h after lnc-MAP3K13-7:1 lentivirus transfection (n = 6; PCNA, p = 0.019; CDKN1A, p = 0.004; CDKN1B, p = 0.339). (H) Western blot analysis of changes in proliferation-related marker expression (PCNA, p21, cyclin E1, CDK2, p-CDK2 [Thr160]), retinoblastoma protein [Rb], and p-Rb [Ser807/Ser811]) normalized to β-actin protein expression in lnc-MAP3K13-7:1-overexpressing KGN cells. The quantification of protein levels is presented on the right (n = 3; Rb, p = 0.156; p-Rb, p = 0.003; cyclin E1, p = 0.923; PCNA, p = 0.003; CDK2, p = 0.663; p-CDK2, p < 0.0001; p21, p = 0.007). In (A)–(C) and (E)–(H), mean ± SD. In (A) and (C)–(H), ∗p < 0.05, ∗∗p < 0.01, ∗∗∗p < 0.001 (Student’s t test).
DNMT1 is known to be involved in activation of the cell cycle and DNA replication,31, 32, 33 and p21 (Waf1/Cip1) and DNMT1 are potential antagonists.34 Therefore, we compared the mRNA levels of the cell cycle inhibitor cyclin-dependent kinase inhibitor 1A (CDKN1A, p21) in GCs between patients with PCOS and controls, observing a significant increase in CDKN1A expression in the PCOS group (Figure 2D). These findings prompted us to explore whether lnc-MAP3K13-7:1 induced DNMT1 silencing and affected cell proliferation. Cell Counting Kit-8 (CCK-8) experiments illustrated that the proliferation of KGN cells was greatly inhibited by lnc-MAP3K13-7:1 overexpression (Figure 2E). Using flow cytometry, we observed that lnc-MAP3K13-7:1 overexpression in KGN cells increased the percentage of cells in the G1 phase and decreased the percentage of cells in the S phase (Figure 2F). The expression of proliferating cell nuclear antigen (PCNA), CDKN1A (p21), and CDKN1B (p27) was evaluated using real-time PCR and western blotting. The results confirmed that the levels of the positive regulators of the G1-to-S transition such as phosphorylated retinoblastoma protein (p-Rb) and phosphorylated cyclin-dependent kinase 2 (p-CDK2) were decreased by lnc-MAP3K13-7:1 overexpression, similarly as those of PCNA. Conversely, the mRNA and protein levels of the negative G1-to-S regulator p21 (Waf1/Cip1) were decreased by lnc-MAP3K13-7:1 overexpression, whereas CDKN1B mRNA levels were unchanged (Figures 2G, 2H, and S4C). Moreover, annexin V/7-aminoactinomycin D (7-AAD) flow cytometry illustrated that lnc-MAP3K13-7:1 overexpression did not increase apoptosis (Figure S4D).
lnc-MAP3K13-7:1 Suppressed G1/S Cell Cycle Progression Partly through Silencing DNMT1
To confirm that cell cycle progression was regulated by DNA methylation in GCs, we treated KGN cells with the DNMT inhibitor 5-aza-2′-deoxycytidine (5-Aza), which could incorporate into DNA and inhibit DNMT activity by forming covalent complexes with its catalytic domains of DNMTs, leading to their depletion.35 As expected, we found that DNMT1 levels decreased as the 5-Aza concentration was increased (Figure 3A), and cell cycle progression was mainly blocked in the G0/G1 phase (Figure 3B). Meanwhile, 5-Aza treatment prevented cell proliferation as confirmed using the CCK-8 assay (Figure 3C). We uncovered that some proliferation-related markers such as p-Rb, PCNA, and p-CDK2 were gradually silenced by increasing concentrations of the inhibitor, whereas inhibitors of proliferation such as p21 (Waf1/Cip1) were gradually upregulated (Figures 3D and S5A). To further confirm that DNMT1 directly repressed cell proliferation, we silenced its expression in KGN cells (Figure 3E). The small interfering RNA (siRNA)-mediated silencing of DNMT1 indeed affected both cell cycle progression and cell proliferation (Figures 3F and 3G). The findings of western blotting also supported this result (Figures 3H and S5B).
Figure 3.

The DNMT Inhibitor 5-Aza-2′-Deoxycytidine (5-Aza) Concentration-Dependently Inhibited KGN Cell Proliferation Similarly as DNMT1 Silencing
(A) Western blot analysis of DNMT1 levels following 24 h of treatment with different concentrations of 5-Aza. Different letters (a, b, c) indicate significant differences (n = 4, p ≤ 0.05). (B and C) Effects of 5-Aza treatment on the cell cycle distribution of KGN cells as measured using flow cytometry (B, n = 3; G0/G1, p = 0.0068; S, p = 0.0004; G2/M, p = 0.0009) and growth curves calculated using the Cell Counting Kit-8 assay (C, n = 3, p < 0.0001). (D) Western blot analysis of changes in proliferation-related marker levels (PCNA, p21, CDK2, p-CDK2 [Thr160], Rb, and p-Rb [Ser807/Ser811]) normalized to β-actin protein levels in 5-Aza-treated KGN cells (n = 3). See also Figure S5A. (E) Western blot analysis of DNMT1 silencing using three different siRNAs in KGN cells. The quantification of protein levels is presented on the right (n = 3; si-NC versus si-DNMT1-1, p = 0.005; si-NC versus si-DNMT1-2, p = 0.007; si-NC versus si-DNMT1-3, p = 0.21). (F and G) Effects of DNMT1 silencing on the cell cycle distribution of KGN cells as measured using flow cytometry (F, n = 4) and growth curves as calculated using the Cell Counting Kit-8 assay (G, n = 3, p < 0.0001 for each group). In (G), cell viability was significantly changed by two different siRNAs compared with that in cells transfected with si-negative control (NC). (H) Western blot analysis of changes in proliferation-related marker levels (PCNA, p21, CDK2, p-CDK-2, Rb, and p-Rb) normalized to β-actin levels after DNMT1 silencing in KGN cells (n = 3). See also Figure S5B. In (A)–(H), mean ± SD. ∗∗p < 0.01, ∗∗∗p < 0.001 (Student’s t test). In (A), p < 0.05 (one-way ANOVA).
We next investigated whether DNMT1 mediated the inhibitory effects of lnc-MAP3K13-7:1 on cellular growth. First, we examined the effect of DNMT1 overexpression on the proliferation of KGN cells. As indicated in Figures 4A–4C, cell growth was stimulated when DNMT1 was overexpressed. This evidence supported the findings in Figure 3 and more firmly demonstrated the correlation between DNMT1 and the proliferative phenotype in ovarian GCs. Based on these data, we next conducted a rescue assay by transfecting DNMT1 overexpression plasmids into cells stably overexpressing lnc-MAP3K13-7:1. In lnc-MAP3K13-7:1-overexpressing cells transfected with the control vector, the cell cycle was mainly arrested in the G0/G1 phase. These effects were rescued by DNMT1 overexpression, which resulted in a lower percentage of cells in the G1 phase and a higher percentage of cells in the S phase (Figure 4B). The cell growth curves indicated that lnc-MAP3K13-7:1-induced cell growth repression could be rescued by DNMT1 overexpression (Figure 4C). The western blotting results were consistent with the aforementioned findings, as p-CDK2 and PCNA expression was suppressed by lnc-MAP3K13-7:1 overexpression, and this suppressive effect was rescued by DNMT1 overexpression (Figure 4D).
Figure 4.

Expression of Exogenous DNMT1 Rescued lnc-MAP3K13-7:1-Induced Cell Cycle Arrest
(A) Western blot analysis of DNMT1 and proliferation-related marker expression (PCNA, p21, CDK2, p-CDK2, Rb, and p-Rb) normalized to β-actin protein levels after DNMT1 overexpression in KGN cells (n = 3; DNMT1, p = 0.0002; p-Rb, p = 0.002; Rb, p = 0.7602; PCNA, p = 0.0266; p-CDK2, p = 0.0076; CDK2, p = 0.187; p21, p = 0.0207). (B and C) Cell cycle distribution (B) and cell growth curves (C) after exogenous DNMT1 expression in lnc-MAP3K13-7:1-overexpressing cells. The analysis was performed using Duncan’s multiple range test. Different letters (a, b, c, d) in the same column indicate significant differences (p < 0.05; B, n = 3; C, n = 8). (D) Effects of exogenous DNMT1 expression on protein expression in lnc-MAP3K13-7:1-overexpressing cells. DNMT1 overexpression rescued lnc-MAP3K13-7:1 overexpression-induced protein downregulation. The analysis was performed using Duncan’s multiple range test. Different letters (a, b, c, d) in the same column indicate significant differences (p < 0.05, n = 3). In (A)–(D), data are representative of three independent experiments. Mean ± SD. In (A), ∗p < 0.05, ∗∗p < 0.01, ∗∗∗p < 0.001 (Student’s t test). In (B)–(D), p < 0.05 (one-way ANOVA).
DNMT1 Suppression Led to CDKN1A Upregulation through Decreased Promoter Methylation
Given that DNMT1 could inhibit cell cycle progression, we sought to identify the downstream targets of DNMT1 in cell cycle progression. Previous studies extensively revealed that DNMT1 could regulate the methylation level of gene promoter regions through direct binding, thereby regulating the transcription levels of genes and ultimately affecting cell activity.36 CDKN1A expression was significantly increased in KGN cells by DNMT1 silencing, whereas CKDN1B and TP53 expression did not obviously change (Figure 5A). DNMT1 mRNA levels were decreased after 12 h of 5-Aza exposure before returning to normal by 48 h. Unexpectedly, CDKN1A mRNA levels did not change in first 12 h but surged after 48 h (Figure 5B). This result encouraged us to investigate whether these treatments affected the methylation of the CDKN1A promoter region. Using pyrosequencing, we clarified that DNMT1 silencing or 5-Aza treatment induced a demethylation trend in the CDKN1A promoter region and some significant methylation reductions at specific CpG sites (Figures 5C–5E).
Figure 5.

DNMT1 Silencing or 5-Aza Treatment Upregulated CDKN1A Expression by Decreasing Its Promoter Methylation Levels
(A and B) Quantitative real-time PCR analysis of DNMT1 and negative proliferation marker levels (CDKN1A, CDKN1B, TP53) after DNMT1 silencing using two different siRNAs (A, n = 6 for each group; DNMT1, p < 0.0001; CDKN1A: si-NC versus si-DNMT1-1, p = 0.0004; si-NC versus si-DNMT1-2, p = 0.003; CDKN1B: si-NC versus si-DNMT1-2, p = 0.0012) or after 5-Aza treatment (5 μM) for different durations (B, n = 3 for each group; DNMT1: 12 h, p = 0.0022, 24 h, p = 0.0057; CDKN1A: 24 h, p = 0.0035, 48 h, p < 0.0001; CDKN1B: 24 h, p = 0.0145; TP53: 24 h, p = 0.0324, 48 h, p = 0.0179). (C) The selected pyrosequencing sequence was located upstream of CDKN1A exon 1 and had 16 CpG sites named pos1–pos16. CpG island enrichment in the CDKN1A promoter region was predicted by the MethPrimer website, which was located in the promoter and first exon regions of CDKN1A. (D and E) Methylation status of the CDKN1A promoter CpG island after DNMT1 silencing using two different siRNAs (D, n = 6, pos2, p = 0.0073) or after 5-Aza treatment (5 μM) for different durations (E, n = 5, pos9, p = 0.0166). Pos, CpG site in the CDKN1A promoter; Meth, methylation level. Mean ± SD. ∗p < 0.05, ∗∗p < 0.01, ∗∗∗p < 0.001 (Student’s t test).
lnc-MAP3K13-7:1 Catalyzed the Ubiquitination of DNMT1 through Direct Binding
As we previously demonstrated, lnc-MAP3K13-7:1 downregulated DNMT1 through a post-transcriptional mechanism. We next explored the mechanism by which lnc-MAP3K13-7:1 silences DNMT1 expression. Considering the foremost localization of lnc-MAP3K13-7:1 in the nucleus, we wondered whether lnc-MAP3K13-7:1 could regulate DNMT1 mRNA localization or, in other words, prevent DNMT1 mRNA from leaving the nucleus and entering the cytoplasm for translation. We performed an RNA cellular fractionation assay and found that the distribution of DNMT1 mRNA was not significantly changed by lnc-MAP3K13-7:1 overexpression (Figure 6A). Based on this finding, we further considered whether lnc-MAP3K13-7:1 influenced DNMT1 protein degradation. Immunofluorescence staining and protein subcellular fractionation assays demonstrated that lnc-MAP3K13-7:1 overexpression promoted DNMT1 protein from initially aggregating in the nucleus to disperse into the cytoplasm (Figures 6B and 6C). Because DNMT1 mainly functions as a DNMT in the nucleus, it is primary degraded by the ubiquitin-proteasome pathway.37 Thus, we speculated that lnc-MAP3K13-7:1 could facilitate DNMT1 degradation. We treated KGN cells with carbobenzoxy-l-leucyl-l-leucyl-l-leucinal (MG132) to block the degradation of ubiquitinated proteins by proteasomes and found that lnc-MAP3K13-7:1-induced DNMT1 downregulation could be blocked by the addition of MG132 (Figure 6D). Meanwhile, protein stability analysis revealed a significantly reduced half-life of DNMT1 in lnc-MAP3K13-7:1-upregulated cells (Figure 6E). These results suggested that lnc-MAP3K13-7:1 was involved in proteasome-mediated DNMT1 degradation. To further verify our hypothesis, the interaction between ubiquitin and DNMT1 was assessed using co-immunoprecipitation (coIP) assays, and increased lnc-MAP3K13-7:1 expression resulted in increased DNMT1 ubiquitination (Figure 6F). Furthermore, RNA immunoprecipitation (RIP) assays illustrated that lnc-MAP3K13-7:1 could directly bind to DNMT1 (Figure 6G).
Figure 6.

lnc-MAP3K13-7:1 Directly Bound DNMT1 and Facilitated DNMT1 Ubiquitination and Translocation
(A) Quantitative real-time PCR analysis of nuclear and cytoplasmic DNMT1 expression in lnc-MAP3K13-7:1-overexpressing KGN cells using an RNA cellular fractionation assay. ACTIN and U6 were used as cytoplasmic and nuclear controls, respectively (n = 4). (B) Representative images of DNMT1 protein expression (red) in lnc-MAP3K13-7:1-overexpressing KGN cells and control cells using immunofluorescence staining. Images are representative of three independent experiments. Nuclei were counterstained with DAPI. Scale bars, 100 μm. (C) Western blot analysis of DNMT1 protein expression in different subcellular fractionations in lnc-MAP3K13-7:1-overexpressing KGN cells. Glyceraldehyde-3-phosphate dehydrogenase and lamin A/C served as cytoplasmic and nuclear markers, respectively. The quantification of protein expression is presented on the right. Different letters (a, b, c) in the same column indicate significant differences (p < 0.05, n = 3). (D) DNMT1 protein degradation was observed after 8 h of exposure to high concentrations (100 μM) of the proteasome inhibitor MG132 but not after treatment with low concentrations (1 and 10 μM) (n = 4; DMSO, p = 0.003; MG132, 1 μm, p = 0.004; MG132, 10 μm, p = 0.0008). (E) Stabilization of DNMT1 protein expression following treatment with cycloheximide (CHX). KGN cells were transfected with vector (control) or lnc-MAP3K13-7:1 overexpression plasmids and treated with 100 μM CHX for the indicated times. β-Actin was used as a loading control. DNMT1 levels were quantified and expressed as percentages relative to the control (n = 3, 10 h, p = 0.0406). (F) Immunoprecipitation assay of DNMT1-ubiquitin in KGN cells. KGN cells were transfected with lnc-MAP3K13-7:1 lentiviral vectors and treated with 100 μM MG132. Whole-cell lysates were prepared and subjected to immunoprecipitation using anti-DNMT1 antibodies. Immunoprecipitates were probed to detect the polyubiquitination of DNMT1 using anti-ubiquitin antibodies. Approximately 5% of the cell lysates used for co-immunoprecipitation were loaded as the inputs. Immunoglobulin G (IgG) was used as a control (n = 4, p = 0.0028). (G) Quantitative real-time PCR analysis of lnc-MAP3K13-7:1 enrichment in DNMT1 RNA immunoprecipitates in lnc-MAP3K13-7:1-overexpressing KGN cells. IgG was used as a negative control, and EZH2 was used as a positive control. Nuclear paraspeckle assembly transcript 1 was used as a negative control, and uridine-rich 1 small nuclear RNA was used as positive controls for quantitative real-time PCR (n = 6 for DNMT1 primers, n = 3 for controls). In (A) and (D)–(G), data are presented as the mean ± SD. ∗p < 0.05, ∗∗p < 0.01, ∗∗∗p < 0.001 (Student’s t test). In (C), data are presented as the mean ± SD. p < 0.05 (one-way ANOVA).
Discussion
lnc-MAP3K13-7:1 represents one of the few lncRNAs that regulate DNA methylation,28 and it is the first recognized lncRNA to modulate ovarian GC proliferation through interactions with DNMTs. Recent studies identified lncRNAs as novel players in the regulation of DNA methylation. lncRNAs can act in a cis (at the site of transcription) or a trans (far from the transcription sites) manner. For example, HOTAIR silences the HoxD locus in a cis manner by recruiting polycomb repressive complex 2 to modify the chromatin structure.38 Conversely, H19 can inhibit SAHH in a trans manner, thereby blocking DNMT3B-mediated methylation at numerous genomic loci.39 This is an intriguing model for regulating key epigenetic modification events in specific diseases. Previous studies of the epigenetic pathogenesis of PCOS only assessed the role of DNA methylation or lncRNA alone, and we innovatively found the connection between the two. Our study first described the low expression of DNMT1 in the GCs of women with PCOS, and it might be the key to the DNA hypomethylation in PCOS. The reason for the inconsistent behaviors in mRNA level and protein level of DNMT3A may be that DNMT3A plays a crucial role in oogenesis and the establishment of genomic imprinting,40 and therefore its expression is relatively conserved. Our findings suggested that the lncRNA could participate in the establishment of genomic methylation patterns by interacting with DNMT1 and cause aberrant DNA methylation though site-specific adjustments. This proposal will provide a broader perspective for epigenetic research in PCOS.
DNA methylation is the clearest and most classic epigenetic modification in mammals.41 The only known chemical modification of genomic DNA in mammals is the addition of a methyl group at position C5 in CpG dinucleotides by DNMTs.42 DNMT1 participates in the maintenance of genome methylation by adding methyl groups to hemi-methylated DNA strands during DNA replication.43 This protein is highly expressed during the S phase, and it interacts with PCNA.34 The relationship between DNA methylation and cell growth was previously established. Rhee et al.44 found that the disruption of DNMT1 and DNMT3B in HCT116 colon cancer cells reduced 5-mC content by 95% and slowed cell growth. Conversely, DKO8 cells retained higher methylation levels and grew more rapidly following disruption of these genes. Meanwhile, Egger et al.45 confirmed that DNMT1 helps maintain DNA methylation, and it is essential for cell proliferation. Accumulating evidence suggests that DNMT1 is associated with the expression of p21 (Waf1/Cip1).31,46 Of particular note, previous studies did not emphasize the specific mechanism by which DNMT1 influences cell proliferation. Our findings provided the first evidence that DNMT1 silencing could epigenetically increase CDKN1A expression by decreasing its promoter methylation in KGN cells. Because of time and technical constraints, we only tested a few candidate targets of DNMT1, and only CDKN1A expression was altered when DNMT1 was overexpressed or silenced. However, we think that the CDKN1A gene is not the only target of DNMT1 involved in cell growth, and dynamic intracellular methylation changes must affect other candidate genes and related pathways that are worthy of further research.
In the physiological state, the membrane protrusions of GCs in the preantral follicles can pass through the zona pellucida and form a gap connection with the cell membrane of oocytes. The contact of these cell membranes provides a channel for bidirectional communication and nutrition support. The proliferation of GCs in the primary follicles increases the cell layers and impels the follicles to become secondary follicles. GCs continue to develop after the recruitment of estrogen and follicle-stimulating hormone (FSH), and the follicles with the lowest FSH threshold become dominant follicles.47 CDKN1A expression is altered in different follicle developmental stages. A prior study suggested that CDKN1A mRNA expression is significantly higher in GCs from estrogen-inactive dominant follicles and pre-ovulatory follicles than in those from other follicles.48 After the ovulatory trigger, CDKN1A is upregulated to inhibit GC proliferation, and it is essential for the initial decline in GC mitosis.49 The aforementioned results indicate that during follicular development, CDKN1A expression is decreased in GCs to actively stimulate their growth, allowing them to develop synchronously with follicles. However, more ovarian follicular arrests, fewer mature follicles, and more frequent anovulation are observed in patients with PCOS compared with the findings in healthy controls. The available data suggest that GC dysfunction may contribute to the abnormal folliculogenesis and anovulation observed in PCOS, as weakened GC proliferation resulted in insufficient nutrition and communication for oocyte development.50,51 In rat experiments, high-fat diet-induced obesity triggered the arrest of GCs by inducing CDKN1A expression, thereby causing abnormal follicular development.52 Earlier studies by our group also demonstrated that PCNA levels in the GCs of patients with PCOS are significantly decreased, corresponding with significantly increased p27 protein levels and suggesting abnormally low GC proliferation in patients with PCOS.27 Two different studies focusing on miRNA functions in PCOS both mentioned that the CDKN1A levels in patients with PCOS are increased and regulated by PTEN or MST4.53,54 Our findings of elevated CDKN1A expression in patients with PCOS are consistent with these prior results. However, some controversy remains concerning CDKN1A levels in GCs from patients with PCOS. Two studies using ovarian cortices suggested that CDKN1A levels were reduced in patients with PCOS.55,56 It is noteworthy that the former two studies used luteinized GCs for sequencing, while the latter two used excised ovarian cortexes. When the non-coding RNA sequencing results obtained from these two types of samples were verified on KGN cells, the target gene CDKN1A changed oppositely. It is not enough to explain this only with the small numbers of participants or the complex cell components in the ovarian cortex. As we mentioned before, the expression of CDKN1A in GCs from pre-ovulatory follicles and after ovulation is higher than that of GCs during the follicular phase. It could mean that the basic CDKN1A expression of the collecting luteinized GCs is relatively high. Therefore, when elucidating the mechanism of follicular arrest, neither ovarian cortexes nor luteinized GCs are the most ideal model. The sequencing results obtained by luteinized GCs might demonstrate the luteal dysfunction in PCOS patients more accurately than explaining the dysplasia of follicles.57 It means that lnc-MAP3K13-7:1 may also play a role in the synthesis of progesterone and the maintenance of the corpus luteum, which is a novel view that is worth exploring in the future.
In the study, we used human luteinized GCs (hLGCs) derived from women with and without PCOS to validate the microarray results, and performed proliferation-related functional and mechanism verification in KGN cells. It is noteworthy that hLGCs are collected after gonadotropin stimulation and induction of ovulatory process, so-called collecting luteinized GCs. KGN cells are from a patient with invasive ovarian GC carcinoma,58 which can basally secrete progesterone and also have high aromatase activity to produce estrogen in the presence of substrate androgen. These make KGN cells have some of the characteristics of luteinized GCs. The internal pattern of luteinized GCs is different from that of GCs in the follicular phase. Specifically, the transition from GCs to luteal cells leads to a rapid shift from estrogen production to predominantly progesterone production.59 There were not mutually exclusive between luteinization and proliferation, luteinized GCs still had the capability to proliferate.60 Therefore, although there are differences between GCs and luteal cells, there is no direct evidence to prove the obvious difference between the proliferation phenotypes of the two. Despite this, KGN cells might not reflect the in vivo mechanisms involved in the follicular development stage. Non-luteinized GCs are the most ideal cell model, but we cannot obtain them due to the limitations of current technology. Another approach is to isolate mice follicles and in vitro culture of the follicles.61 Due to the species conservation of lnc-MAP3K13-7:1, we could not perform this experiment on rodents.
According to our results, the regulation of DNA methylation by lncRNAs could be an essential mechanism for the regulation of gene expression in PCOS. Because no homologous non-coding RNA was found in experimental animals such as zebrafish and mice, we were unable to perform in vivo functional experiments of lnc-MAP3K13-7:1. However, methyl donor supplementation animal models are worthy of consideration. Several lines of evidence illustrated that methyl donor supplementation improves multiple phenotypes associated with PCOS through epigenetic alterations. First, the maternal intake of methyl group donors can affect the DNA methylation of metabolic genes in the offspring.62 Subsequently, methyl donor supplementation can reverse hepatic triglyceride accumulation induced by high-fat/sucrose diets,63 and the transgenerational amplification of obesity prevalence and severity can be prevented by methyl donor supplementation.64 Second, it has been reported that patients with type 2 diabetes have decreased circulating folate levels.65 Additionally, animal experiments and methylated DNA immunoprecipitation/high-throughput sequencing have also confirmed that folate supplementation reduced fat mass and serum glucose levels and improved insulin resistance in high-fat diet-fed mice by inducing DNA methylation and expression changes in genes associated with obesity and insulin secretion.66 In addition, the lack of choline in the maternal diet causes changes in the DNA methylation level of genes involved in cell cycling in the fetal brain.67 Third, an observational study involving 18,555 women revealed that folate supplementation reduced the risk of ovulatory infertility.68 Furthermore, in a mouse model, moderate-dose folate supplementation was associated with a decrease in the proportion of developmentally delayed embryos following assisted reproduction in mice and resolved the female-biased aberrant imprinted gene methylation.69 It is thought that the dietary manipulation of methyl donors (either supplementation or deficiency) can induce stable changes in gene methylation, altering gene expression and potentially affecting reproductive outcome. Therefore, further exploration of methyl group donor supplementation in vivo will lead to a more comprehensive understanding of the role of DNA methylation in GC proliferation and validate its utility as a new treatment for PCOS, thereby providing new evidence supporting the use of folate supplementation before pregnancy.
In this study, we unraveled the function of lnc-MAP3K13-7:1 in regulating GC proliferation. We demonstrated that lnc-MAP3K13-7:1 prevented cell cycle progression by silencing DNMT1 and upregulating CDKN1A/p21. Mechanistically, lnc-MAP3K13-7:1 directly bound to DNMT1 and induced its ubiquitination-dependent degradation, thereby suppressing the DNA methylation of the CDKN1A promoter, inhibiting GC proliferation, and promoting the development of PCOS (Figure S6). Therefore, lnc-MAP3K13-7:1 might be a potential marker for future epigenetic diagnosis for PCOS.
Materials and Methods
Clinical Samples
Ovarian GCs were collected from patients with and without PCOS in the Center for Reproductive Medicine in Ren Ji Hospital Affiliated to Shanghai Jiao Tong University School of Medicine between March 2017 and November 2019. The Medical Ethics Committee of Ren Ji Hospital Affiliated to Shanghai Jiao Tong University School of Medicine approved this study process (no. 2017041411), and all participants provided written informed consent. The main reference for the diagnostic criteria of PCOS was the Rotterdam Consensus for PCOS revised in 2003.3 Basic and PCOS-related anthropometric variables, such as age, body mass index, and levels of FSH, LH, testosterone, estradiol, and anti-Müllerian hormone, are presented in Tables S1–S3. Human ovarian GCs were obtained from patients’ follicular fluid as previously described.70
Cell Culture and Treatments
The human GC line KGN was cultured in Dulbecco’s modified Eagle’s medium/nutrient mixture F-12 (DMEM/F12) (Gibco, Grand Island, NY, USA) containing 10% charcoal-stripped fetal bovine serum (Thermo Fisher Scientific, Waltham, MA, USA) and 1% antibiotics (mixture of penicillin, streptomycin, and neomycin; Gibco) in a 37°C, 5% CO2 incubator (Thermo Fisher Scientific, Waltham, MA, USA). Cells were passaged every 3 days. KGN cells were authenticated via short tandem repeat PCR profiling, and no cross-contamination by other human cells was observed in March 2019.
For 5-Aza treatment, cells were seeded into six-well plates. Twenty-four hours later, cells were washed and replaced with fresh medium containing 5-Aza (50 nM to 5 μM, Sigma-Aldrich, St. Louis, MO, USA).71 Then, cells were collected at the indicated times for use in various experiments. For MG132 treatment, cells were harvested after 8 h of treatment (1–100 μM, Selleck Chemicals, Houston, TX, USA).72 In addition, cells were treated with 100 μM cycloheximide (CHX, Cell Signaling Technology, Beverly, MA, USA) and collected every 2 h to assess DNMT1 protein stability.73
5′ and 3′ RACE
Total RNA was extracted from KGN cells using a TRIzol Plus RNA purification kit (Invitrogen, Carlsbad, CA, USA). The 5′ RACE and 3′ RACE experiments were performed using a GeneRacer kit (Invitrogen) according to the manufacturer’s instructions. The RACE primers targeting lnc-MAP3K13-7:1 used for the PCR are listed in Table S4. RACE PCR products were cloned into the pGM-T vector (Sangon Biotech, Shanghai, China) and sequenced.
Cell Transfection
The DNMT1 (NM_001130823.3) sequence was cloned into pCMV3 plasmids (Transheep, Shanghai, China) to overexpress DNMT1. Three independent siRNAs against DNMT1 (Table S5) were obtained from Biotend (China). Plasmids and/or siRNAs were transfected into KGN cells using Lipofectamine 3000 (Invitrogen, Carlsbad, CA, USA) according to the manufacturer’s instructions. Full-length lnc-MAP3K13-7:1 expression lentiviral vectors and blank vectors were obtained from GeneChem (Shanghai, China). After transduction, cells were cultured for 48 or 72 h before further treatment.
CCK-8 assay
The CCK-8 assay was performed using a commercial kit (Dojindo, Kumamoto, Japan) according to the manufacturer’s protocol. Briefly, 100 μL of a suspension containing 1 × 10⁴ KGN cells was added to each well of a 96-well plate. After treatment for 24, 48, 72, or 96 h, 10 μL of CCK-8 solution was added to each well. Cell viability was measured according to the absorbance at 450 nm.
Cell Cycle Analysis
KGN cells were incubated for 24 h in six-well plates and harvested via trypsinization 24, 48, or 72 h after drug treatment or transfection with siRNAs and/or plasmid DNA. The cells were washed with pre-cooled phosphate-buffered saline (PBS), and then the cells were centrifuged, re-suspended in 70% pre-cooled (−20°C) ethanol for cell fixation, and incubated at 4°C for 24 h. The fixed cells were centrifuged and washed with PBS. Then, 500 μL of propidium iodide/RNase staining buffer (BD Pharmingen, San Diego, CA, USA) was added for cell re-suspension. After incubation in the dark for 15 min, cells were filtered using 400-mesh sieves. Cell cycle analysis was performed using a flow cytometer (BD FACSCalibur, BD Biosciences, CA, USA).
Cell Apoptosis Assay
Cells were seeded, incubated, and treated in six-well plates. A cell apoptosis assay was performed using flow cytometry. Briefly, 1 × 10⁵ cells were re-suspended in binding buffer, incubated with 5 μL of phycoerythrin (PE)-annexin V and 5 μL of 7-AAD for 15 min in the dark at room temperature and analyzed using flow cytometry within 1 h.
DNA Isolation and Quantification of 5-mC
Total DNA was extracted from cells using a QIAGEN DNA mini kit (QIAGEN, Hilden, Germany), and DNA levels were measured using a NanoDrop spectrophotometer (Thermo Fisher Scientific). Global methylation of GCs was determined using a MethylFlash methylated DNA quantification kit (EpiGentek, NY, USA). Briefly, the same amount of genomic DNA from GCs was bound to the assay plate, and capture antibody was added into the wells, followed by a detection antibody, enhancer solution, and color development solution. The methylated fraction of DNA was quantified colorimetrically by reading the absorbance at 405 nm. The amount of methylated DNA was proportional to the optical density (OD).
RNA Extraction and Real-Time PCR
Total RNA was extracted from cells using TRIzol (Invitrogen), and RNA levels were measured using agarose gel electrophoresis. An RNA cellular fractionation assay was performed using a Paris kit (Invitrogen) to isolate nuclear and cytoplasmic RNA from cultured cells according to the instruction manual. Subsequently, the isolated RNA was reverse transcribed into cDNA (PrimeScript RT master mix, Takara, Dalian, China). Target gene expression was measured by real-time PCR using SYBR Premix Ex Taq (Takara). The 2−ΔΔCt method was applied to analyze mRNA expression levels normalized to those of β-actin (ACTB). The primer sequences of the tested genes are listed in Table S6.
Western Blot Assay
Cells were lysed in ice-cold radioimmunoprecipitation assay lysis buffer (Shenggong, Shanghai, China) supplemented with additional protease and phosphatase inhibitors (Roche, Basel, Switzerland). Proteins from nuclear and cytoplasmic compartments were extracted using a ProteoExtract subcellular proteome extraction kit (Millipore, Burlington, MA, USA) according to the manufacturer’s instructions. Equal amounts of proteins were denatured at 100°C for 10 min and then electrophoresed on a 10%–15% SDS-polyacrylamide gel. The bands were wet transferred to a nitrocellulose membrane before being blocked with 5% non-fat milk. After primary and secondary antibody incubation, a horseradish peroxidase detection system supplied by Syngene was used to detect the blots. Relative protein expression was analyzed using ImageJ and normalized to β-actin or glyceraldehyde-3-phosphate dehydrogenase expression. The relative phosphorylation of target proteins was calculated as the ratios of phosphorylated proteins to target proteins. The related antibody information is summarized in Table S7.
Immunofluorescence
For immunofluorescence, cells were seeded onto microscope slides (Millipore). After culture and treatment, cells were fixed with −20°C pre-cooled acetone for 15 min at room temperature. After three washes with PBS, the slides were permeated using 0.5% Triton X-100 in PBS for 20 min at room temperature, followed by blocking in 10% normal goat serum for 30 min at room temperature. A sufficient amount of diluted primary antibody was added to each slide, which was then incubated in a wet box at 4°C overnight. After blocking with a fluorescent secondary antibody, the slides were then counterstained with DAPI and imaged under a fluorescence microscope (Zeiss, Jena, Germany).
CoIP
coIP was performed as described previously.27 Briefly, whole KGN cell extracts (100 μg of total protein) were incubated with DNMT1 antibody or normal rabbit immunoglobulin G (IgG) at 4°C overnight. Then, the protein-antibody complex was incubated under agitation with 15 μL of magnetic protein A/G beads for 1 h at 4°C. The proteins in the complex were eluted by adding 20 μL of SDS loading buffer and incubated for 10 min at 100°C before separation on a SDS-PAGE gel. The samples were transferred to nitrocellulose membranes, blocked with 5% milk, and probed with a monoclonal antibody against ubiquitin (P4D1).
RIP Assay
An RIP assay was performed using a Magna Nuclear RIP (cross-linked) nuclear RNA-binding protein immunoprecipitation kit (Millipore, Burlington, MA, USA) according to the manufacturer’s protocol. DNMT1, EZH2, and normal IgG antibodies were used for this assay, IgG was used as negative IP controls, and EZH2 was used as positive IP controls. Additionally, two pairs of lnc-MAP3K13-7:1 primers, a uridine-rich 1 small nuclear RNA primer (NEAT1), and a nuclear paraspeckle assembly transcript 1 primer (U1) were used for real-time PCR. NEAT1 primer was used as a negative control and U1 was used as a positive control.
Pyrosequencing
Genomic DNA was extracted from treated cells and subjected to bisulfite conversion and clean-up using an EZ DNA Methylation-Gold kit (Zymo Research) according to the manufacturer’s protocol. The CDKN1A (p21) promoter primers (Table S8) used for pyrosequencing were designed by PyroMark Assay Design 2.0 and synthesized by Sangon Biotech. PCR was performed to amplify samples using TaKaRa EpiTaq HS (TaKaRa). In total, 15–20 μL of PCR products was taken and used for sequencing analysis using a PyroMark Q96 RT quantitative pyrophosphate sequence analyzer (QIAGEN).
Statistical Analysis
Data are presented as the mean ± SD. The experiment was designed to use three to five samples/independent repeats per experiment/group. Statistical analysis was performed using IBM SPSS Statistics and GraphPad Prism. Statistical significance was analyzed using Levene’s test for equality of variances followed by a two-tailed Student’s t test. Data from multiple groups were compared using one-way ANOVA with Duncan’s multiple range test. The correlation of two datasets was analyzed using Pearson’s correlation coefficient when equal variance was assumed. p <0.05 denoted statistical significance.
Acknowledgments
This work was supported by grants from the National Key Research and Development Program of China (nos. 2018YFC1003202 and 2017YFC1001002); the National Natural Science Foundation of China (nos. 81971343, 81671414, and 81671413); the National Institutes of Health (project no. 1R01HD085527); and by the Shanghai Commission of Science and Technology (nos. 19410760300 and 20DZ2270900). We would like to thank Servier for schematic art pieces in the graphical abstract, which were provided by Servier Medical Art. Servier Medical Art by Servier is licensed under a Creative Commons Attribution 3.0 unported license (https://creativecommons.org/licenses/by/3.0/).
Author Contributions
X.G. and J.Z. designed the experiments. X.G., J.Z., and J.H. performed most of the experiments. X.G., J.Z., and S.L. analyzed and interpreted the data. X.G. wrote the manuscript. J.Z., J.H., S.L., W.C., W.W., and Y.D. reviewed and/or revised the manuscript. Z.-J.C. and Y.D. gave the administrative and material support. All authors read and approved the final manuscript.
Declaration of Interests
The authors declare no competing interests.
Footnotes
Supplemental Information can be found online at https://doi.org/10.1016/j.ymthe.2020.11.018.
Supplemental Information
References
- 1.Bozdag G., Mumusoglu S., Zengin D., Karabulut E., Yildiz B.O. The prevalence and phenotypic features of polycystic ovary syndrome: a systematic review and meta-analysis. Hum. Reprod. 2016;31:2841–2855. doi: 10.1093/humrep/dew218. [DOI] [PubMed] [Google Scholar]
- 2.Skiba M.A., Islam R.M., Bell R.J., Davis S.R. Understanding variation in prevalence estimates of polycystic ovary syndrome: a systematic review and meta-analysis. Hum. Reprod. Update. 2018;24:694–709. doi: 10.1093/humupd/dmy022. [DOI] [PubMed] [Google Scholar]
- 3.Rotterdam ESHRE/ASRM-Sponsored PCOS Consensus Workshop Group Revised 2003 consensus on diagnostic criteria and long-term health risks related to polycystic ovary syndrome. Fertil. Steril. 2004;81:19–25. doi: 10.1016/j.fertnstert.2003.10.004. [DOI] [PubMed] [Google Scholar]
- 4.Franks S., Stark J., Hardy K. Follicle dynamics and anovulation in polycystic ovary syndrome. Hum. Reprod. Update. 2008;14:367–378. doi: 10.1093/humupd/dmn015. [DOI] [PubMed] [Google Scholar]
- 5.Webber L.J., Stubbs S., Stark J., Trew G.H., Margara R., Hardy K., Franks S. Formation and early development of follicles in the polycystic ovary. Lancet. 2003;362:1017–1021. doi: 10.1016/s0140-6736(03)14410-8. [DOI] [PubMed] [Google Scholar]
- 6.Palomba S., Daolio J., La Sala G.B. Oocyte competence in women with polycystic ovary syndrome. Trends Endocrinol. Metab. 2017;28:186–198. doi: 10.1016/j.tem.2016.11.008. [DOI] [PubMed] [Google Scholar]
- 7.Qiao J., Feng H.L. Extra- and intra-ovarian factors in polycystic ovary syndrome: impact on oocyte maturation and embryo developmental competence. Hum. Reprod. Update. 2011;17:17–33. doi: 10.1093/humupd/dmq032. [DOI] [PMC free article] [PubMed] [Google Scholar]
- 8.Homburg R., Crawford G. The role of AMH in anovulation associated with PCOS: a hypothesis. Hum. Reprod. 2014;29:1117–1121. doi: 10.1093/humrep/deu076. [DOI] [PubMed] [Google Scholar]
- 9.Matsuda F., Inoue N., Manabe N., Ohkura S. Follicular growth and atresia in mammalian ovaries: regulation by survival and death of granulosa cells. J. Reprod. Dev. 2012;58:44–50. doi: 10.1262/jrd.2011-012. [DOI] [PubMed] [Google Scholar]
- 10.Munakata Y., Kawahara-Miki R., Shiratsuki S., Tasaki H., Itami N., Shirasuna K., Kuwayama T., Iwata H. Gene expression patterns in granulosa cells and oocytes at various stages of follicle development as well as in in vitro grown oocyte-and-granulosa cell complexes. J. Reprod. Dev. 2016;62:359–366. doi: 10.1262/jrd.2016-022. [DOI] [PMC free article] [PubMed] [Google Scholar]
- 11.Shi Y., Zhao H., Shi Y., Cao Y., Yang D., Li Z., Zhang B., Liang X., Li T., Chen J. Genome-wide association study identifies eight new risk loci for polycystic ovary syndrome. Nat. Genet. 2012;44:1020–1025. doi: 10.1038/ng.2384. [DOI] [PubMed] [Google Scholar]
- 12.Zhou R., Bird I.M., Dumesic D.A., Abbott D.H. Adrenal hyperandrogenism is induced by fetal androgen excess in a rhesus monkey model of polycystic ovary syndrome. J. Clin. Endocrinol. Metab. 2005;90:6630–6637. doi: 10.1210/jc.2005-0691. [DOI] [PMC free article] [PubMed] [Google Scholar]
- 13.Sagvekar P., Kumar P., Mangoli V., Desai S., Mukherjee S. DNA methylome profiling of granulosa cells reveals altered methylation in genes regulating vital ovarian functions in polycystic ovary syndrome. Clin. Epigenetics. 2019;11:61. doi: 10.1186/s13148-019-0657-6. [DOI] [PMC free article] [PubMed] [Google Scholar]
- 14.Sagvekar P., Mangoli V., Desai S., Patil A., Mukherjee S. LINE1 CpG-DNA hypomethylation in granulosa cells and blood leukocytes is associated with PCOS and related traits. J. Clin. Endocrinol. Metab. 2017;102:1396–1405. doi: 10.1210/jc.2016-2645. [DOI] [PubMed] [Google Scholar]
- 15.Jeltsch A. Beyond Watson and Crick: DNA methylation and molecular enzymology of DNA methyltransferases. ChemBioChem. 2002;3:274–293. doi: 10.1002/1439-7633(20020402)3:4<274::AID-CBIC274>3.0.CO;2-S. [DOI] [PubMed] [Google Scholar]
- 16.Wang P., Zhao H., Li T., Zhang W., Wu K., Li M., Bian Y., Liu H., Ning Y., Li G., Chen Z.J. Hypomethylation of the LH/choriogonadotropin receptor promoter region is a potential mechanism underlying susceptibility to polycystic ovary syndrome. Endocrinology. 2014;155:1445–1452. doi: 10.1210/en.2013-1764. [DOI] [PubMed] [Google Scholar]
- 17.Xia Y., Shen S., Zhang X., Deng Z., Xiang Z., Wang H., Yi L., Gao Q., Wang Y. Epigenetic pattern changes in prenatal female Sprague-Dawley rats following exposure to androgen. Reprod. Fertil. Dev. 2015;28:1414–1423. doi: 10.1071/RD14292. [DOI] [PubMed] [Google Scholar]
- 18.Pan J.X., Tan Y.J., Wang F.F., Hou N.N., Xiang Y.Q., Zhang J.Y., Liu Y., Qu F., Meng Q., Xu J. Aberrant expression and DNA methylation of lipid metabolism genes in PCOS: a new insight into its pathogenesis. Clin. Epigenetics. 2018;10:6. doi: 10.1186/s13148-018-0442-y. [DOI] [PMC free article] [PubMed] [Google Scholar]
- 19.Quinn J.J., Chang H.Y. Unique features of long non-coding RNA biogenesis and function. Nat. Rev. Genet. 2016;17:47–62. doi: 10.1038/nrg.2015.10. [DOI] [PubMed] [Google Scholar]
- 20.Salviano-Silva A., Lobo-Alves S.C., Almeida R.C., Malheiros D., Petzl-Erler M.L. Besides pathology: long non-coding RNA in cell and tissue homeostasis. Noncoding RNA. 2018;4:3. doi: 10.3390/ncrna4010003. [DOI] [PMC free article] [PubMed] [Google Scholar]
- 21.Jin L., Yang Q., Zhou C., Liu L., Wang H., Hou M., Wu Y., Shi F., Sheng J., Huang H. Profiles for long non-coding RNAs in ovarian granulosa cells from women with PCOS with or without hyperandrogenism. Reprod. Biomed. Online. 2018;37:613–623. doi: 10.1016/j.rbmo.2018.08.005. [DOI] [PubMed] [Google Scholar]
- 22.Zhao J., Huang J., Geng X., Chu W., Li S., Chen Z.J., Du Y. Polycystic ovary syndrome: novel and hub lncRNAs in the insulin resistance-associated lncRNA-mRNA network. Front. Genet. 2019;10:772. doi: 10.3389/fgene.2019.00772. [DOI] [PMC free article] [PubMed] [Google Scholar]
- 23.Butler A.E., Hayat S., Dargham S.R., Malek J.A., Abdulla S.A., Mohamoud Y.A., Suhre K., Sathyapalan T., Atkin S.L. Alterations in long noncoding RNAs in women with and without polycystic ovarian syndrome. Clin. Endocrinol. (Oxf.) 2019;91:793–797. doi: 10.1111/cen.14087. [DOI] [PubMed] [Google Scholar]
- 24.Liu Y.D., Li Y., Feng S.X., Ye D.S., Chen X., Zhou X.Y., Chen S.L. Long Noncoding RNAs: potential regulators involved in the pathogenesis of polycystic ovary syndrome. Endocrinology. 2017;158:3890–3899. doi: 10.1210/en.2017-00605. [DOI] [PubMed] [Google Scholar]
- 25.Huang X., Hao C., Bao H., Wang M., Dai H. Aberrant expression of long noncoding RNAs in cumulus cells isolated from PCOS patients. J. Assist. Reprod. Genet. 2016;33:111–121. doi: 10.1007/s10815-015-0630-z. [DOI] [PMC free article] [PubMed] [Google Scholar]
- 26.Li Y., Wang H., Zhou D., Shuang T., Zhao H., Chen B. Up-regulation of long noncoding RNA SRA promotes cell growth, inhibits cell apoptosis, and induces secretion of estradiol and progesterone in ovarian granular cells of mice. Med. Sci. Monit. 2018;24:2384–2390. doi: 10.12659/MSM.907138. [DOI] [PMC free article] [PubMed] [Google Scholar]
- 27.Zhao J., Xu J., Wang W., Zhao H., Liu H., Liu X., Liu J., Sun Y., Dunaif A., Du Y., Chen Z.J. Long non-coding RNA LINC-01572:28 inhibits granulosa cell growth via a decrease in p27 (Kip1) degradation in patients with polycystic ovary syndrome. EBioMedicine. 2018;36:526–538. doi: 10.1016/j.ebiom.2018.09.043. [DOI] [PMC free article] [PubMed] [Google Scholar]
- 28.Di Ruscio A., Ebralidze A.K., Benoukraf T., Amabile G., Goff L.A., Terragni J., Figueroa M.E., De Figueiredo Pontes L.L., Alberich-Jorda M., Zhang P. DNMT1-interacting RNAs block gene-specific DNA methylation. Nature. 2013;503:371–376. doi: 10.1038/nature12598. [DOI] [PMC free article] [PubMed] [Google Scholar]
- 29.Bao X., Wu H., Zhu X., Guo X., Hutchins A.P., Luo Z., Song H., Chen Y., Lai K., Yin M. The p53-induced lincRNA-p21 derails somatic cell reprogramming by sustaining H3K9me3 and CpG methylation at pluripotency gene promoters. Cell Res. 2015;25:80–92. doi: 10.1038/cr.2014.165. [DOI] [PMC free article] [PubMed] [Google Scholar]
- 30.Zhang H., Gao Q., Tan S., You J., Lyu C., Zhang Y., Han M., Chen Z., Li J., Wang H. SET8 prevents excessive DNA methylation by methylation-mediated degradation of UHRF1 and DNMT1. Nucleic Acids Res. 2019;47:9053–9068. doi: 10.1093/nar/gkz626. [DOI] [PMC free article] [PubMed] [Google Scholar]
- 31.Jackson-Grusby L., Beard C., Possemato R., Tudor M., Fambrough D., Csankovszki G., Dausman J., Lee P., Wilson C., Lander E., Jaenisch R. Loss of genomic methylation causes p53-dependent apoptosis and epigenetic deregulation. Nat. Genet. 2001;27:31–39. doi: 10.1038/83730. [DOI] [PubMed] [Google Scholar]
- 32.Sen G.L., Reuter J.A., Webster D.E., Zhu L., Khavari P.A. DNMT1 maintains progenitor function in self-renewing somatic tissue. Nature. 2010;463:563–567. doi: 10.1038/nature08683. [DOI] [PMC free article] [PubMed] [Google Scholar]
- 33.Li T., Wang L., Du Y., Xie S., Yang X., Lian F., Zhou Z., Qian C. Structural and mechanistic insights into UHRF1-mediated DNMT1 activation in the maintenance DNA methylation. Nucleic Acids Res. 2018;46:3218–3231. doi: 10.1093/nar/gky104. [DOI] [PMC free article] [PubMed] [Google Scholar]
- 34.Chuang L.S., Ian H.I., Koh T.W., Ng H.H., Xu G., Li B.F. Human DNA-(cytosine-5) methyltransferase-PCNA complex as a target for p21WAF1. Science. 1997;277:1996–2000. doi: 10.1126/science.277.5334.1996. [DOI] [PubMed] [Google Scholar]
- 35.Christman J.K. 5-Azacytidine and 5-aza-2′-deoxycytidine as inhibitors of DNA methylation: mechanistic studies and their implications for cancer therapy. Oncogene. 2002;21:5483–5495. doi: 10.1038/sj.onc.1205699. [DOI] [PubMed] [Google Scholar]
- 36.Li W., Huang K., Wen F., Cui G., Guo H., He Z., Zhao S. LINC00184 silencing inhibits glycolysis and restores mitochondrial oxidative phosphorylation in esophageal cancer through demethylation of PTEN. EBioMedicine. 2019;44:298–310. doi: 10.1016/j.ebiom.2019.05.055. [DOI] [PMC free article] [PubMed] [Google Scholar] [Retracted]
- 37.Du Z., Song J., Wang Y., Zhao Y., Guda K., Yang S., Kao H.Y., Xu Y., Willis J., Markowitz S.D. DNMT1 stability is regulated by proteins coordinating deubiquitination and acetylation-driven ubiquitination. Sci. Signal. 2010;3:ra80. doi: 10.1126/scisignal.2001462. [DOI] [PMC free article] [PubMed] [Google Scholar]
- 38.Cech T.R., Steitz J.A. The noncoding RNA revolution-trashing old rules to forge new ones. Cell. 2014;157:77–94. doi: 10.1016/j.cell.2014.03.008. [DOI] [PubMed] [Google Scholar]
- 39.Zhou J., Yang L., Zhong T., Mueller M., Men Y., Zhang N., Xie J., Giang K., Chung H., Sun X. H19 lncRNA alters DNA methylation genome wide by regulating S-adenosylhomocysteine hydrolase. Nat. Commun. 2015;6:10221. doi: 10.1038/ncomms10221. [DOI] [PMC free article] [PubMed] [Google Scholar]
- 40.Ma P., de Waal E., Weaver J.R., Bartolomei M.S., Schultz R.M. A DNMT3A2-HDAC2 complex is essential for genomic imprinting and genome integrity in mouse oocytes. Cell Rep. 2015;13:1552–1560. doi: 10.1016/j.celrep.2015.10.031. [DOI] [PMC free article] [PubMed] [Google Scholar]
- 41.Holliday R., Pugh J.E. DNA modification mechanisms and gene activity during development. Science. 1975;187:226–232. [PubMed] [Google Scholar]
- 42.Bansal A., Pinney S.E. DNA methylation and its role in the pathogenesis of diabetes. Pediatr. Diabetes. 2017;18:167–177. doi: 10.1111/pedi.12521. [DOI] [PMC free article] [PubMed] [Google Scholar]
- 43.Bestor T.H. The DNA methyltransferases of mammals. Hum. Mol. Genet. 2000;9:2395–2402. doi: 10.1093/hmg/9.16.2395. [DOI] [PubMed] [Google Scholar]
- 44.Rhee I., Bachman K.E., Park B.H., Jair K.W., Yen R.W., Schuebel K.E., Cui H., Feinberg A.P., Lengauer C., Kinzler K.W. DNMT1 and DNMT3b cooperate to silence genes in human cancer cells. Nature. 2002;416:552–556. doi: 10.1038/416552a. [DOI] [PubMed] [Google Scholar]
- 45.Egger G., Jeong S., Escobar S.G., Cortez C.C., Li T.W.H., Saito Y., Yoo C.B., Jones P.A., Liang G. Identification of DNMT1 (DNA methyltransferase 1) hypomorphs in somatic knockouts suggests an essential role for DNMT1 in cell survival. Proc. Natl. Acad. Sci. USA. 2006;103:14080–14085. doi: 10.1073/pnas.0604602103. [DOI] [PMC free article] [PubMed] [Google Scholar]
- 46.Luo Y., Xie C., Brocker C.N., Fan J., Wu X., Feng L., Wang Q., Zhao J., Lu D., Tandon M. Intestinal PPARα protects against colon carcinogenesis via regulation of methyltransferases DNMT1 and PRMT6. Gastroenterology. 2019;157:744–759.e4. doi: 10.1053/j.gastro.2019.05.057. [DOI] [PMC free article] [PubMed] [Google Scholar]
- 47.Scaramuzzi R.J., Baird D.T., Campbell B.K., Driancourt M.A., Dupont J., Fortune J.E., Gilchrist R.B., Martin G.B., McNatty K.P., McNeilly A.S. Regulation of folliculogenesis and the determination of ovulation rate in ruminants. Reprod. Fertil. Dev. 2011;23:444–467. doi: 10.1071/RD09161. [DOI] [PubMed] [Google Scholar]
- 48.Shimizu T., Hirai Y., Miyamoto A. Expression of cyclins and cyclin-dependent kinase inhibitors in granulosa cells from bovine ovary. Reprod. Domest. Anim. 2013;48:e65–e69. doi: 10.1111/rda.12177. [DOI] [PubMed] [Google Scholar]
- 49.Wissing M.L., Kristensen S.G., Andersen C.Y., Mikkelsen A.L., Høst T., Borup R., Grøndahl M.L. Identification of new ovulation-related genes in humans by comparing the transcriptome of granulosa cells before and after ovulation triggering in the same controlled ovarian stimulation cycle. Hum. Reprod. 2014;29:997–1010. doi: 10.1093/humrep/deu008. [DOI] [PubMed] [Google Scholar]
- 50.Erickson G.F., Magoffin D.A., Garzo V.G., Cheung A.P., Chang R.J. Granulosa cells of polycystic ovaries: are they normal or abnormal? Hum. Reprod. 1992;7:293–299. doi: 10.1093/oxfordjournals.humrep.a137638. [DOI] [PubMed] [Google Scholar]
- 51.Escobar-Morreale H.F. Polycystic ovary syndrome: definition, aetiology, diagnosis and treatment. Nat. Rev. Endocrinol. 2018;14:270–284. doi: 10.1038/nrendo.2018.24. [DOI] [PubMed] [Google Scholar]
- 52.Wu Y., Zhang Z., Liao X., Wang Z. High fat diet triggers cell cycle arrest and excessive apoptosis of granulosa cells during the follicular development. Biochem. Biophys. Res. Commun. 2015;466:599–605. doi: 10.1016/j.bbrc.2015.09.096. [DOI] [PubMed] [Google Scholar]
- 53.He T., Sun Y., Zhang Y., Zhao S., Zheng Y., Hao G., Shi Y. MicroRNA-200b and microRNA-200c are up-regulated in PCOS granulosa cell and inhibit KGN cell proliferation via targeting PTEN. Reprod. Biol. Endocrinol. 2019;17:68. doi: 10.1186/s12958-019-0505-8. [DOI] [PMC free article] [PubMed] [Google Scholar]
- 54.Han X., Tian P., Zhang J. MicroRNA-486-5p inhibits ovarian granulosa cell proliferation and participates in the development of PCOS via targeting MST4. Eur. Rev. Med. Pharmacol. Sci. 2019;23:7217–7223. doi: 10.26355/eurrev_201909_18823. [DOI] [PubMed] [Google Scholar]
- 55.Jiang L., Huang J., Li L., Chen Y., Chen X., Zhao X., Yang D. MicroRNA-93 promotes ovarian granulosa cells proliferation through targeting CDKN1A in polycystic ovarian syndrome. J. Clin. Endocrinol. Metab. 2015;100:E729–E738. doi: 10.1210/jc.2014-3827. [DOI] [PMC free article] [PubMed] [Google Scholar]
- 56.Zhong Z., Li F., Li Y., Qin S., Wen C., Fu Y., Xiao Q. Inhibition of microRNA-19b promotes ovarian granulosa cell proliferation by targeting IGF-1 in polycystic ovary syndrome. Mol. Med. Rep. 2018;17:4889–4898. doi: 10.3892/mmr.2018.8463. [DOI] [PMC free article] [PubMed] [Google Scholar] [Retracted]
- 57.Donderwinkel P.F., Schoot D.C., Pache T.D., de Jong F.H., Hop W.C., Fauser B.C. Luteal function following ovulation induction in polycystic ovary syndrome patients using exogenous gonadotrophins in combination with a gonadotrophin-releasing hormone agonist. Hum. Reprod. 1993;8:2027–2032. doi: 10.1093/oxfordjournals.humrep.a137976. [DOI] [PubMed] [Google Scholar]
- 58.Nishi Y., Yanase T., Mu Y., Oba K., Ichino I., Saito M., Nomura M., Mukasa C., Okabe T., Goto K. Establishment and characterization of a steroidogenic human granulosa-like tumor cell line, KGN, that expresses functional follicle-stimulating hormone receptor. Endocrinology. 2001;142:437–445. doi: 10.1210/endo.142.1.7862. [DOI] [PubMed] [Google Scholar]
- 59.Murphy B.D. Models of luteinization. Biol. Reprod. 2000;63:2–11. doi: 10.1095/biolreprod63.1.2. [DOI] [PubMed] [Google Scholar]
- 60.Yoshioka S., Abe H., Sakumoto R., Okuda K. Proliferation of luteal steroidogenic cells in cattle. PLoS ONE. 2013;8:e84186. doi: 10.1371/journal.pone.0084186. [DOI] [PMC free article] [PubMed] [Google Scholar]
- 61.Gu C., Liu S., Wu Q., Zhang L., Guo F. Integrative single-cell analysis of transcriptome, DNA methylome and chromatin accessibility in mouse oocytes. Cell Res. 2019;29:110–123. doi: 10.1038/s41422-018-0125-4. [DOI] [PMC free article] [PubMed] [Google Scholar]
- 62.Pauwels S., Ghosh M., Duca R.C., Bekaert B., Freson K., Huybrechts I., Langie S.A.S., Koppen G., Devlieger R., Godderis L. Maternal intake of methyl-group donors affects DNA methylation of metabolic genes in infants. Clin. Epigenetics. 2017;9:16. doi: 10.1186/s13148-017-0321-y. [DOI] [PMC free article] [PubMed] [Google Scholar]
- 63.Cordero P., Gomez-Uriz A.M., Campion J., Milagro F.I., Martinez J.A. Dietary supplementation with methyl donors reduces fatty liver and modifies the fatty acid synthase DNA methylation profile in rats fed an obesogenic diet. Genes Nutr. 2013;8:105–113. doi: 10.1007/s12263-012-0300-z. [DOI] [PMC free article] [PubMed] [Google Scholar]
- 64.Waterland R.A., Travisano M., Tahiliani K.G., Rached M.T., Mirza S. Methyl donor supplementation prevents transgenerational amplification of obesity. Int. J. Obes. (Lond.) 2008;32:1373–1379. doi: 10.1038/ijo.2008.100. [DOI] [PMC free article] [PubMed] [Google Scholar]
- 65.Nilsson E., Matte A., Perfilyev A., de Mello V.D., Käkelä P., Pihlajamäki J., Ling C. Epigenetic alterations in human liver from subjects with type 2 diabetes in parallel with reduced folate levels. J. Clin. Endocrinol. Metab. 2015;100:E1491–E1501. doi: 10.1210/jc.2015-3204. [DOI] [PMC free article] [PubMed] [Google Scholar]
- 66.Li W., Tang R., Ma F., Ouyang S., Liu Z., Wu J. Folic acid supplementation alters the DNA methylation profile and improves insulin resistance in high-fat-diet-fed mice. J. Nutr. Biochem. 2018;59:76–83. doi: 10.1016/j.jnutbio.2018.05.010. [DOI] [PubMed] [Google Scholar]
- 67.Niculescu M.D., Yamamuro Y., Zeisel S.H. Choline availability modulates human neuroblastoma cell proliferation and alters the methylation of the promoter region of the cyclin-dependent kinase inhibitor 3 gene. J. Neurochem. 2004;89:1252–1259. doi: 10.1111/j.1471-4159.2004.02414.x. [DOI] [PMC free article] [PubMed] [Google Scholar]
- 68.Chavarro J.E., Rich-Edwards J.W., Rosner B.A., Willett W.C. Use of multivitamins, intake of B vitamins, and risk of ovulatory infertility. Fertil. Steril. 2008;89:668–676. doi: 10.1016/j.fertnstert.2007.03.089. [DOI] [PMC free article] [PubMed] [Google Scholar]
- 69.Rahimi S., Martel J., Karahan G., Angle C., Behan N.A., Chan D., MacFarlane A.J., Trasler J.M. Moderate maternal folic acid supplementation ameliorates adverse embryonic and epigenetic outcomes associated with assisted reproduction in a mouse model. Hum. Reprod. 2019;34:851–862. doi: 10.1093/humrep/dez036. [DOI] [PMC free article] [PubMed] [Google Scholar]
- 70.Zhu Q., Zuo R., He Y., Wang Y., Chen Z.J., Sun Y., Sun K. Local regeneration of cortisol by 11β-HSD1 contributes to insulin resistance of the granulosa cells in PCOS. J. Clin. Endocrinol. Metab. 2016;101:2168–2177. doi: 10.1210/jc.2015-3899. [DOI] [PubMed] [Google Scholar]
- 71.McDonnell F., Irnaten M., Clark A.F., O’Brien C.J., Wallace D.M. Hypoxia-induced changes in DNA methylation alter RASAL1 and TGFβ1 expression in human trabecular meshwork cells. PLoS ONE. 2016;11:e153354. doi: 10.1371/journal.pone.0153354. [DOI] [PMC free article] [PubMed] [Google Scholar]
- 72.Yoon J.H., You B.H., Park C.H., Kim Y.J., Nam J.W., Lee S.K. The long noncoding RNA LUCAT1 promotes tumorigenesis by controlling ubiquitination and stability of DNA methyltransferase 1 in esophageal squamous cell carcinoma. Cancer Lett. 2018;417:47–57. doi: 10.1016/j.canlet.2017.12.016. [DOI] [PubMed] [Google Scholar]
- 73.Ding G., Chen P., Zhang H., Huang X., Zang Y., Li J., Li J., Wong J. Regulation of ubiquitin-like with plant homeodomain and RING finger domain 1 (UHRF1) protein stability by heat shock protein 90 chaperone machinery. J. Biol. Chem. 2016;291:20125–20135. doi: 10.1074/jbc.M116.727214. [DOI] [PMC free article] [PubMed] [Google Scholar]
Associated Data
This section collects any data citations, data availability statements, or supplementary materials included in this article.