Abstract
Background
Mitochondrial DNA (MT-DNA) are intrinsically inflammatory nucleic acids released by damaged solid organs. Whether circulating cell-free MT-DNA quantitation could be used to predict the risk of poor COVID-19 outcomes remains undetermined.
Methods
We measured circulating MT-DNA levels in prospectively collected, cell-free plasma samples from 97 subjects with COVID-19 at hospital presentation. Our primary outcome was mortality. Intensive care unit (ICU) admission, intubation, vasopressor, and renal replacement therapy requirements were secondary outcomes. Multivariate regression analysis determined whether MT-DNA levels were independent of other reported COVID-19 risk factors. Receiver operating characteristic and area under the curve assessments were used to compare MT-DNA levels with established and emerging inflammatory markers of COVID-19.
Results
Circulating MT-DNA levels were highly elevated in patients who eventually died or required ICU admission, intubation, vasopressor use, or renal replacement therapy. Multivariate regression revealed that high circulating MT-DNA was an independent risk factor for these outcomes after adjusting for age, sex, and comorbidities. We also found that circulating MT-DNA levels had a similar or superior area under the curve when compared against clinically established measures of inflammation and emerging markers currently of interest as investigational targets for COVID-19 therapy.
Conclusion
These results show that high circulating MT-DNA levels are a potential early indicator for poor COVID-19 outcomes.
Funding
Washington University Institute of Clinical Translational Sciences COVID-19 Research Program and Washington University Institute of Clinical Translational Sciences (ICTS) NIH grant UL1TR002345.
Keywords: COVID-19, Immunology
Keywords: Complement, Mitochondria
Introduction
Coronavirus disease 2019 (COVID-19) is a respiratory tract infection caused by severe acute respiratory syndrome coronavirus 2 (SARS-CoV-2) that has resulted in a global health emergency, causing considerable strain on economic, social, and medical systems (1). COVID-19 presents in a wide spectrum of severity. Although most patients develop only mild or uncomplicated illness, others require prolonged hospitalization, ICU care, and intubation for respiratory support. In severe cases, patients can develop acute respiratory distress syndrome (ARDS), cytokine storm, multiorgan failure, and death (1). Although the underlying mechanisms of severe COVID-19 illness remain unclear, it appears to be exacerbated by an overexuberant innate immune response (2). These observations have led to several ongoing clinical trials targeting components of the innate immune response, such as inflammatory cytokine signaling and complement activation (3–5).
Previous work has established that viral infection can trigger cellular necrosis, which in turn inhibits viral replication along with amplifying antiviral immune responses through the release of damage-associated molecular patterns (DAMPs) (6). DAMPs in particular are potent triggers of innate responses through their engagement of pattern recognition receptors, such as Toll-like receptors (TLRs), that drive the expression of inflammatory cytokines and presentation of viral antigens (7). Mitochondrial DNA (MT-DNA) is a member of a group of mitochondrial DAMPs (MT-DAMPs) released by injured or dying cells and is recognized by TLR9 because of encoded hypomethylated CpG motifs reminiscent of an ancestral bacterial origin (8). MT-DNA levels have been previously shown to be elevated in the plasma of patients who develop ARDS and multiorgan dysfunction during sepsis, as well as during sterile injury, including trauma, hemorrhagic shock, and ischemia/reperfusion (9–14). The release of MT-DNA is often accompanied by the release of other MT-DAMPs, such as N-formylated peptides, cytochrome c, and cardiolipin, which collectively engage multiple TLRs and the N-formylated peptide receptor-1 that in turn induce not only inflammatory cytokine expression (15–17) but also the generation of reactive oxygen species and the facilitation of neutrophil trafficking and activation (14, 18, 19). Through these effects, MT-DAMPs can directly contribute to acute lung injury and systemic inflammation (8). Given that ARDS secondary to SARS-CoV-2 infection is also linked with lung tissue injury and immune cell activation (20), we asked if elevated levels of circulating MT-DNA could be used as a risk indicator for the development of severe illness.
Here, we demonstrate that COVID-19 patients with high circulating levels of cell-free MT-DNA at the time of hospital presentation are more likely to require intensive care unit (ICU) care and intubation and are at heightened risk of death. In addition, MT-DNA quantitation as predictor of poor COVID-19 outcomes is comparable to or better than inflammation indicators commonly used in current clinical practice, as well as certain emerging immune markers.
Results
Participants.
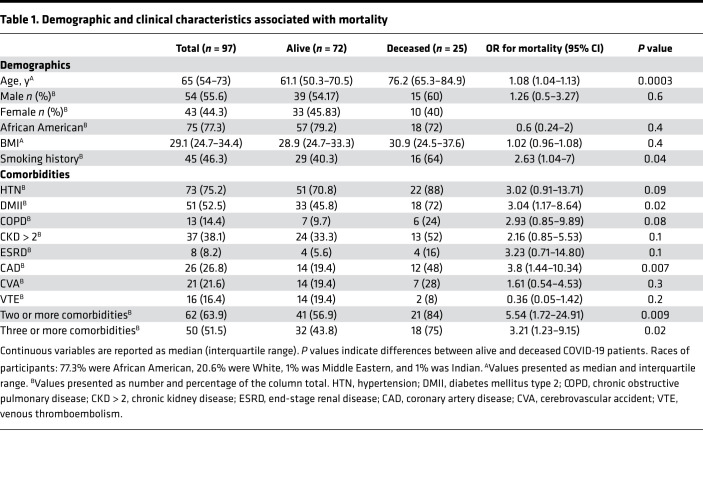
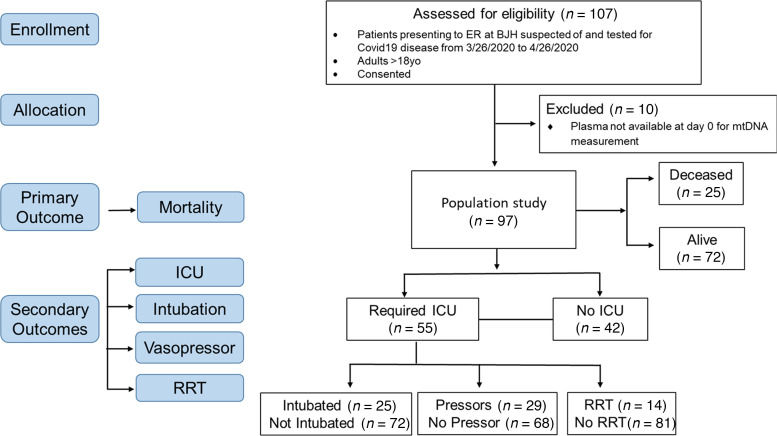
A total of 107 subjects were assessed for eligibility from March 26, 2020, to April 26, 2020. Of these, 97 adult subjects with laboratory-confirmed COVID-19 were included in our study (Table 1 and Figure 1). Ten subjects were excluded because they did not have samples from the day of presentation. The median age of the population in our study was 65 (interquartile range 54–73). Among these subjects, 55.7% (54/97) were male and 44.3% (43/97) were female; 77.3% (75/97) were African American, 20.6% (20/97) were White, 1% (1/97) was Middle Eastern, and 1% (1/97) was Indian; and 46.4% (45/97) were obese (BMI ≥ 30), while 49.5% (48/97) were nonobese (BMI 18.5–29.9) and 4.1% (4/97) were underweight (BMI < 18.5). A positive smoking history was reported in 46.4% (45/97) of subjects. The median follow-up time was 81 days (interquartile range 74–87).
Table 1. Demographic and clinical characteristics associated with mortality.
Figure 1. CONSORT flow diagram showing enrollment of patients, allocation, and outcomes.
RRT, renal replacement therapy.
Comorbidities and outcomes.
The primary outcome of mortality was observed in 25.8% (25/97) of subjects in our study (Table 1). Those who died were older [76.2 versus 61.1 years, OR 1.08 (1.04–1.13), P = 0.0003], were more likely to be smokers [64% versus 40.3%, OR 2.63 (1.04–7.00), P = 0.04], and were more likely to have type 2 diabetes mellitus [72% versus 45.8%, OR 3.04 (1.17–8.64), P = 0.02], coronary artery disease [48% versus 19.4%, OR 3.8 (1.44–10.34), P = 0.007], and 2 or more comorbidities [84% versus 56.9%, OR 5.54 (1.72–24.91, P = 0.009] on univariate analysis (Table 1). The time to discharge for subjects who survived was mean 12.4 days, median 7 days (interquartile range 3–18), and range 1–56.
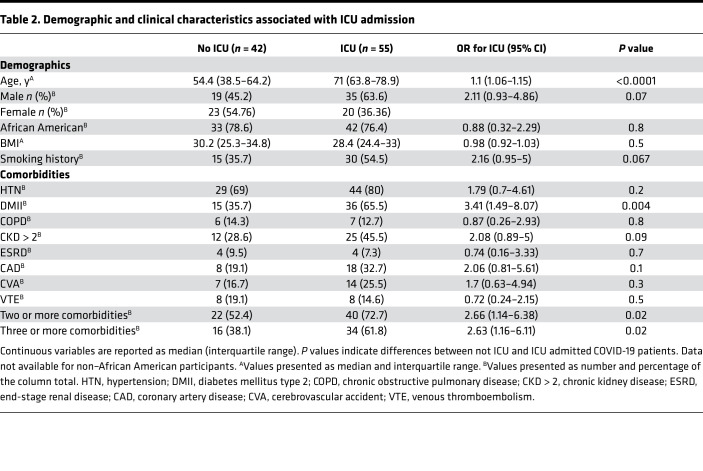
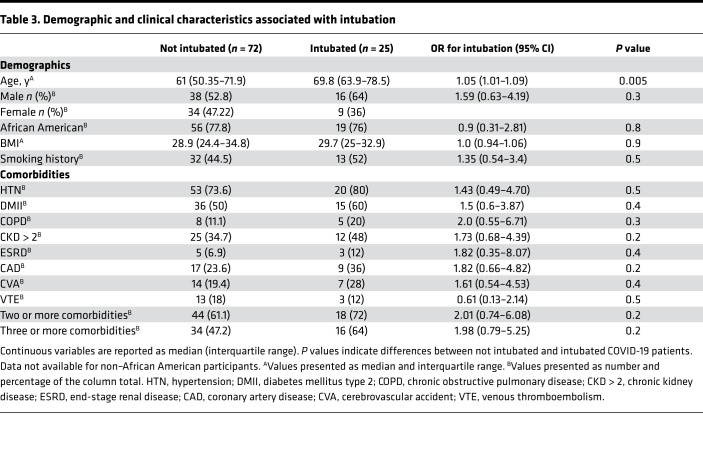
Of the subjects with COVID-19, 56.7% (55/97, Table 2) required an ICU admission. These subjects were older [71 versus 54.4, OR 1.1 (1.06–1.15), P < 0.0001] and were more likely to have type 2 diabetes mellitus [65.5% versus 35.7%, OR 3.41 (1.49–8.07), P = 0.004] and 2 or more comorbidities [72.7% versus 52.4%, OR 2.66 (1.14–6.38), P = 0.02]. As expected, the time to discharge was higher for patients requiring ICU admission [15 days (interquartile range 5–28), n = 27; versus 5 days (interquartile range 3–12.5), n = 36, P = 0.0012]. Among patients, 25.8% (25/97) required invasive mechanical ventilation as a treatment for acute respiratory failure. The main clinical characteristic associated with higher risk for intubation was age, with a median of 70 years for intubated subjects compared with 61 years for nonintubated subjects [OR 1.05 (1.01–1.09), P = 0.005] on univariate analysis (Table 3). As expected, the time to discharge was higher for patients who required intubation [27.5 days (interquartile range 18.5–38.5), n = 12; versus 5 days (interquartile range 3–13), n = 51, P < 0.0001].
Table 2. Demographic and clinical characteristics associated with ICU admission.
Table 3. Demographic and clinical characteristics associated with intubation.
COVID-19 patients with high circulating MT-DNA are at higher risk for mortality.
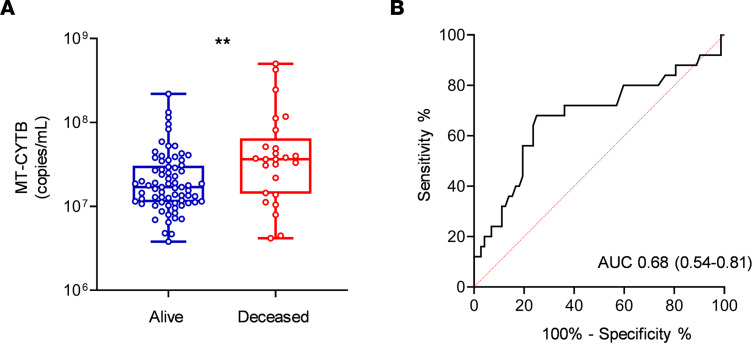
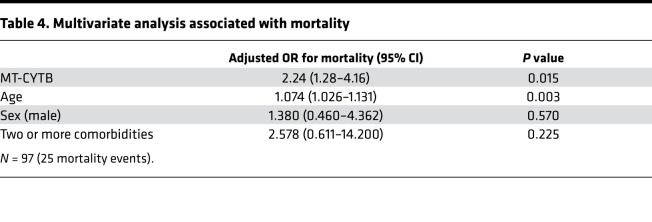
To assess MT-DNA levels in COVID-19 patients, we utilized a previously established in situ quantitative PCR method (14) to measure the accumulation of fragments derived from the mitochondrial encoded gene cytochrome b (MT-CYTB) within cell-free circulating plasma. Plasma MT-CYTB levels were elevated in those subjects who died from COVID-19 [7.56 (7.15–7.81, n = 25)] compared with those who survived [7.23 (7.050–7.485), n = 72, P = 0.008, Figure 2A] and were associated with an increased risk for mortality on univariate logistic regression (OR 2.24, 95% CI 1.29–4.16, P = 0.006). For MT-CYTB, area under the curve (AUC) for mortality was 0.68 (95% CI 0.54–0.81, Figure 2B). On multivariable logistic regression, plasma MT-CYTB levels remained an independent risk factor for mortality when adjusted for age, sex, and 2 or more comorbidities (ORadj, 2.19, 95% CI 1.19–4.28, P = 0.015, Table 4). Levels of mitochondrial cytochrome c oxidase III (MT-COX3), another MT-DNA–encoded gene (Supplemental Figure 1B; supplemental material available online with this article; https://doi.org/10.1172/jci.insight.143299DS1), revealed an increased trend in subjects who died [5.63 (5.00–6.46), n = 25] relative to those who survived [5.32 (4.90–5.83), n = 72] but did not reach statistical significance (P = 0.1).
Figure 2. High circulating MT-DNA levels predict a higher risk of mortality in COVID-19 patients.
Plasma for determination of circulating levels of MT-CYTB was obtained at time of hospital presentation. (A) Box-and-whisker plots of MT-CYB levels in relation to mortality status in COVID-19 patients. The box plots depict the minimum and maximum values (whiskers), the upper and lower quartiles, and the median. The length of the box represents the interquartile range. (B) Receiver operating characteristic (ROC) curves in predicting the outcome mortality based on MT-CYTB levels. Statistical significance was determined using Mann-Whitney U test (**P < 0.01).
Table 4. Multivariate analysis associated with mortality.
COVID-19 patients with high circulating MT-DNA are more likely to require ICU admission and intubation.
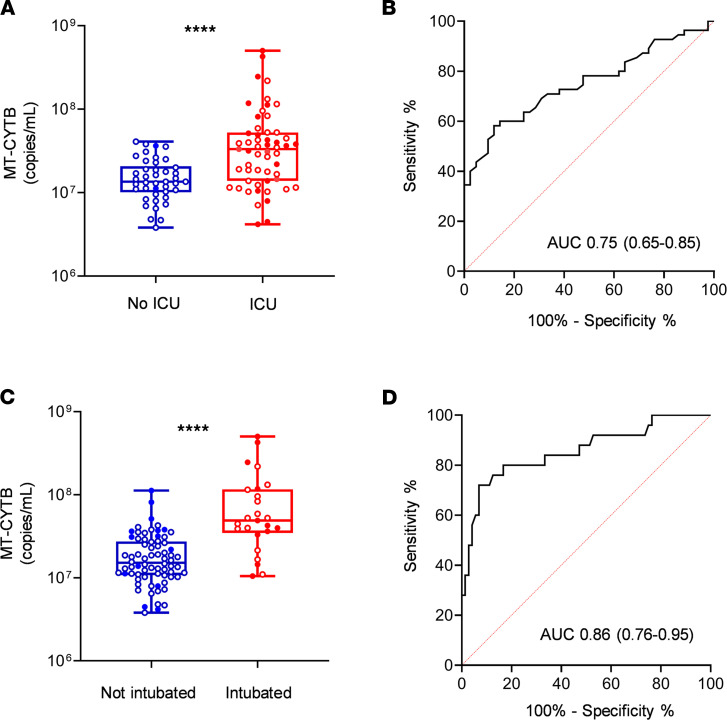
Plasma MT-CYTB levels were elevated in those subjects with COVID-19 who required an ICU admission [7.52 (7.14–7.72), n = 55] compared with those who were not admitted to the ICU [7.13 (7.00–7.31), P < 0.0001, n = 42, Figure 3A]. MT-CYTB levels were associated with ICU admission on univariate logistic regression (OR 4.25, 95% CI 2.15–9.59, P = 0.0001). For MT-CYTB, AUC for ICU admission was 0.75 (95% CI 0.65–0.85, Figure 3B). On multivariable logistic regression, plasma MT-CYTB levels remained an independent risk factor for ICU admission after adjusting for age, sex, and 2 or more comorbidities (ORadj, 3.97, 95% CI 1.83–10.34, P = 0.002, Table 5). Notably, we also made similar findings for MT-COX3 [Supplemental Figure 1C; ORadj for age, sex, and 2 or more comorbidities, 1.47; 95% CI 1.14–1.95; P = 0.005; AUC of COX3 for ICU admission 0.69 (95% CI 0.58–0.79)].
Figure 3. High circulating MT-DNA levels predict a higher risk of ICU requirement and intubation in COVID-19 patients.
Plasma for determination of circulating levels of MT-CYTB was obtained at time of hospital presentation. Box-and-whisker plots of MT-CYB levels in relation to (A) ICU admission and (C) intubation in COVID-19 patients. The box plots depict the minimum and maximum values (whiskers), the upper and lower quartiles, and the median. The length of the box represents the interquartile range. Empty dots indicate alive patients and shaded dots indicate deceased patients. ROC curves in predicting the outcome (B) ICU and (D) intubation based on MT-CYTB levels. Statistical significance was determined using Mann-Whitney U test (****P <.0001).
Table 5. Multivariate analysis associated with ICU admission.
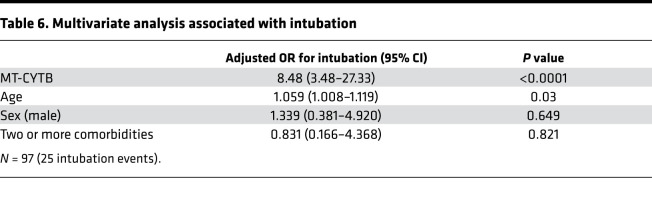
Additionally, plasma MT-CYTB levels were elevated in those subjects with COVID-19 who required intubation [7.69 (7.54–8.07, n = 25)] versus those who did not require intubation [7.18 (7.033–7.438), n = 72, P < 0.0001, Figure 3C]. Plasma MT-CYTB levels were associated with intubation on univariate logistic regression (OR 9.12, 95% 3.77–28.56, P < 0.0001). For MT-CYTB, AUC for intubation was 0.86 (95% CI 0.76–0.95, Figure 3D). On multivariable logistic regression, plasma MT-CYTB levels remained an independent risk factor for intubation (ORadj, 8.47, 95% CI 3.49–27.33, P < 0.0001, Table 6). Similar findings were observed with MT-COX3 [Supplemental Figure 1D; ORadj for age, sex, and 2 or more comorbidities, 2.69; 95% CI 1.77–4.74; P < 0.0001; AUC for intubation 0.80 (95% CI 0.69–0.91)].
Table 6. Multivariate analysis associated with intubation.
COVID-19 patients with high circulating MT-DNA are more likely to require vasopressors and renal replacement therapy.
Plasma MT-CYTB levels were also elevated in those subjects with COVID-19 who ultimately had end organ dysfunction requiring vasopressors [7.63 (7.35–8.02), n = 29] compared with those who did not require vasopressors [7.20 (7.04–7.43), P < 0.0001, n = 68, Figure 4A]. For MT-CYTB, AUC for vasopressor requirement was 0.80 (95% CI 0.69–0.91, Figure 4B). Similarly, plasma MT-COX3 levels were elevated in subjects requiring vasopressors [5.98 (5.25–6.68), n = 29; compared with 5.25 (4.85–5.70), P = 0.0001, n = 68 (Supplemental Figure 1E); AUC of COX3 for vasopressor requirement was 0.74 (95% CI 0.62–0.86)]. Notably, plasma MT-CYTB levels on admission were also elevated in subjects who had end organ dysfunction requiring RRT while in the ICU [7.75 (7.64–8.08), n = 14] compared with those who did not require RRT [7.2 (7.04–7.47), P < 0.0001, n = 81, Figure 4C]. For MT-CYTB, AUC for RRT requirement was 0.95 (95% CI 0.91–0.99, Figure 4D). Similarly, plasma MT-COX3 levels were elevated in subjects who required RRT [6.59 (6.36–7.12), n = 14] compared with those who did not require RRT [5.24 (4.81–5.69), P < 0.0001, n = 81] (Supplemental Figure 1F); AUC of COX3 for RRT requirement was 0.94 (95% CI 0.88–0.99)].
Figure 4. High circulating MT-DNA levels predict a higher risk for end organ dysfunction requiring vasopressors and renal replacement in COVID-19 patients.
Plasma for determination of circulating levels of MT-CYTB was obtained at time of hospital presentation. Box-and-whisker plots of MT-CYB levels in relation to (A) requirement for vasopressors and (C) renal replacement in COVID-19 patients. The box plots depict the minimum and maximum values (whiskers), the upper and lower quartiles, and the median. The length of the box represents the interquartile range. ROC curves in predicting the outcomes (B) requirement for pressors and (D) renal replacement based on MT-CYTB levels. Statistical significance was determined using Mann-Whitney U test (****P < 0.0001).
Circulating MT-DNA levels show similar or improved sensitivity over clinically established measurements of inflammation used in COVID-19 patients.
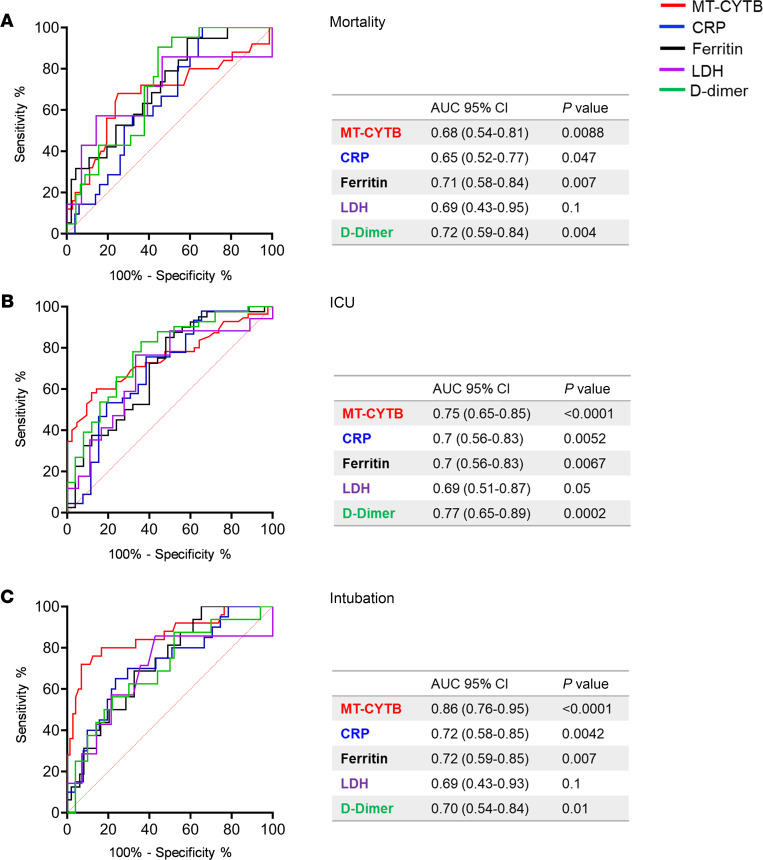
Plasma MT-CYTB levels had a similar AUC for mortality when compared with lactic acid dehydrogenase (LDH), ferritin, or D-dimer levels and were better than C-reactive protein (CRP) drawn within the first 24 hours of presentation (Figure 5A). Importantly, the AUC for plasma MT-CYTB levels was superior to CRP, LDH, ferritin, and D-dimer levels when predicting the need for an ICU admission (Figure 5B) or intubation (Figure 5C). A similar pattern was identified for MT-COX3 when compared with CRP, LDH, ferritin, and D-dimer levels for predicting the need for an ICU admission (Supplemental Figure 2B) and inferior for predicting mortality (Supplemental Figure 2A) but was superior to these clinically utilized markers for the need for intubation (Supplemental Figure 2C).
Figure 5. Circulating MT-DNA levels have similar or improved accuracy over clinically utilized biomarkers for outcomes of severity in COVID-19.
Blood samples for determination of biomarkers levels were collected within 24 hours from hospital presentation. ROC curves in predicting the outcomes (A) mortality, (B) admission to ICU, and (C) intubation based on MT-CYTB (red), reactive C protein (CRP) (blue), ferritin (black), lactic acid dehydrogenase (LDH) (purple), and D-dimer (green) levels. AUC with 95% CI and P values for the different biomarkers are summarized in the corresponding tables.
Circulating MT-DNA levels correlate with other emerging markers of COVID-19 severity.
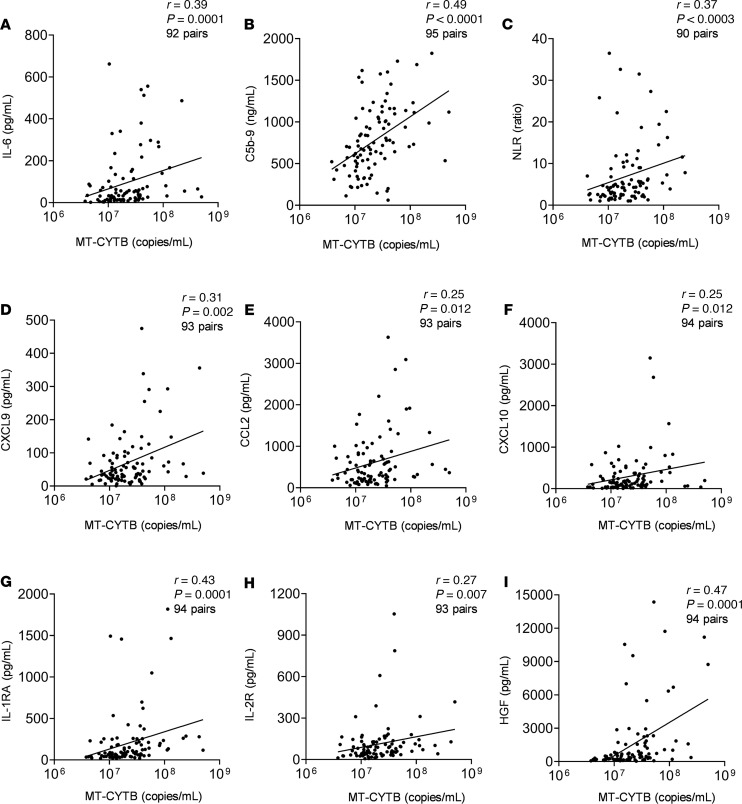
Plasma MT-CYTB levels moderately correlated with concurrently measured levels of IL-6, which has been implicated in the pathogenesis of COVID-19 (r = 0.39, 95% CI 0.196–0.555, P = 0.0001, n = 92, Figure 6A). Similarly, MT-CYTB levels highly correlated with plasma soluble C5b-9, which is a marker of complement activation and suggests the formation of a membrane attack complex (MAC) (r = 0.49, 95% CI 0.32–0.64, P < 0.0001, n = 95, Figure 6B). MT-CYTB also correlated with the neutrophil-to-lymphocyte ratio (r = 0.37, 95% CI 0.17–0.54, P = 0.0003, n = 90, Figure 6C). Plasma MT-CYTB levels had a similar or improved accuracy compared with IL-6 for mortality (Supplemental Figure 3A), ICU admission (Supplemental Figure 3B), and intubation (Supplemental Figure 3C).
Figure 6. Circulating MT-DNA levels correlate with other emerging markers of inflammation and cytokines in COVID-19 patients.
Scatter plots showing the correlation between MT-CYTB and (A) IL-6, (B) C5b-9 (terminal complement complex), and (C) neutrophil-to-lymphocyte ratio (NLR), (D) CXCL9, (E) CCL2, (F) CXCL10, (G) IL-1RA, (H) IL-2R, and (I) HGF. The degree of correlation was assessed using Spearman’s rank correlation coefficient test.
We also observed significant correlations with other biomarkers that have been implicated in the pathogenesis of COVID-19, such as CXCL9 (r = 0.31, 95% CI 0.11–0.49, P = 0.002, n = 93, Figure 6D), CCL2 (r = 0.25, 95% CI 0.05–0.44, P = 0.01, n = 93, Figure 6E), CXCL10 (r = 0.25, 95% CI 0.05–0.44, P = 0.01, P = 94, Figure 6F), IL-1RA (r = 0.43, 95% CI 0.25–0.59, P < 0.0001, n = 94, Figure 6G), and IL-2R (r = 0.27, 95% CI 0.07– 0.46, P = 0.007, P = 93, Figure 6H). Similarly, the levels of HGF highly correlated with MT-CYTB in COVID-19 (r = 0.47, 95% CI 0.29–0.62, P < 0.0001, n = 94, Figure 6I).
Discussion
Here we observe that high levels of circulating MT-DNA are an early independent risk factor for severe illness and mortality in hospitalized patients with COVID-19, after adjusting for age, sex, and comorbidities. Importantly, we made similar findings for 2 MT-DNA genes, MT-CYTB and MT-COX3, although the latter target did not reach significance for mortality risk. The reasons for this incongruence are not clear. One possibility is the accumulation of heteroplasmic mitochondrial genome deletions or point mutations that could prevent or attenuate PCR primer recognition (21). Heteroplasmic DNA deletions have been repeatedly demonstrated to accumulate with age within the MT-COX3 gene (22–24), and to a lesser degree, within the MT-CYTB locus, due to age-related defects of mitochondrial DNA polymerase proofreading capability (25, 26).
Although our studies were not specifically designed to identify the mechanisms that drive peripheral blood MT-DNA accumulation, significant correlations between LDH and IL-6 with MT-DNA levels point to a potential deleterious role for cellular necrosis in COVID-19 pathophysiology. LDH release and IL-6 production are reported indicators of cellular necrosis (27, 28). A specific form of necrosis, necroptosis, has been demonstrated to induce the release of damaged mitochondria (29). Necroptosis is characterized by the eventual loss of plasma membrane integrity due to the kinase activity of the receptor-interacting proteins 1 (RIPK1) and RIPK3 (30) and has been reported to act as a host defense mechanism when apoptotic death pathways are disabled by viral infection (31). For example, in a mouse model of influenza infection, necroptosis was shown to inhibit viral replication but with deleterious consequences to bronchial epithelial integrity (32). In humans, both H5N1 and H1N1 influenza–induced ARDS have been shown to be associated with necrotic cell death within the distal pulmonary epithelia (33, 34). Intriguingly, the accessory protein open reading frame 3a (Orf3a) expressed within the highly related SARS-CoV-1 genome has been recently demonstrated to induce necroptosis through activating RIPK3 (35). SARS-CoV-2 also expresses an Orf3a accessory protein (36). However, whether SARS-CoV-2 Orf3a promotes necroptosis has yet to be determined. Some MT-DNA release may also result from innate immune cell activation. For example, human neutrophils following activation extrude their MT-DNA due to an inability to complete mitophagy (37). Additionally, neutrophil extracellular traps (NETs), which have been found in the peripheral circulation of COVID-19 patients (38), are rich in MT-DNA (39). Neutrophils have also been identified as undergoing metabolic reprogramming in the context of SARS-CoV-2 (40). In addition to neutrophils, activated platelets also release mitochondria (41), which in turn can induce NET generation, possibly contributing to pulmonary prothrombotic complications observed in patients with severe COVID-19 illness (42). Additionally, MT-DNA has been shown to directly promote NETosis (43, 44). The source and mechanisms of MT-DNA release in response to SARS-CoV-2 infection are the subject of future investigation.
Multiple clinically established biomarkers, such as LDH, ferritin, CRP, and D-dimer, are currently being evaluated to assess the risk of clinical deterioration from a COVID-19 diagnosis (40, 45–49). However, as products of gene expression in response to both acute and chronic stimuli, they tend to be largely nonspecific measures of systemic inflammation, with the exception of LDH, a marker of cell death. Nevertheless, LDH can also be released by cells undergoing apoptosis, a predominantly antiinflammatory form of cell death (50). Ferritin is primarily produced by the liver and serves as an acute phase reactant. Similarly, D-dimer is a nonspecific test and provides us minimal insight into the underlying pathophysiology of the disease or events occurring at the cellular level. In contrast, there are accumulating observations that high amounts of MT-DNA release are specifically generated by necrotic cells (51). Additionally, high MT-DNA levels have been shown to be associated with acute lung injury, in multiple independent cohorts (12, 13, 52). In our cohort, although CYTB performed similarly to ferritin/D-dimer for mortality, it performed better than these markers in the context of identifying those at risk for an ICU admission or intubation, which are important resource utilization metrics. Moreover, we observed that MT-DNA levels were approximately 5-fold higher in COVID-19 patients who developed severe pulmonary dysfunction or eventually died, suggesting it is at least as sensitive a biomarker as other clinically established and exploratory indicators used in prediction models. To conduct plasma MT-DNA measurements, we employed a rapid PCR assay technique that takes about 60 minutes to complete because of the elimination of the DNA purification step. In resource-limited settings, this can be especially important given the current necessity to identify subjects at a higher risk of clinical deterioration. Additionally, PCR-based assays measuring MT-DNA tend to be less cost prohibitive and do not need specialized equipment, facilitating easy implementation. For the abovementioned reasons, we suggest that MT-DNA be investigated as an adjunct clinical biomarker in COVID-19. Nevertheless, whether MT-DNA levels are equivalent or better measures than routinely obtained laboratory measurements will require additional validation with independent cohorts.
Based on our data from this study, it is not possible to clearly determine if circulating MT-DNA contributes to the pathogenesis of COVID-19. Nevertheless, cell-free MT-DNA is itself a signatory marker for the release of other MT-DAMPs, which collectively drive proinflammatory cytokine expression through the engagement of pattern recognition receptors on innate immune cells (7). MT-DAMPs drive IL-6 expression by macrophages (29) and stimulate IL-8 release by neutrophils (9). Notably, IL-6 suppresses lymphopoiesis (53) while IL-8 promotes neutrophil release from the bone marrow (54) and, therefore, could possibly explain our observed correlation between MT-DNA levels and elevations in the neutrophil-to-lymphocyte ratio. We additionally noted a significant correlation between MAC and MT-DNA levels. Extracellular mitochondria have been reported to activate complement. Mannose-binding lectin has been observed to bind to cell-free mitochondria, resulting in C3 consumption in the peripheral blood of mice (55). Therefore, it is interesting to note that C3 consumption is a general sign of C3 convertase activity, which would be a prerequisite for the downstream generation of membrane attack components (56). Along those lines, complement activation has been implicated in the pathogenesis of COVID-19–related end organ damage, including acute lung injury (57, 58), with potential therapeutic implications (5, 59). Finally, MT-DAMPs, unlike other inflammatory markers linked to poor outcomes of COVID-19 patients, have been reported to directly cause acute pulmonary dysfunction and tissue damage (60). Administration of MT-DAMPs into the bloodstream or pulmonary airways of rodents promotes acute lung injury mediated by neutrophil chemotaxis and reactive oxygen species generation to mitochondrial formylated peptides (9, 14). In these studies, the formylated peptide receptor-1 inhibitor cyclosporine H was shown to inhibit MT-DAMP–mediated acute lung injury. Given ongoing clinical trials that target the effects of IL-6, complement activation and NETs in COVID-19 patients (3–5, 61, 62) future approaches that block necroptosis or MT-DAMP recognition could also be warranted.
Our study has several limitations. First, we were unable to concurrently enroll a COVID-19–negative group with severe respiratory disease. Our center, like many others, experienced a sharp decline in hospital presentations for illnesses other than COVID-19, making it difficult to collect samples for an adequately matched control group. Additionally, as our samples were drawn as a part of a prospective study of SARS-CoV-2 PCR-positive patients, any other adequately matched control group would not be entirely comparable, as not drawn concurrently. However, it is unlikely that MT-DNA levels are considerably different between patients with COVID-19 and acute respiratory diseases arising from other etiologies. For example, reports have shown that increased MT-DNA levels in critically ill patients are significantly associated with a higher risk of developing ARDS regardless of the underlying etiology (12, 13, 52). Nakahira et al. also showed that high level of plasma MT-DNA is a general marker of mortality risk in ICU patients (13). Additionally, more recent work from Huang et al. (52) shows that high plasma MT-DNA levels in ARDS patients are associated with increased risk for mortality regardless of admission diagnosis. Indeed, several emerging studies suggest that biomarkers may be no different in subjects with COVID-19–induced lung injury versus lung injury due to other etiologies (63). However, the strength of our study lies in an assay that can potentially identify subjects presenting with COVID-19 who are likely to develop adverse outcomes during their hospitalization, which becomes increasingly important when resources are constrained as has been unfortunately too common during this pandemic (64–66). Second, this study does not assess how MT-DNA correlates with viral load in COVID-19, which is especially important in the context of deciding when to intervene with targeted therapeutics (67–69). Therefore, further studies will be necessary to evaluate whether it may be a predictor of response to treatment (70). Third, decision-making in the ICU changed over the course of our enrollment. For example, there was a tendency toward intubating earlier in the course of the critical illness in the initial months of the COVID-19 pandemic. We also lack data to support objective measurement of disease severity at the time of presentation as can be reflected in SOFA, APACHE, or CURB65 scores. However, we identified MT-DNA levels as a predictor of severity utilizing mortality as a primary endpoint, then requirement of ICU admission and requirement for intubation as independent secondary endpoints. Additionally, we identified MT-DNA levels as a predictor of disease severity utilizing requirement of vasopressors and RRT while in the ICU as independent secondary endpoints of end organ dysfunction.
It also remains possible that our findings may not generally apply to all patients who contract COVID-19. Members of underrepresented minority communities are at significantly higher risk for COVID-19 infection as well as suffering its most severe outcomes. Our analysis was conducted in an urban medical center that serves a large African American community who may have a tendency to inherit MT-DNA variations that differ from other groups. This may be most exemplified in a recent report that shows certain point mutations within the MT-DNA of aging African Americans are associated with decreased pulmonary maximal inspiratory pressures (MIPs) (71). However, this study also found other point MT-DNA mutations in African Americans were associated with increased MIPs, suggesting a more complex picture for MT-DNA variation and its link to respiratory function. Nevertheless, this MT-DNA variation was not within the primer target sequences used in our assays. Finally, prior studies that analyzed other diseases that involve respiratory distress, such as ARDS and primary lung allograft dysfunction, on populations predominantly composed of Caucasians, and to lesser extent, underrepresented minority groups, demonstrated significant associations with cell-free circulating MT-DNA (12–14). Taken together with our findings, these reports support a robust association with MT-DNA levels and poor outcomes from COVID-19 infection that is likely applicable to all racial groups.
In summary, we demonstrate that MT-DNA measured early in the disease course can predict survival status, requirement for ICU-level care, the need for endotracheal intubation, as well as end organ dysfunction requiring vasopressors and RRT. We also show that MT-DNA levels are associated with exploratory biomarkers implicated in the pathogenesis of COVID-19–related morbidity and mortality. Further studies will be needed to discern the contribution of MT-DAMPs such as MT-DNA to COVID-19 pathogenesis, as well as to understand whether MT-DNA and other inflammatory mediators, such as activated complement, work synergistically to promote cellular injury.
Methods
Study design, settings, and participants.
This prospective cohort study utilized cell-free plasma samples that had been prospectively collected from 97 adult patients with confirmed COVID-19 presenting to the Barnes-Jewish Hospital from March 15, 2020, to April 24, 2020. Eligible participants included consented adults, greater than 18 years old, presenting with COVID-19 symptoms who received a COVID-19 test at the time of hospital presentation that resulted in a COVID-19 diagnosis. Diagnosis of COVID-19 was based on a positive nasopharyngeal swab test. Excluded participants were COVID-19–diagnosed patients who did not have plasma samples collected within 24 hours of time of hospital presentation.
Outcome definition.
Subjects were followed through June 29, 2020. The primary outcome was mortality. The secondary outcomes included (a) the need for an ICU admission and (b) endotracheal intubation, as well as the development of end organ dysfunction while in the ICU requiring (c) vasopressors and (d) RRT. Subjects who were on dialysis prior to admission were excluded from the RRT outcome analysis. These outcomes were abstracted utilizing an honest broker system from electronic medical records.
Sample collection and processing.
MT-DNA and other cytokines were measured in cell-free plasma of subjects within the first 24 hours of emergency department presentation. Blood samples were collected in EDTA-containing vacutainers (BD Biosciences) and subjected to 2 rounds of centrifugation to generate platelet poor plasma, first at 2500g for 20 minutes to generate plasma. The plasma was removed from vacutainers and centrifuged at 13,000g in sterile nuclease-free eppendorf tubes (Thermo Fisher Scientific) for 10 minutes to remove platelets. These platelet-poor specimens were then immediately stored at −80°C until further analysis. Concurrently measured clinical markers (i.e., CRP, ferritin, lactate dehydrogenase, D-dimer) were obtained from the electronic medical record.
MT-DNA quantification.
MT-DNA quantification real-time PCR was performed in a Bio-Rad CFX-Connect machine using reaction mixture containing 0.1 μL of cell-free plasma, 10 μL iQ SYBR Green Supermix (Bio-Rad), 0.5 μL of 5 μM forward and reverse primers, and 8.9 μL H2O. Assays were performed in triplicate under the following conditions: 1 cycle at 95°C for 3 minutes, then up to 40 cycles at 95°C for 10 seconds and 55°C for 30 seconds, and then a melt curve was performed from 65°C to 95°C (0.5°C every 5 seconds). Primers for human cytochrome b (CYB; forward 5′-ATGACCCCAATACGCAAAAT-3′ and reverse 5′-CGAAGTTTCATCATGCGGAG-3′) and human cytochrome c oxidase subunit III (COX3: forward 5′-ATGACCCACCAATCACATGC-3′ and reverse 5′-ATCACATGGCTAGGCCGGAG-3′) were synthesized by Integrated DNA Technologies. Copy number was estimated by comparison to a real-time PCR standard amplification curve. To generate the standard curve, selected regions of human purified MT-DNA containing the target sequences for MT-CYTB (forward 5′-ATGACCCCAATACGCAAAAT-3′ and reverse 5′-GACGGATCGGAGAATTGTGT-3′) and MT-COX3 (forward 5′-ATGACCCACCAATCACATGC-3′ and reverse 5′-ATCAATAGATGGAGACATAC-3′) were amplified by PCR under the following conditions: initial denaturation at 94°C for 2 minutes, then up to 35 cycles of denaturation at 94°C for 30 seconds, annealing at 50°C for 30 seconds, and extension at 72°C for 1 minute. After amplification, MT-DNA was gel purified, extracted, and quantified by NanoDrop (Thermo Fisher Scientific). Serial dilutions were then used to calibrate the real-time PCR standard curves. Final results were expressed as copy number of MT-DNA, and their absolute values were converted to log10 before statistical analysis.
Quantification of cytokines and complement activation.
Cell-free plasma was analyzed using a Cytokine 35-Plex Human Panel, which provides simultaneous measurement of 35 cytokines (Thermo Fisher Scientific). The assay was performed in accordance with manufacturer’s instructions with each subject sample performed in duplicate and then analyzed on a Luminex FLEXMAP 3D instrument. Internal validation control with every plate also was run in duplicate. Complement activation was assessed in cell-free plasma specimens (not previously thawed) using the soluble C5b-9 assay (BD Biosciences OptEIA Human C5b-9 ELISA set).
Statistics.
Continuous variables were reported as median (interquartile range). The predictive value of each biomarker was expressed as AUC derived from the relative ROC curve. Spearman r coefficient was calculated to estimate the correlation between 2 continuous variables. Univariate logistic regression analysis was used to calculate the unadjusted ORs. Independent variables known to have a biological relationship with the outcomes were selected a priori based on existing literature for the multivariate logistic model to calculate the adjusted ORs (72–74). Model diagnostics were performed with Corrected Akaike Information Criterion, log likelihood, and model deviance. The MT-DNA was log (base 10) transformed prior to data analysis to better meet model assumptions. To facilitate interpretation for this variable, the OR estimates were raised to the 0.5 power, which is interpreted as the increase in the odds of the outcome for each 0.5 change in MT-DNA on the log scale. All the statistical analyses were calculated and all figures were prepared using GraphPad Prism 8.4.2 (GraphPad Software Inc.). For all the analyses, a P value less than 0.05 was considered significant.
Study approval.
The study was approved by the Washington University School of Medicine Institutional Review Board (ID 202004091 and 202003085). Written informed consent was obtained from all subjects.
Author contributions
HSK, AEG, and MI conceived the study; DS, MC, CG, HSK, and AEG performed methodology; DS, MC, and HSK ran software; JAO, AMR, and CG validated data; DS, MC, VP, MR, AMR, RA, LA, HSK, and AEG performed formal analysis; LM, DZ, SKS, and JHZ investigated; LM, DS, MC, HSK, and AEG curated data; DS, MC, HSK, and AEG wrote the original draft; DS, MC, LM, JH, CG, AMR, ZL, SKS, RH, MI, DK, HSK, and AEG reviewed and edited the draft; DS and MC performed visualization; HSK and AEG supervised, HSK and AEG administered the project, HSK, RRH, DK, and AEG acquired funding. Co–first authors DS and MC equally contributed to methodology, data, and software analysis. They also helped write and reviewed and edited the original draft. The decision to order them as listed was due to DS’s novel contribution to the PCR method used in this study.
Supplementary Material
Acknowledgments
AEG is supported by Washington University ICTS COVID-19 Research Program, The Foundation for Barnes-Jewish Hospital, NIH R01HL094601, and NIH P01AI116501. HSK is supported by NIH K08HL148510 and the Children’s Discovery Institute. JAO, CG, and PAM are supported by Washington University ICTS grant UL1TR002345 from the National Center for Advancing Translational Sciences of the NIH. Sample procurement and patient outcome data collection were supported by a $250,000 grant from The Foundation for Barnes-Jewish Hospital and Washington University ICTS NIH grants UL1TR002345 and P30 CA091842. The content is solely the responsibility of the authors and does not necessarily represent the official view of the NIH.
Version 1. 01/14/2021
In-Press Preview
Version 2. 02/22/2021
Electronic publication
Funding Statement
Sample procurement and patient outcome data collection was supported by the Washington University ICTS NIH grant
Footnotes
Conflict of interest: The authors have declared that no conflict of interest exists.
Copyright: © 2021, Scozzi et al. This is an open access article published under the terms of the Creative Commons Attribution 4.0 International License.
Reference information: JCI Insight. 2021;6(4):e143299.https://doi.org/10.1172/jci.insight.143299.
Contributor Information
Davide Scozzi, Email: dscozzi@wustl.edu.
Marlene Cano, Email: mcano@wustl.edu.
Lina Ma, Email: Lma22@wustl.edu.
Dequan Zhou, Email: DZhou22@WUSTL.EDU.
Ji Hong Zhu, Email: Jihongzhu@wustl.edu.
Jane A. O’Halloran, Email: janeaohalloran@wustl.edu.
Adriana M. Rauseo, Email: a.rauseoacevedo@wustl.edu.
Zhiyi Liu, Email: liuzhiyi@wustl.edu.
Valentina Peritore, Email: Valentina.peritore1@gmail.com.
Monica Rocco, Email: monica.rocco@uniroma1.it.
Alberto Ricci, Email: alberto.ricci@uniroma1.it.
Rachele Amodeo, Email: rachele.amodeo@ospedalesantandrea.it.
Laura Aimati, Email: laura.aimati@gmail.com.
Mohsen Ibrahim, Email: mohsen.ibrahim@uniroma1.it.
Daniel Kreisel, Email: kreiseld@wustl.edu.
Philip A. Mudd, Email: pmudd@wustl.edu.
Hrishikesh S. Kulkarni, Email: hkulkarn@wustl.edu.
Andrew E. Gelman, Email: gelmana@wudosis.wustl.edu.
References
- 1.Lipman M, et al. SARS-CoV-2 pandemic: clinical picture of COVID-19 and implications for research. Thorax. 2020;75(8):614–616. doi: 10.1136/thoraxjnl-2020-215024. [DOI] [PubMed] [Google Scholar]
- 2.Vabret N, et al. Immunology of COVID-19: current state of the science. Immunity. 2020;52(6):910–941. doi: 10.1016/j.immuni.2020.05.002. [DOI] [PMC free article] [PubMed] [Google Scholar]
- 3.Maes B, et al. Treatment of severely ill COVID-19 patients with anti-interleukin drugs (COV-AID): a structured summary of a study protocol for a randomised controlled trial. Trials. 2020;21(1):468. doi: 10.1186/s13063-020-04453-5. [DOI] [PMC free article] [PubMed] [Google Scholar]
- 4.Rilinger J, et al. A prospective, randomised, double blind placebo-controlled trial to evaluate the efficacy and safety of tocilizumab in patients with severe COVID-19 pneumonia (TOC-COVID): a structured summary of a study protocol for a randomised controlled trial. Trials. 2020;21(1):470. doi: 10.1186/s13063-020-04447-3. [DOI] [PMC free article] [PubMed] [Google Scholar]
- 5.Smith K, et al. A phase 3 open-label, randomized, controlled study to evaluate the efficacy and safety of intravenously administered ravulizumab compared with best supportive care in patients with COVID-19 severe pneumonia, acute lung injury, or acute respiratory distress syndrome: a structured summary of a study protocol for a randomised controlled trial. Trials. 2020;21(1):639. doi: 10.1186/s13063-020-04548-z. [DOI] [PMC free article] [PubMed] [Google Scholar]
- 6.Nailwal H, Chan FK. Necroptosis in anti-viral inflammation. Cell Death Differ. 2019;26(1):4–13. doi: 10.1038/s41418-018-0172-x. [DOI] [PMC free article] [PubMed] [Google Scholar]
- 7.Kulkarni HS, et al. Recent advances into the role of pattern recognition receptors in transplantation. Cell Immunol. 2020;351:104088. doi: 10.1016/j.cellimm.2020.104088. [DOI] [PMC free article] [PubMed] [Google Scholar]
- 8.Zhang Q, et al. Circulating mitochondrial DAMPs cause inflammatory responses to injury. Nature. 2010;464(7285):104–107. doi: 10.1038/nature08780. [DOI] [PMC free article] [PubMed] [Google Scholar]
- 9.Hauser CJ, et al. Mitochondrial damage associated molecular patterns from femoral reamings activate neutrophils through formyl peptide receptors and P44/42 MAP kinase. J Orthop Trauma. 2010;24(9):534–538. doi: 10.1097/BOT.0b013e3181ec4991. [DOI] [PMC free article] [PubMed] [Google Scholar]
- 10.Simmons JD, et al. Elevated levels of plasma mitochondrial DNA DAMPs are linked to clinical outcome in severely injured human subjects. Ann Surg. 2013;258(4):591–596. doi: 10.1097/SLA.0b013e3182a4ea46. [DOI] [PMC free article] [PubMed] [Google Scholar]
- 11.Puskarich MA, et al. Plasma levels of mitochondrial DNA in patients presenting to the emergency department with sepsis. Shock. 2012;38(4):337–340. doi: 10.1097/SHK.0b013e318266a169. [DOI] [PMC free article] [PubMed] [Google Scholar]
- 12.Faust HE, et al. Plasma mitochondrial DNA levels are associated with ARDS in trauma and sepsis patients. Chest. 2020;157(1):67–76. doi: 10.1016/j.chest.2019.09.028. [DOI] [PMC free article] [PubMed] [Google Scholar]
- 13.Nakahira K, et al. Circulating mitochondrial DNA in patients in the ICU as a marker of mortality: derivation and validation. PLoS Med. 2013;10(12):1001577. doi: 10.1371/journal.pmed.1001577. [DOI] [PMC free article] [PubMed] [Google Scholar]
- 14.Scozzi D, et al. Mitochondrial damage-associated molecular patterns released by lung transplants are associated with primary graft dysfunction. Am J Transplant. 2019;19(5):1464–1477. doi: 10.1111/ajt.15232. [DOI] [PMC free article] [PubMed] [Google Scholar]
- 15.Grazioli S, Pugin J. Mitochondrial damage-associated molecular patterns: from inflammatory signaling to human diseases. Front Immunol. 2018;9:832. doi: 10.3389/fimmu.2018.00832. [DOI] [PMC free article] [PubMed] [Google Scholar]
- 16.Wu G, et al. Extracellular mitochondrial DNA promote NLRP3 inflammasome activation and induce acute lung injury through TLR9 and NF-κB. J Thorac Dis. 2019;11(11):4816–4828. doi: 10.21037/jtd.2019.10.26. [DOI] [PMC free article] [PubMed] [Google Scholar]
- 17.Zhang JZ, et al. Mitochondrial DNA induces inflammation and increases TLR9/NF-κB expression in lung tissue. Int J Mol Med. 2014;33(4):817–824. doi: 10.3892/ijmm.2014.1650. [DOI] [PMC free article] [PubMed] [Google Scholar] [Retracted]
- 18.Dorward DA, et al. Novel role for endogenous mitochondrial formylated peptide-driven formyl peptide receptor 1 signalling in acute respiratory distress syndrome. Thorax. 2017;72(10):928–936. doi: 10.1136/thoraxjnl-2017-210030. [DOI] [PMC free article] [PubMed] [Google Scholar]
- 19.Nakayama H, Otsu K. Mitochondrial DNA as an inflammatory mediator in cardiovascular diseases. Biochem J. 2018;475(5):839–852. doi: 10.1042/BCJ20170714. [DOI] [PMC free article] [PubMed] [Google Scholar]
- 20.Mangalmurti N, Hunter CA. Cytokine storms: understanding COVID-19. Immunity. 2020;53(1):19–25. doi: 10.1016/j.immuni.2020.06.017. [DOI] [PMC free article] [PubMed] [Google Scholar]
- 21.Wallace DC, Chalkia D. Mitochondrial DNA genetics and the heteroplasmy conundrum in evolution and disease. Cold Spring Harb Perspect Biol. 2013;5(11):021220. doi: 10.1101/cshperspect.a021220. [DOI] [PMC free article] [PubMed] [Google Scholar]
- 22.Müller-Höcker J. Cytochrome-c-oxidase deficient cardiomyocytes in the human heart--an age-related phenomenon. A histochemical ultracytochemical study. Am J Pathol. 1989;134(5):1167–1173. [PMC free article] [PubMed] [Google Scholar]
- 23.Kraytsberg Y, et al. Mitochondrial DNA deletions are abundant and cause functional impairment in aged human substantia nigra neurons. Nat Genet. 2006;38(5):518–520. doi: 10.1038/ng1778. [DOI] [PubMed] [Google Scholar]
- 24.He L, et al. Detection and quantification of mitochondrial DNA deletions in individual cells by real-time PCR. Nucleic Acids Res. 2002;30(14):68. doi: 10.1093/nar/gnf067. [DOI] [PMC free article] [PubMed] [Google Scholar]
- 25.Lujan SA, et al. Ultrasensitive deletion detection links mitochondrial DNA replication, disease, and aging. Genome Biol. 2020;21(1):248. doi: 10.1186/s13059-020-02138-5. [DOI] [PMC free article] [PubMed] [Google Scholar]
- 26.Trifunovic A, et al. Premature ageing in mice expressing defective mitochondrial DNA polymerase. Nature. 2004;429(6990):417–423. doi: 10.1038/nature02517. [DOI] [PubMed] [Google Scholar]
- 27.Vanden Berghe T, et al. Necrosis is associated with IL-6 production but apoptosis is not. Cell Signal. 2006;18(3):328–335. doi: 10.1016/j.cellsig.2005.05.003. [DOI] [PubMed] [Google Scholar]
- 28.Chan FK, et al. Detection of necrosis by release of lactate dehydrogenase activity. Methods Mol Biol. 2013;979:65–70. doi: 10.1007/978-1-62703-290-2_7. [DOI] [PMC free article] [PubMed] [Google Scholar]
- 29.Maeda A, Fadeel B. Mitochondria released by cells undergoing TNF-α-induced necroptosis act as danger signals. Cell Death Dis. 2014;5(7):1312. doi: 10.1038/cddis.2014.277. [DOI] [PMC free article] [PubMed] [Google Scholar]
- 30.He S, et al. Receptor interacting protein kinase-3 determines cellular necrotic response to TNF-alpha. Cell. 2009;137(6):1100–1111. doi: 10.1016/j.cell.2009.05.021. [DOI] [PubMed] [Google Scholar]
- 31.Cho YS, et al. Phosphorylation-driven assembly of the RIP1-RIP3 complex regulates programmed necrosis and virus-induced inflammation. Cell. 2009;137(6):1112–1123. doi: 10.1016/j.cell.2009.05.037. [DOI] [PMC free article] [PubMed] [Google Scholar]
- 32.Rodrigue-Gervais IG, et al. Cellular inhibitor of apoptosis protein cIAP2 protects against pulmonary tissue necrosis during influenza virus infection to promote host survival. Cell Host Microbe. 2014;15(1):23–35. doi: 10.1016/j.chom.2013.12.003. [DOI] [PubMed] [Google Scholar]
- 33.Gu J, Korteweg C. Pathology and pathogenesis of severe acute respiratory syndrome. Am J Pathol. 2007;170(4):1136–1147. doi: 10.2353/ajpath.2007.061088. [DOI] [PMC free article] [PubMed] [Google Scholar]
- 34.Mauad T, et al. Lung pathology in fatal novel human influenza A (H1N1) infection. Am J Respir Crit Care Med. 2010;181(1):72–79. doi: 10.1164/rccm.200909-1420OC. [DOI] [PubMed] [Google Scholar]
- 35.Yue Y, et al. SARS-coronavirus open reading frame-3a drives multimodal necrotic cell death. Cell Death Dis. 2018;9(9):904. doi: 10.1038/s41419-018-0917-y. [DOI] [PMC free article] [PubMed] [Google Scholar]
- 36.Bojkova D, et al. Proteomics of SARS-CoV-2-infected host cells reveals therapy targets. Nature. 2020;583(7816):469–472. doi: 10.1038/s41586-020-2332-7. [DOI] [PMC free article] [PubMed] [Google Scholar]
- 37.Caielli S, et al. Oxidized mitochondrial nucleoids released by neutrophils drive type I interferon production in human lupus. J Exp Med. 2016;213(5):697–713. doi: 10.1084/jem.20151876. [DOI] [PMC free article] [PubMed] [Google Scholar]
- 38.Zuo Y, et al. Neutrophil extracellular traps in COVID-19. JCI Insight. 2020;5(11):138999. doi: 10.1172/jci.insight.138999. [DOI] [PMC free article] [PubMed] [Google Scholar]
- 39.Yousefi S, et al. Viable neutrophils release mitochondrial DNA to form neutrophil extracellular traps. Cell Death Differ. 2009;16(11):1438–1444. doi: 10.1038/cdd.2009.96. [DOI] [PubMed] [Google Scholar]
- 40.McElvaney OJ, et al. Characterization of the inflammatory response to severe COVID-19 illness. Am J Respir Crit Care Med. 2020;202(6):812–821. doi: 10.1164/rccm.202005-1583OC. [DOI] [PMC free article] [PubMed] [Google Scholar]
- 41.Boudreau LH, et al. Platelets release mitochondria serving as substrate for bactericidal group IIA-secreted phospholipase A2 to promote inflammation. Blood. 2014;124(14):2173–2183. doi: 10.1182/blood-2014-05-573543. [DOI] [PMC free article] [PubMed] [Google Scholar]
- 42.Middleton EA, et al. Neutrophil extracellular traps (NETs) contribute to immunothrombosis in COVID-19 acute respiratory distress syndrome. Blood. 2020;136(10):1169–1179. doi: 10.1182/blood.2020007008. [DOI] [PMC free article] [PubMed] [Google Scholar]
- 43.Itagaki K, et al. Mitochondrial DNA released by trauma induces neutrophil extracellular traps. PLoS One. 2015;10(3):0120549. doi: 10.1371/journal.pone.0120549. [DOI] [PMC free article] [PubMed] [Google Scholar]
- 44.Mallavia B, et al. Mitochondrial DNA stimulates TLR9-dependent neutrophil extracellular trap formation in primary graft dysfunction. Am J Respir Cell Mol Biol. 2020;62(3):364–372. doi: 10.1165/rcmb.2019-0140OC. [DOI] [PMC free article] [PubMed] [Google Scholar]
- 45.Messner CB, et al. Ultra-high-throughput clinical proteomics reveals classifiers of COVID-19 infection. Cell Syst. 2020;11(1):11–24. doi: 10.1016/j.cels.2020.05.012. [DOI] [PMC free article] [PubMed] [Google Scholar]
- 46.Song JW, et al. Omics-driven systems interrogation of metabolic dysregulation in COVID-19 pathogenesis. Cell Metab. 2020;32(2):188–202. doi: 10.1016/j.cmet.2020.06.016. [DOI] [PMC free article] [PubMed] [Google Scholar]
- 47.Luo M, et al. IL-6 and CD8+ T cell counts combined are an early predictor of in-hospital mortality of patients with COVID-19. JCI Insight. 2020;5(13):139024. doi: 10.1172/jci.insight.139024. [DOI] [PMC free article] [PubMed] [Google Scholar]
- 48.Cummings MJ, et al. Epidemiology, clinical course, and outcomes of critically ill adults with COVID-19 in New York City: a prospective cohort study. Lancet. 2020;395(10239):1763–1770. doi: 10.1016/S0140-6736(20)31189-2. [DOI] [PMC free article] [PubMed] [Google Scholar]
- 49.Wu Y, et al. Clinical characteristics and immune injury mechanisms in 71 patients with COVID-19. mSphere. 2020;5(4):00362–20. doi: 10.1128/mSphere.00362-20. [DOI] [PMC free article] [PubMed] [Google Scholar]
- 50.Kumar P, et al. Analysis of cell viability by the lactate dehydrogenase assay. Cold Spring Harb Protoc. 2018;2018(6) doi: 10.1101/pdb.prot095497. [DOI] [PubMed] [Google Scholar]
- 51.Vringer E, Tait SWG. Mitochondria and inflammation: cell death heats up. Front Cell Dev Biol. 2019;7:100. doi: 10.3389/fcell.2019.00100. [DOI] [PMC free article] [PubMed] [Google Scholar]
- 52.Huang L, et al. Prognostic value of plasma mitochondrial DNA in acute respiratory distress syndrome (ARDS): a single-center observational study. J Thorac Dis. 2020;12(4):1320–1328. doi: 10.21037/jtd.2020.02.49. [DOI] [PMC free article] [PubMed] [Google Scholar]
- 53.Maeda K, et al. IL-6 blocks a discrete early step in lymphopoiesis. Blood. 2005;106(3):879–885. doi: 10.1182/blood-2005-02-0456. [DOI] [PMC free article] [PubMed] [Google Scholar]
- 54.Terashima T, et al. Release of polymorphonuclear leukocytes from the bone marrow by interleukin-8. Blood. 1998;92(3):1062–1069. [PubMed] [Google Scholar]
- 55.Brinkmann CR, et al. Mitochondria and the lectin pathway of complement. J Biol Chem. 2013;288(12):8016–8027. doi: 10.1074/jbc.M112.430249. [DOI] [PMC free article] [PubMed] [Google Scholar]
- 56.Leslie RG, Nielsen CH. The classical and alternative pathways of complement activation play distinct roles in spontaneous C3 fragment deposition and membrane attack complex (MAC) formation on human B lymphocytes. Immunology. 2004;111(1):86–90. doi: 10.1111/j.1365-2567.2004.01780.x. [DOI] [PMC free article] [PubMed] [Google Scholar]
- 57.Java A, et al. The complement system in COVID-19: friend and foe? JCI Insight. 2020;5(15):140711. doi: 10.1172/jci.insight.140711. [DOI] [PMC free article] [PubMed] [Google Scholar]
- 58.Magro C, et al. Complement associated microvascular injury and thrombosis in the pathogenesis of severe COVID-19 infection: a report of five cases. Transl Res. 2020;220:1–13. doi: 10.1016/j.trsl.2020.04.007. [DOI] [PMC free article] [PubMed] [Google Scholar]
- 59.Kulasekararaj AG, et al. Terminal complement inhibition dampens the inflammation during COVID-19. Br J Haematol. 2020;190(3):141–143. doi: 10.1111/bjh.16916. [DOI] [PMC free article] [PubMed] [Google Scholar]
- 60.Lee YL, et al. Mitochondrial DNA damage initiates acute lung injury and multi-organ system failure evoked in rats by intra-tracheal pseudomonas aeruginosa. Shock. 2017;48(1):54–60. doi: 10.1097/SHK.0000000000000838. [DOI] [PMC free article] [PubMed] [Google Scholar]
- 61.Kulkarni S, et al. Repurposed immunomodulatory drugs for Covid-19 in pre-ICu patients - mulTi-arm therapeutic study in pre-ICu patients admitted with Covid-19 - repurposed drugs (TACTIC-R): a structured summary of a study protocol for a randomised controlled trial. Trials. 2020;21(1):626. doi: 10.1186/s13063-020-04535-4. [DOI] [PMC free article] [PubMed] [Google Scholar]
- 62.Desilles JP, et al. Efficacy and safety of aerosolized intra-tracheal dornase alfa administration in patients with SARS-CoV-2-induced acute respiratory distress syndrome (ARDS): a structured summary of a study protocol for a randomised controlled trial. Trials. 2020;21(1):548. doi: 10.1186/s13063-020-04488-8. [DOI] [PMC free article] [PubMed] [Google Scholar]
- 63.Sinha P, et al. Is a “Cytokine storm” relevant to COVID-19? JAMA Intern Med. 2020;180(9):1152–1154. doi: 10.1001/jamainternmed.2020.3313. [DOI] [PubMed] [Google Scholar]
- 64.Barrett K, et al. Estimation of COVID-19-induced depletion of hospital resources in Ontario, Canada. CMAJ. 2020;192(24):E640–E646. doi: 10.1503/cmaj.200715. [DOI] [PMC free article] [PubMed] [Google Scholar]
- 65.Litton E, et al. Surge capacity of intensive care units in case of acute increase in demand caused by COVID-19 in Australia. Med J Aust. 2020;212(10):463–467. doi: 10.5694/mja2.50596. [DOI] [PMC free article] [PubMed] [Google Scholar]
- 66.Moghadas SM, et al. Projecting hospital utilization during the COVID-19 outbreaks in the United States. Proc Natl Acad Sci U S A. 2020;117(16):9122–9126. doi: 10.1073/pnas.2004064117. [DOI] [PMC free article] [PubMed] [Google Scholar]
- 67.Catanzaro M, et al. Immune response in COVID-19: addressing a pharmacological challenge by targeting pathways triggered by SARS-CoV-2. Signal Transduct Target Ther. 2020;5(1):84. doi: 10.1038/s41392-020-0191-1. [DOI] [PMC free article] [PubMed] [Google Scholar]
- 68.Du SQ, Yuan W. Mathematical modeling of interaction between innate and adaptive immune responses in COVID-19 and implications for viral pathogenesis. J Med Virol. 2020;92(9):1615–1628. doi: 10.1002/jmv.25866. [DOI] [PMC free article] [PubMed] [Google Scholar]
- 69.Maggi E, et al. COVID-19: Unanswered questions on immune response and pathogenesis. J Allergy Clin Immunol. 2020;146(1):18–22. doi: 10.1016/j.jaci.2020.05.001. [DOI] [PMC free article] [PubMed] [Google Scholar]
- 70.Sinha P, et al. Development and validation of parsimonious algorithms to classify acute respiratory distress syndrome phenotypes: a secondary analysis of randomised controlled trials. Lancet Respir Med. 2020;8(3):247–257. doi: 10.1016/S2213-2600(19)30369-8. [DOI] [PMC free article] [PubMed] [Google Scholar]
- 71.Vaz Fragoso CA, et al. Mitochondrial DNA variants and pulmonary function in older persons. Exp Gerontol. 2019;115:96–103. doi: 10.1016/j.exger.2018.11.023. [DOI] [PMC free article] [PubMed] [Google Scholar]
- 72.Lederer DJ, et al. Control of confounding and reporting of results in causal inference studies. guidance for authors from editors of respiratory, sleep, and critical care journals. Ann Am Thorac Soc. 2019;16(1):22–28. doi: 10.1513/AnnalsATS.201808-564PS. [DOI] [PubMed] [Google Scholar]
- 73.Petrilli CM, et al. Factors associated with hospital admission and critical illness among 5279 people with coronavirus disease 2019 in New York City: prospective cohort study. BMJ. 2020;369:m1966. doi: 10.1136/bmj.m1966. [DOI] [PMC free article] [PubMed] [Google Scholar]
- 74.Williamson EJ, et al. OpenSAFELY: factors associated with COVID-19 death in 17 million patients. Nature. 2020;584(7821):430–436. doi: 10.1038/s41586-020-2521-4. [DOI] [PMC free article] [PubMed] [Google Scholar]
Associated Data
This section collects any data citations, data availability statements, or supplementary materials included in this article.


