Abstract
The transcriptomic classification of glioblastoma (GBM) has failed to predict survival and therapeutic vulnerabilities. A computational approach for unbiased identification of core biological traits of single cells and bulk tumors uncovered four tumor cell states and GBM subtypes distributed along neurodevelopmental and metabolic axes, classified as proliferative/progenitor, neuronal, mitochondrial and glycolytic/plurimetabolic. Each subtype was enriched with biologically coherent multiomic features. Mitochondrial GBM was associated with the most favorable clinical outcome. It relied exclusively on oxidative phosphorylation for energy production, whereas the glycolytic/plurimetabolic subtype was sustained by aerobic glycolysis and amino acid and lipid metabolism. Deletion of the glucose-proton symporter SLC45A1 was the truncal alteration most significantly associated with mitochondrial GBM, and the reintroduction of SLC45A1 in mitochondrial glioma cells induced acidification and loss of fitness. Mitochondrial, but not glycolytic/plurimetabolic, GBM exhibited marked vulnerability to inhibitors of oxidative phosphorylation. The pathway-based classification of GBM informs survival and enables precision targeting of cancer metabolism.
Transcriptomic analyses have emerged as important approaches for the classification of tumors into molecular subtypes with distinct clinical outcome and response to therapies1. However, for certain tumors such as GBM, the transcriptomic classification has failed to indicate prognosis and pharmacologic vulnerability2,3, especially when considering the highly aggressive isocitrate dehydrogenase (IDH) wild-type group. In particular, the lack of association between biologically defined subgroups of IDH wild-type GBM and survival has hindered the discovery of the unique mechanisms that sustain tumor progression in subgroups of patients.
Recent data in single cells have shown that the transcriptomic subgroups used to classify GBM are preferentially enriched in tumor cells exhibiting distinct lineage-specific cellular states4. However, it remains untested whether fundamental biological activities of individual GBM cells can be used to build a classification of bulk tumors that is also clinically informative. Because pathway-based classifications of transcriptomic cancer data have shown higher stability of biological activities and better performance than gene-based classifiers5, we developed a computational approach to extract the core tumor cell intrinsic biological states of individual GBM cells from GBM single-cell RNA-sequencing (scRNA-seq) data4,6,7 and bulk tumors. The analyses converged on four stable cellular states that embody metabolic (mitochondrial and glycolytic/plurimetabolic) and developmental (neuronal and proliferative/progenitor) attributes, and generated a new GBM classification. The mitochondrial subtype is dependent on oxidative phosphorylation (OXPHOS) and stratifies patients with a more favorable clinical outcome. Multiomics analysis revealed that the mitochondrial group of GBM contrasts with the poor-prognosis, glycolytic/plurimetabolic subgroup that is sustained by concurrent activation of multiple energy-producing programs, which confer metabolic versatility and protection from oxidative stress. The mitochondrial subgroup of GBM exhibits unique sensitivity to inhibitors of mitochondrial metabolism, thus providing insights into the selection of patients with GBM who could benefit from targeted metabolic therapies.
Pathway-based analysis of single glioma cells identifies four cellular states converging on two biological axes
To generate an unbiased classification of GBM that encapsulates cellular states fundamental to glioma biology, we sought to identify key phenotypic patterns from scRNA-seq data including 36 adult high-grade gliomas (17,367 single glioma cells; Supplementary Table 1) from three independent datasets4,6,7. To define the core biological state of individual glioma cells, we developed an unbiased computational approach (single-cell biological pathway deconvolution, scBiPaD) that scored the activity of 5,032 pathways in each cell and grouped cells with similar biological pathway enrichment (Extended Data Fig. 1 and Supplementary Note). We built a consensus clustering of all cells in each tumor and estimated the closeness of individual tumor clusters. We assigned 91% of the cells to four distinct clusters, which we defined as glycolytic/plurimetabolic (GPM, marked in red throughout the manuscript), mitochondrial (MTC, green), neuronal (NEU, blue) and proliferative/progenitor (PPR, cyan) based on the most active biological functions in each cluster (Fig. 1a,b and Supplementary Table 2a). The same four-cluster distribution and biological membership was obtained when the clustering analysis was applied independently to each scRNA-seq dataset (Supplementary Table 2b–d and Fig. 3 within the Supplementary Note). The GPM cluster was sustained by a large array of metabolic activities that, in addition to glycolysis/hypoxia-related functions, included the metabolism of lipids, amino acids, steroids, iron and sulfur but excluded mitochondrial/OXPHOS activities (Fig. 1c and Supplementary Table 2e). This cluster was also enriched in mesenchymal and immune-related functions. Mitochondrial metabolism and OXPHOS were the hallmarks of the MTC cluster that also included fatty acid oxidation and general mitochondrial functions (Fig. 1d and Supplementary Table 2e). Most subunits of mitochondrial complex I that can be inactivated in cancer cells to generate the Warburg effect8 were highly expressed in MTC compared to the other clusters (Extended Data Fig. 2a and Supplementary Table 3a). The NEU cluster was uniquely characterized by specialized neuronal functions such as axonogenesis and synaptic transmission (Fig. 1e and Supplementary Table 2e). Multiple neurotransmitter receptors that have recently been associated with the neuronal functions that promote glioma–neuron synapsis and brain tumor aggressiveness9 were specifically elevated in the NEU cluster (Extended Data Fig. 2b and Supplementary Table 3b). Finally, the PPR cluster was enriched in pathways associated with cell cycle progression, DNA replication, mitosis and DNA damage repair (Fig. 1f and Supplementary Table 2e) and markers of neural stem/progenitor cells (Extended Data Fig. 2c and Supplementary Table 3c,d). Recently, scRNA-seq has been used to deconvolute the phenotypic states of GBM cells into six lineage-specific cellular identities: astrocyte-like (AC), mesenchymal-like 1 (Mes1), mesenchymal-like 2 (Mes2), neural progenitor cell-like 1 (NPC1), neural progenitor cell-like 2 (NPC2) and oligodendrocyte progenitor cell-like (OPC)4. We examined the relationship between pathway-based and lineage-specific cellular states. The neurodevelopmental association of PPR and NEU states was evident from the enrichment in NPC1, NPC2 and OPC signatures. Conversely, the GPM and MTC transcriptional states exhibited preferential enrichment with the MES and AC cell state, respectively (Extended Data Fig. 2d and Supplementary Table 4).
Fig. 1 |. Identification of four core functional states in single glioma cells.
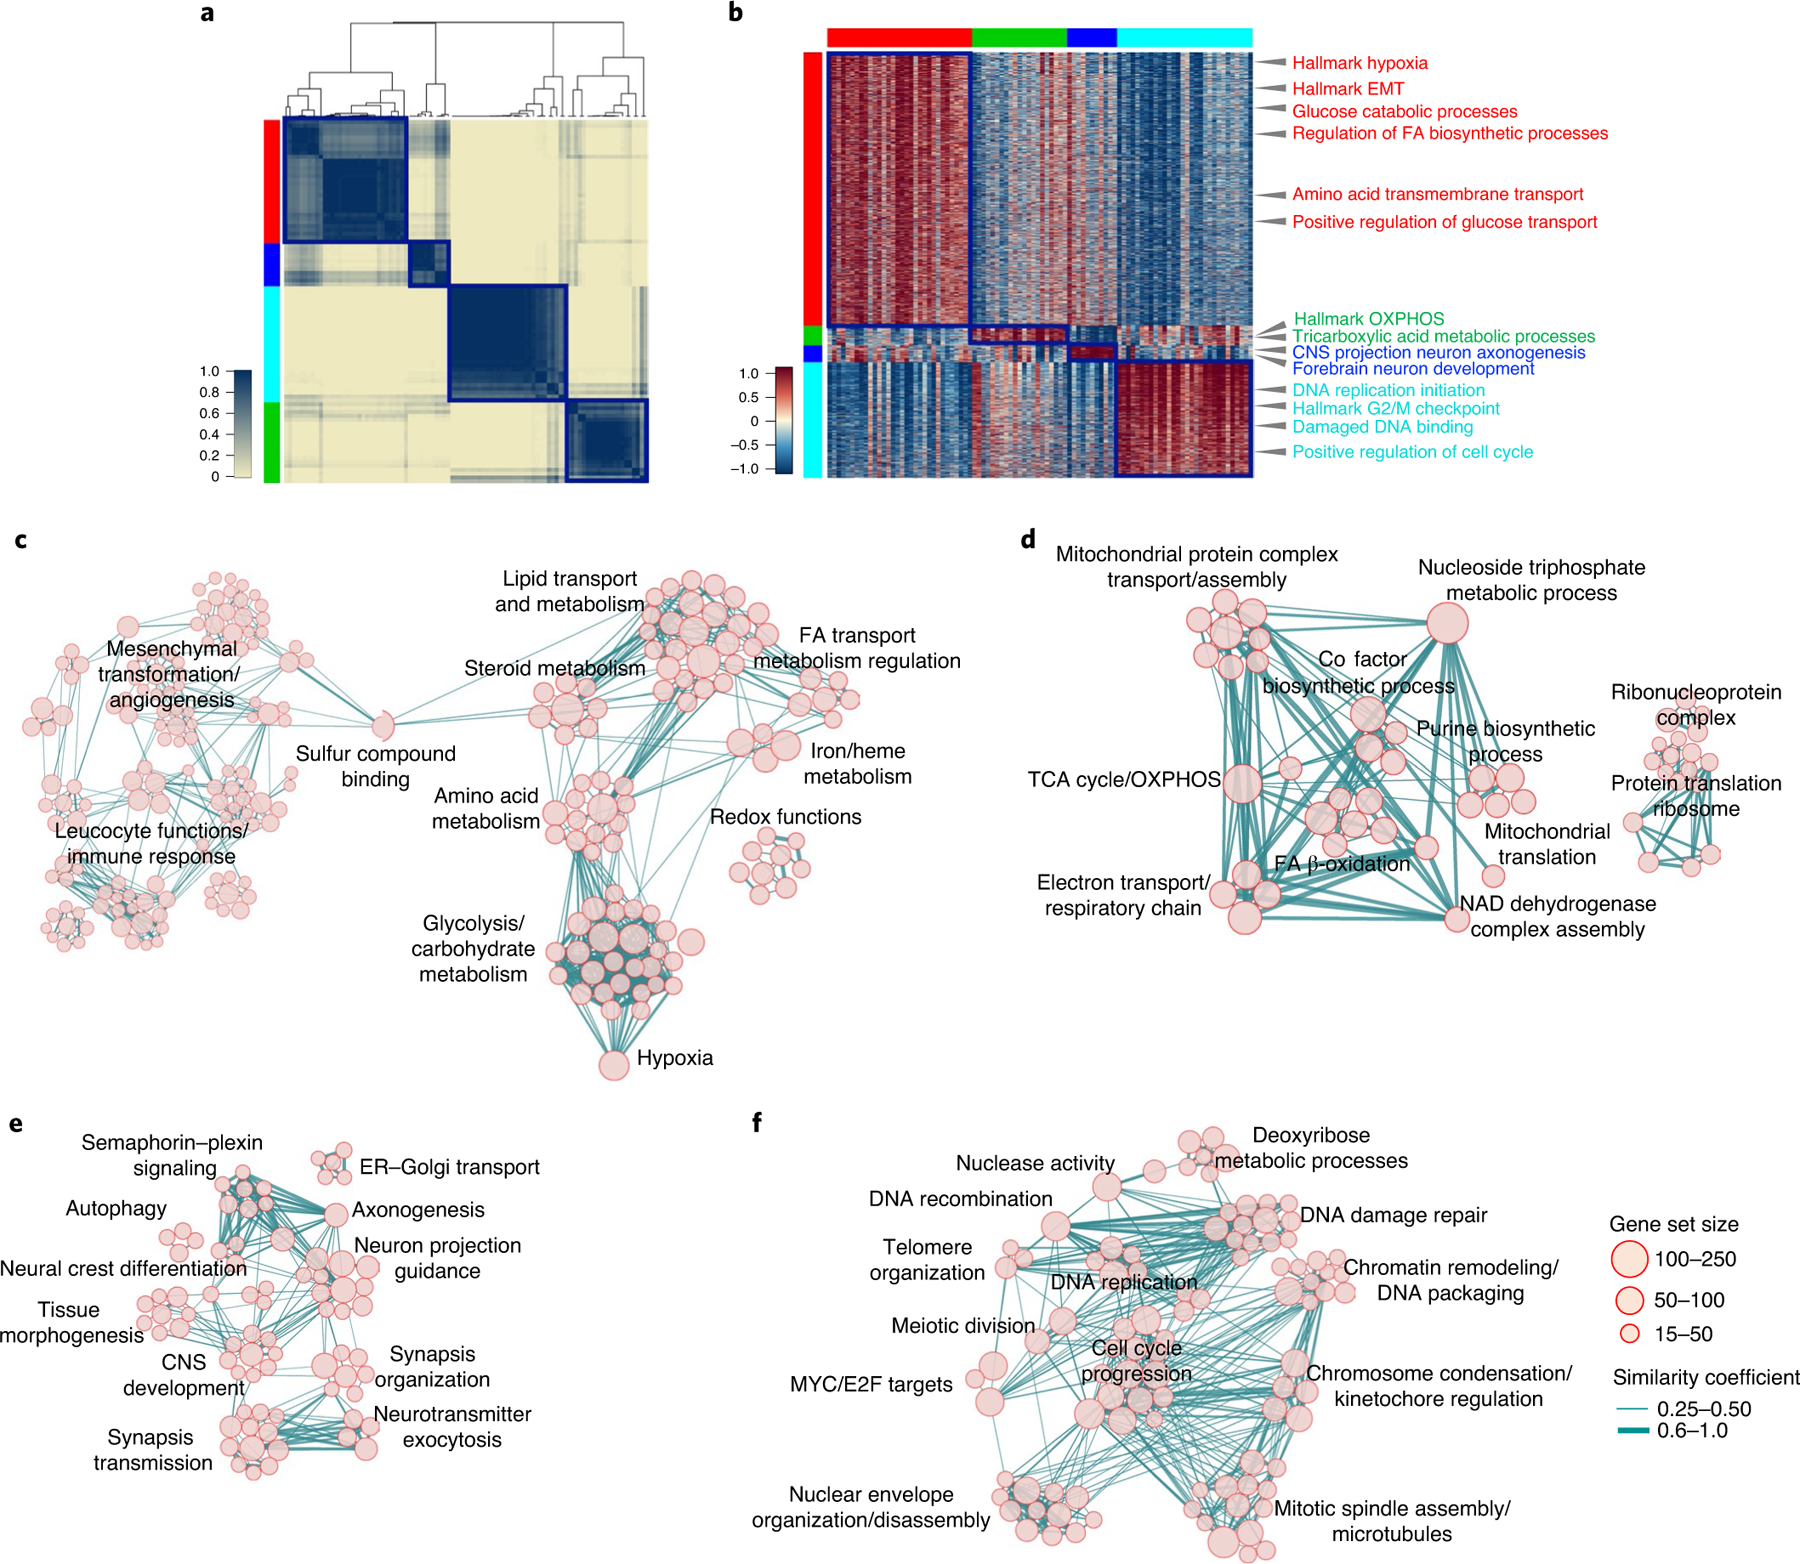
a, Consensus clustering generated from clusters of 94 single-cell subpopulations from 17,367 cells (36 GBM tumors). Columns and rows represent cell subpopulations. Color bar on the left defines four cell clusters. Yellow-to-blue scale indicates low to high similarity. b, Heatmap of biological activities of 94 single-cell sub-populations grouped by common activated pathways (2,533 of 5,032 pathways; effect size >0.3, FDR < 0.0001, two-sided MWW test). Columns represent cell subpopulations; rows are biological activities. Pathway activity levels are color coded. Representative pathways specifically activated in each subtype are indicated. Left and top color bars: red, GPM; green, MTC; blue, NEU; cyan, PPR. c–f, Enrichment map network of statistically significant, nonredundant GO categories (logit(NES) > 0.58, FDR < 0.05, two-sided MWW–GST) in GPM (c), MTC (d), NEU (e) and PPR (f) medoids of each GBM state. c, The right-hand side of the network was magnified 1.5-fold for better visualization of significant activities. Nodes represent gene ontology (GO) terms and lines their connectivity. Node size is proportional to the number of genes in the GO category, with range indicated by keys and line thickness indicating similarity coefficient. EMT, epithelial–mesenchymal transition; FA, fatty acids; CNS, central nervous system; ER, endoplasmic reticulum; TCA, tricarboxylic acid; nc, not classified.
Fig. 3 |. Classification of primary human GBM and clinical validation.
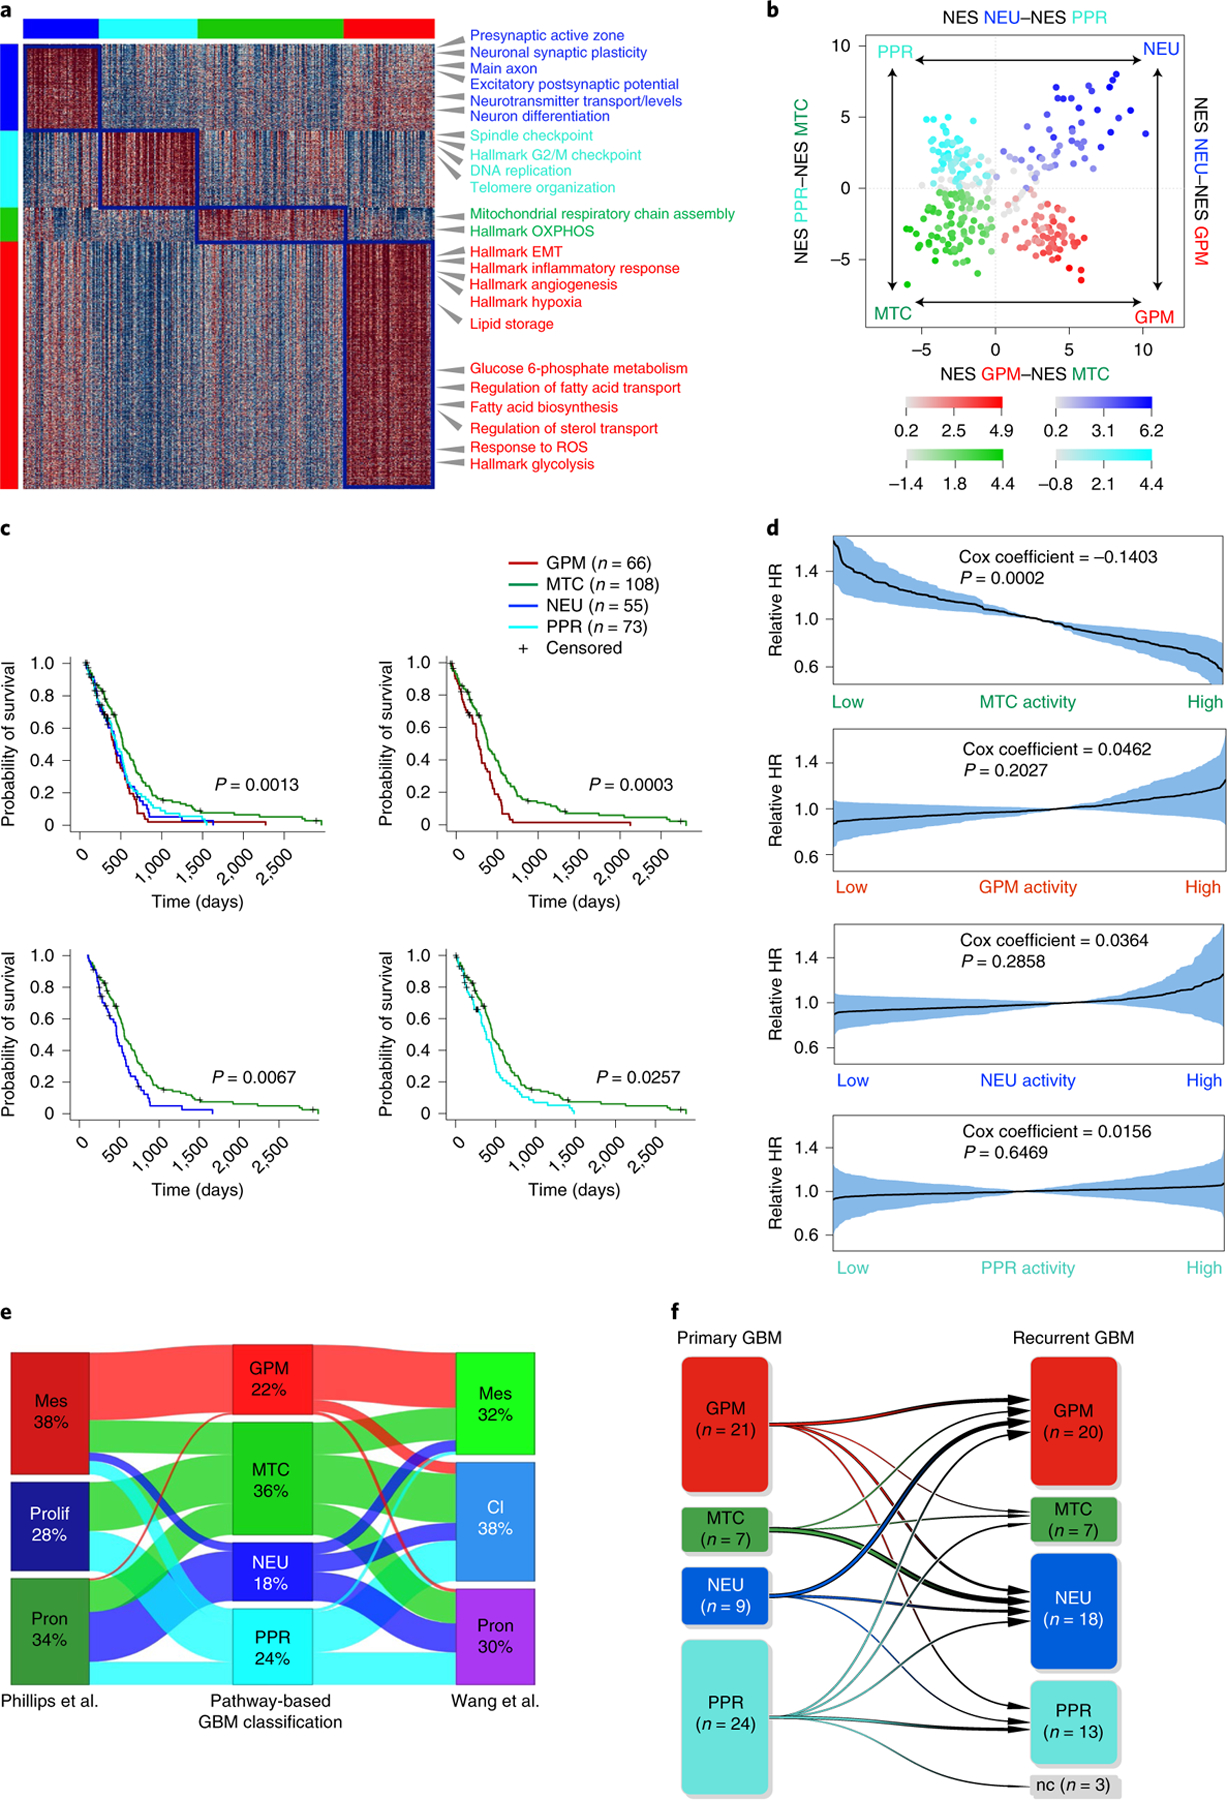
a, Heatmap of pathway activity in 304 GBM tumors using 2,792 of 5,032 pathways, showing differential activity in the four GBM subtypes (effect size >0.3 and FDR < 0.01, two-sided MWW test). Columns represent tumors; rows are pathway activities. Representative pathways specifically activated in each GBM subtype are indicated. Left and top color bars: red, GPM; green, MTC; blue, NEU; cyan, PPR. b, Two-dimensional plot of GBM subtype enrichment scores (n = 304 tumors). Each quadrant corresponds to one GBM subtype, and the position of dots (tumors) reflects the relative subtype-specific NES of each tumor as indicated on the x and y axes; color intensity reflects NES value. Tumors that do not fall within the corresponding subtype quadrant are colored gray. c, Kaplan–Meier curves of 302 patients with GBM stratified according to the four biological classes. Patients in the MTC subgroup exhibit significantly longer survival (log-rank test). d, Relative HR of 302 patients with GBM estimated by Cox’s proportional hazards model, including the activity of MTC, GPM, NEU and PPR as the covariate (shaded areas represent 95% CI). e, Sankey diagram of GBM subtype assignment (n = 304 tumors) according to either pathway-based or previously published classifications: left, Phillips et al.11; right, Wang et al.3. f, Functional subtyping of primary and recurrent GBM (n = 61 tumor pairs). The transition plot of primary and recurrent GBM subtypes shows an increased frequency of the NEU subtype at recurrence (P = 0.05, χ2 test). The number of GBM in each class at diagnosis and recurrence is indicated, and variations between primary and recurrent samples are represented by arrows. Mes, mesenchymal; prolif, proliferative; pron, proneural; cl, classical; nc, nonclassified.
Next, we determined the stability of cell states within each of the 36 tumors by computing the fraction of cells assigned to each state. Although each tumor contained four or three different cell states (Extended Data Fig. 2e and Supplementary Table 5), most expressed a dominant state together with variable, smaller cell fractions corresponding to different states. The estimation of the frequency of coexistence of cell states within individual tumors showed two distinct patterns characterized by the preferential coexistence of GPM with MTC cells and PPR with NEU cells, respectively (Fig. 2a,b and Extended Data Fig. 2f).
Fig. 2 |. Glioma cell states converge on metabolic and neurodevelopmental axes.
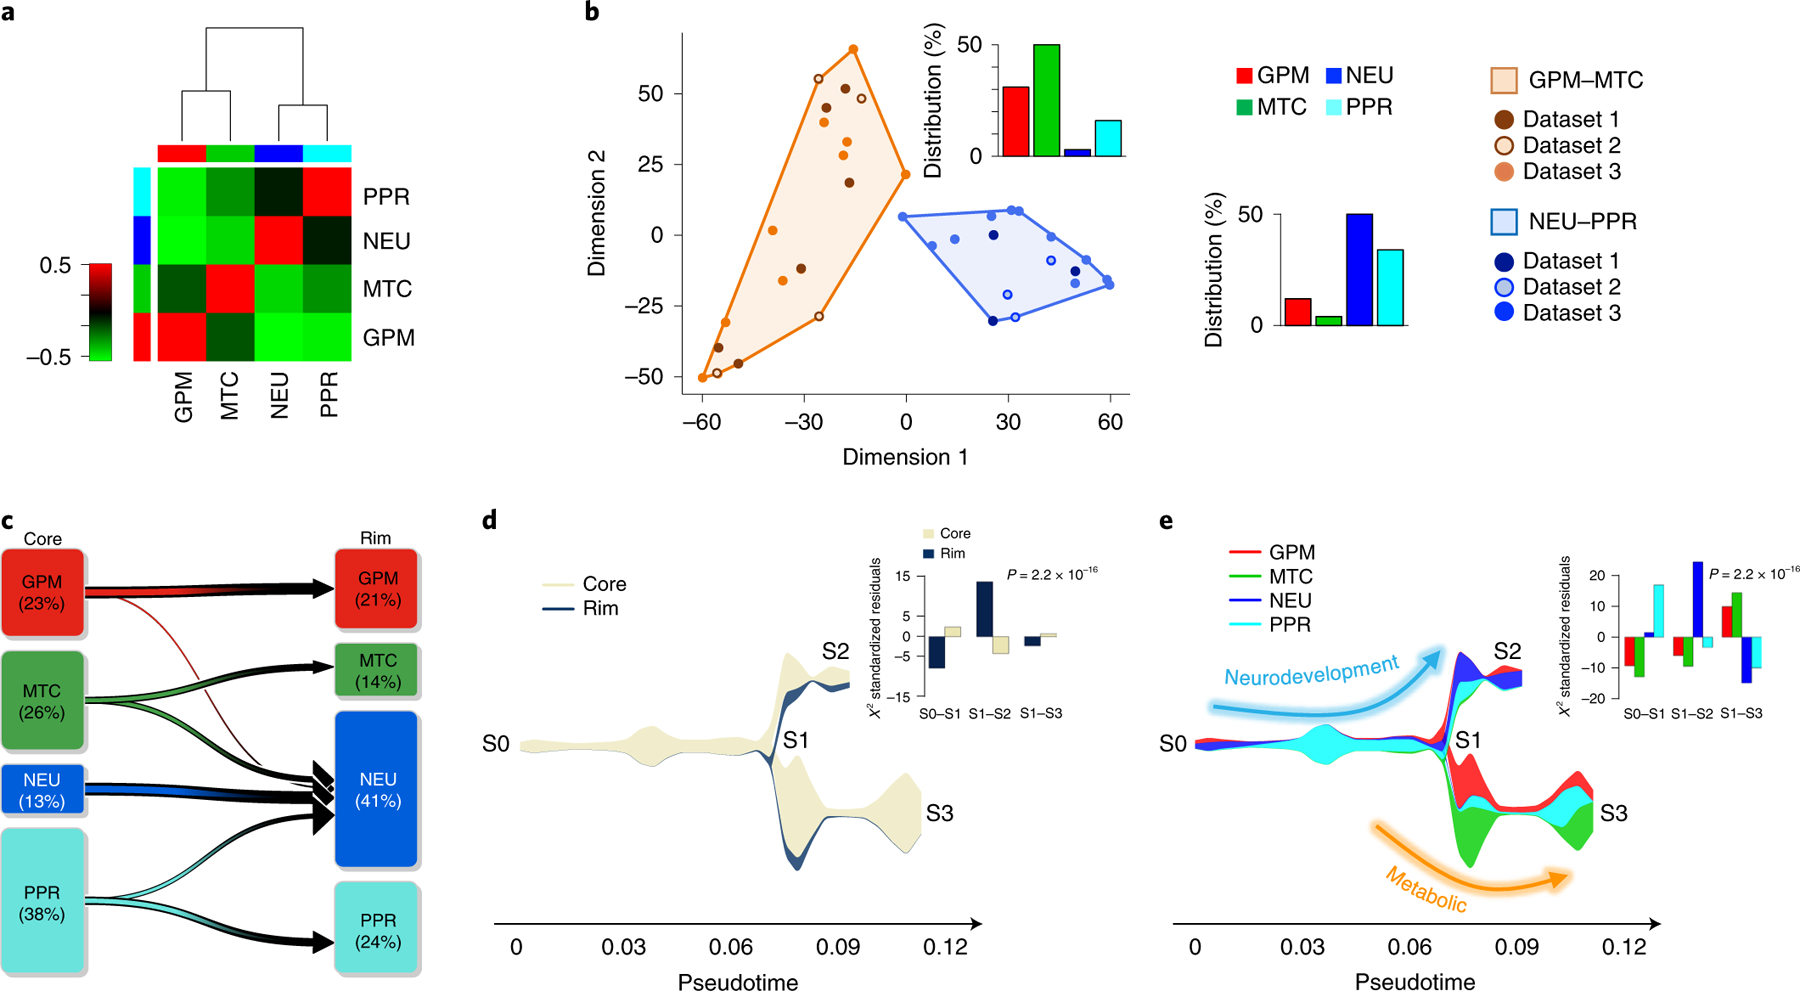
a, Spearman’s correlation of GBM cell states within individual tumors. Rows and columns represent GBM cell states. The green-to-red scale indicates negative to positive correlation. Left and top color bars: red, GPM; green, MTC; blue, NEU; cyan, PPR. b, Multidimensional scaling of cellstate frequency in 36 tumors, discriminating two clusters according to similarity: GPM–MTC (orange) and NEU–PPR (blue). Bar plots: frequency distribution of cell states in each cluster. c, The percentage of cells in each subclass at the tumor core and periphery is indicated, and the variation between core and rim is represented by arrows. NEU cells are enriched at the rim (n = 2,799 cells; P = 2.2 × 10⁻¹⁶, χ2 test). d, Stream plot showing cell density at tumor core and periphery from samples in c. The thickness of each branch is proportional to the number of cells in the branch. Bar plot, significant enrichment of cells from tumor periphery in branch S1–S2 (n = 2,799 cells; P = 2.2 × 10⁻¹⁶, χ2 test). e, Stream plot showing subclasses of cells at tumor core and rim. Bar plot, significant enrichment of NEU cells at the tumor periphery (n = 2,799 cells; P = 2.2 × 10⁻¹⁶, χ2 test). Arrows depict two largely independent branches of cell states, NEU–PPR (neurodevelopment) and GPM–MTC (metabolic).
To determine whether biological branches are spatially segregated within glioma tumors, we analyzed 33 tumor core samples and 14 matched invasive rims obtained by precision navigation surgery from nine patients in dataset 1 (Supplementary Table 1a). The percentage of glioma cells with NEU features increased from 13 to 41 in the peripheral areas of the tumor, whereas PPR and MTC cells decreased (Fig. 2c). By tracing the evolutionary path of the four biological glioma states at tumor core and rim with the STREAM algorithm10, we obtained two fundamental axes characterized by neurodevelopmental PPR and NEU (S0–S2) and metabolic MTC and GPM states (S1–S3), respectively (Fig. 2d,e). The neurodevelopmental axis exhibited an evolutionary trajectory defined by a branch enriched in core-derived PPR cells (S0–S1; Fig. 2d,e) expressing cell cycle genes (CCNE2, CDK1 and CDK2; Extended Data Fig. 2g) and the transcriptional program of intermediate progenitor cells (EOMES, EMX1 and SSTR2) intermingled with NEU cells expressing markers of newly born neurons (TBR1; Extended Data Fig. 2h). Conversely, the tract enriched in rim-derived cells (S1–S2; Fig. 2d,e) consisted of more mature NEU cells expressing markers of specialized neuronal functions (LRRC4/NGL2, SATB1, GABRB3 and CHRNA4; Extended Data Fig. 2i). The lack of expression of CCNE2 and other cell cycle genes in TBR1-positive cells from core- and rim-enriched mature NEU cells indicates that, regardless of the differentiation stage, NEU are mostly nonproliferating cells (Extended Data Fig. 2g–i).
Pathway-based classification of GBM recapitulates single-cell states with the mitochondrial subtype exhibiting better survival
We designed a pathway-level analysis that could cluster primary GBM on the basis of shared pathways associated with clinical outcome. Using 534 IDH wild-type GBM from the Cancer Genome Atlas (TCGA) and the single-sample Mann–Whitney–Wilcoxon gene set test (ssMWW–GST; Supplementary Note), we selected 192 of 5,032 pathways whose activity (increased or decreased) was significantly associated with patient survival (P < 0.05, log-rank test; Supplementary Table 6a,b). By the application of scBiPaD to single-cell datasets (Extended Data Fig. 3a–f and Supplementary Table 7), we confirmed that this reduced configuration of biological activities captured the dominant cell states with 92% concordance when compared with the analysis of 5,032 pathways (Extended Data Fig. 4a–f). Next, we classified 534 primary GBM by building a consensus clustering on pathway enrichment score (Extended Data Fig. 5a and Supplementary Table 6c). We obtained four GBM subgroups that included 304 tumors (62% of the cohort) defined by differentially active, survival-associated pathways (Extended Data Fig. 5b and Supplementary Table 6d). The biological functions of each of the four sets of pathways recapitulated the activities identified by single-cell analysis, including NEU (blue), PPR (cyan), MTC (green) and GPM (red) (Fig. 3a and Supplementary Table 6e). Consistently, genes upregulated in each cluster were markers and effectors of the highlighted biological activities, including neurotransmitter receptors and neural stem/progenitor cell markers for NEU and PPR single-cell states, respectively (Extended Data Fig. 5c–f and Supplementary Tables 6f–j and 8a,b). To evaluate the strength of the dominant state in bulk tumors, we computed a ‘simplicity score’ for each sample as a continuous measure of the strength of the state3 within a four-quadrant plot corresponding to the four transcriptomic states (Extended Data Fig. 5g). The coherent quadrant/state clustering of tumors, colored according to enrichment of the prevalent subtype, indicated that the analysis captured the dominant biological feature from the bulk GBM transcriptome (Fig. 3b).
To determine the impact of the pathway-based classification on clinical outcome, we used several parameters. First, Kaplan–Meier estimation and log-rank testing showed significantly better survival for MTC GBM, either when all four subgroups were included in the analysis or in pairwise comparison (Fig. 3c). Second, Cox proportional hazards models including MTC, GPM, NEU and PPR activities as independent continuous covariates showed that the only significant variable that predicted survival was MTC, with increasing activity estimating a decreasing risk of death (hazard ratio (HR) = 0.87, Cox coefficient = −0.14, P = 0.0002; Fig. 3d). All other transcriptomic activities exhibited a trend for higher risk of death, without reaching statistical significance. Third, in a multivariate analysis, the impact of MTC state on survival was independent of age, gender and O-6-methyl guanine-DNA methyl transferase (MGMT) methylation, factors that affect survival of patients with IDH wild-type GBM (Supplementary Table 9a,b). We also failed to find significant associations between the transcriptional subtypes and clinical and molecular characteristics of GBM (Supplementary Table 9c). Using a 50-gene signature obtained from the ranked list of each bulk GBM subtype, we confirmed the four-group classification and the more favorable clinical outcome of MTC GBM in three additional GBM datasets (Extended Data Fig. 6a–f and Supplementary Table 10a–c).
To assess the intersection of the pathway-based classification with the two existing and widely used GBM classifiers3,11, we compared subclass assignment of 304 GBM from TCGA using each of the three classifiers (Supplementary Table 10d). The two previously established classifications recognized three groups named after signature genes, including mesenchymal and proneural subtypes, but they differ in the attribution of the third group as proliferative in the classification of Phillips et al.11, and classical in the classifier by Wang et al.3. The MTC subtype uncovered by the pathway-based classification was orthogonally distributed across the three subgroups, suggesting that OXPHOS programs are not restricted to a specific cell identity (Fig. 3e and Supplementary Table 10e). We also found a positive association between the mesenchymal subgroups of both classifications and the GPM subgroup, suggesting that mesenchymal identity and GPM activity are inseparable features in GBM. Proneural and proliferative, and proneural and classical, subtypes of the two classifications incorporated similar fractions of NEU and PPR, respectively. NEU and PPR were mostly excluded from the mesenchymal groups. In contrast to the pathway-based classifier, neither classification captured differences in survival in the TCGA IDH wild-type GBM cohorts (Extended Data Fig. 6g–j).
To determine whether the transcriptomic state of tumor cells affects the extent and/or composition of the tumor microenvironment (TME), we inferred the fraction of stromal/immune cells and consequently tumor cell purity by applying ABSOLUTE12. GPM GBM had the lowest tumor purity followed, in increasing order, by NEU, MTC and PPR (Extended Data Fig. 7a). Next, we used scRNA-seq data to characterize the cellular components of the TME in each GBM subtype13–15. GPM was marginally associated with macrophage and neutrophil infiltration, while the PPR subtype was associated with the presence of oligodendrocytes (Extended Data Fig. 7b). To determine whether tumors exhibiting high glycolytic or OXPHOS activity differ in the extent of infiltration of macrophages and microglia, the predominant nonmalignant cells in the glioma TME7,16, we scored myeloid cells for the relative expression of macrophage- and microglia-specific genes in four samples from dataset 1, two containing >75% GPM tumor cells (S4_D1 and S12_D1) and two predominantly composed of MTC tumor cells (S1_D1 and S5_D1; Extended Data Fig. 7c and Supplementary Table 5). Consistent with previous findings7,16, the two cell types presented a continuum distribution. However, macrophage-like cells were mainly restricted to the GPM TME whereas the less abundant MTC TME was enriched in microglia-like cells.
Finally, to rationalize the biological variations imposed by tumor progression, we examined 61 matched primary and recurrent GBM17 (Supplementary Table 11a). The evolutionary trajectory of recurrent GBM was marked by a reduction in PPR (from 39 to 21%) and gain of NEU states (from 15 to 29.5%; Fig. 3f). Moreover, recurrent NEU GBMs had a significantly higher neuronal NES than primary NEU (3.59 ± 1.74 and 1.80 ± 1.15 in recurrent and primary tumors, respectively; P = 0.005, two-sided MWW test; Supplementary Table 11b) and a stronger enrichment in synaptic activities (1.60 ± 0.39 and 1.42 ± 0.36 in recurrent and primary tumors, respectively; P = 0.00005, two-sided MWW test; Supplementary Table 11c), implicating glioma cells with features of advanced neuronal differentiation in tumor progression.
Biologically coordinated multiomics features are associated with GBM subgroups
To establish the genomic alterations that drive each GBM subtype, we selected copy number variations (CNVs) that impact gene expression in cis (functional CNV, fCNV; Supplementary Note) and somatic pathogenic single-nucleotide variations (SNVs)18 and integrated fCNVs and SNVs. The analysis of association between genetic alterations of established GBM driver genes and the four subtypes showed that the GPM subgroup was enriched in deletions and mutations of PTEN, RB1 and NF1, and amplification of MDM4 (Extended Data Fig. 7d). Mutations of NRAS were exclusive of the MTC subgroup, and amplifications of CDK4/MDM2 were more frequent in this subgroup. ATRX and TET1 mutations were associated with the NEU subtype. Finally, the PPR subtype was associated with amplifications and mutations of PDGFRA and EZH2. Amplification and mutations of EGFR were more frequent in subtypes MTC and PPR.
Beside GBM drivers, each subtype harbored a specific repertoire of fCNVs and SNVs, largely composed of alterations of biologically coherent genes (Fig. 4a and Supplementary Table 12). Besides fCN gain of the stem/progenitor cell drivers PDGFRA and EZH2, the PPR group was enriched in amplification of activators of cell cycle and mitotic progression (PCNA, SKP2, AURKA and PLK4). Conversely, the NEU subtype was enriched in fCN gain of genes involved in either neuronal cell fate (NEUROD6) or coding for neurotransmitter receptors (GABRR2 and HTR5A). It also harbored fCN loss of genes that normally function in the prevention of neuronal differentiation (HES2 and PAX7). GPM and MTC subgroups exhibited enrichment in biologically antagonistic genetic alterations (Fig. 4a,b). Thus, GPM GBM harbored fCN gain of genes implicated in glycolysis and carbohydrate metabolism, lipid storage and metabolism and amino acid and reactive oxygen species (ROS) metabolism, and of genes in the hypoxia response pathway, while genes associated with similar metabolic activities were selected as fCN loss in the MTC subtype. In contrast, fCN gain in MTC GBM was enriched in OXPHOS and mitochondrial functions, but genes in these categories harbored fCN loss in GPM GBM (Fig. 4b). Some of the genes harboring recurrent and divergent genetic alterations in the GPM and MTC subgroups are candidate drivers of the respective metabolic phenotypes. Notable examples include NAMPT and HGF (fCN gain), TFAM (fCN loss) and PPARGC1A (fCN loss and mutation) in GPM GBM; and SDHB, NDUFA2, NDUFA5, UQCRFS1 (fCN gain), ENO1, H6PD, SLC16A3/MCT4, XBP1 (fCN loss) and PFKP (fCN loss and mutation) in mitochondrial GBM (Fig. 4a). The contrasting biology of the GPM and MTC states emerged also from a focused analysis of MTC and GPM subgroups, showing that maximal activity of MTC signature was associated with mimimal GPM signature activity (Spearman correlation ρ = −0.6, P = 2.2 × 10⁻¹⁶; Fig. 4c and Supplementary Table 13a), reciprocal fCN gain of mitochondrial and fCN loss of glycolytic genes (Fig. 4c and Supplementary Table 13b) and better clinical outcome (Fig. 4c). Conversely, the maximal activity of genetic GPM signature was associated with mimimal MTC signature activity, reciprocal fCN gain of GPM and fCN loss of MTC genes and shortest survival (Fig. 4c).
Fig. 4 |. Reciprocal MTC and GPM activities are associated with coherent gain- and loss-of-function genetic alterations and predict risk of failure.
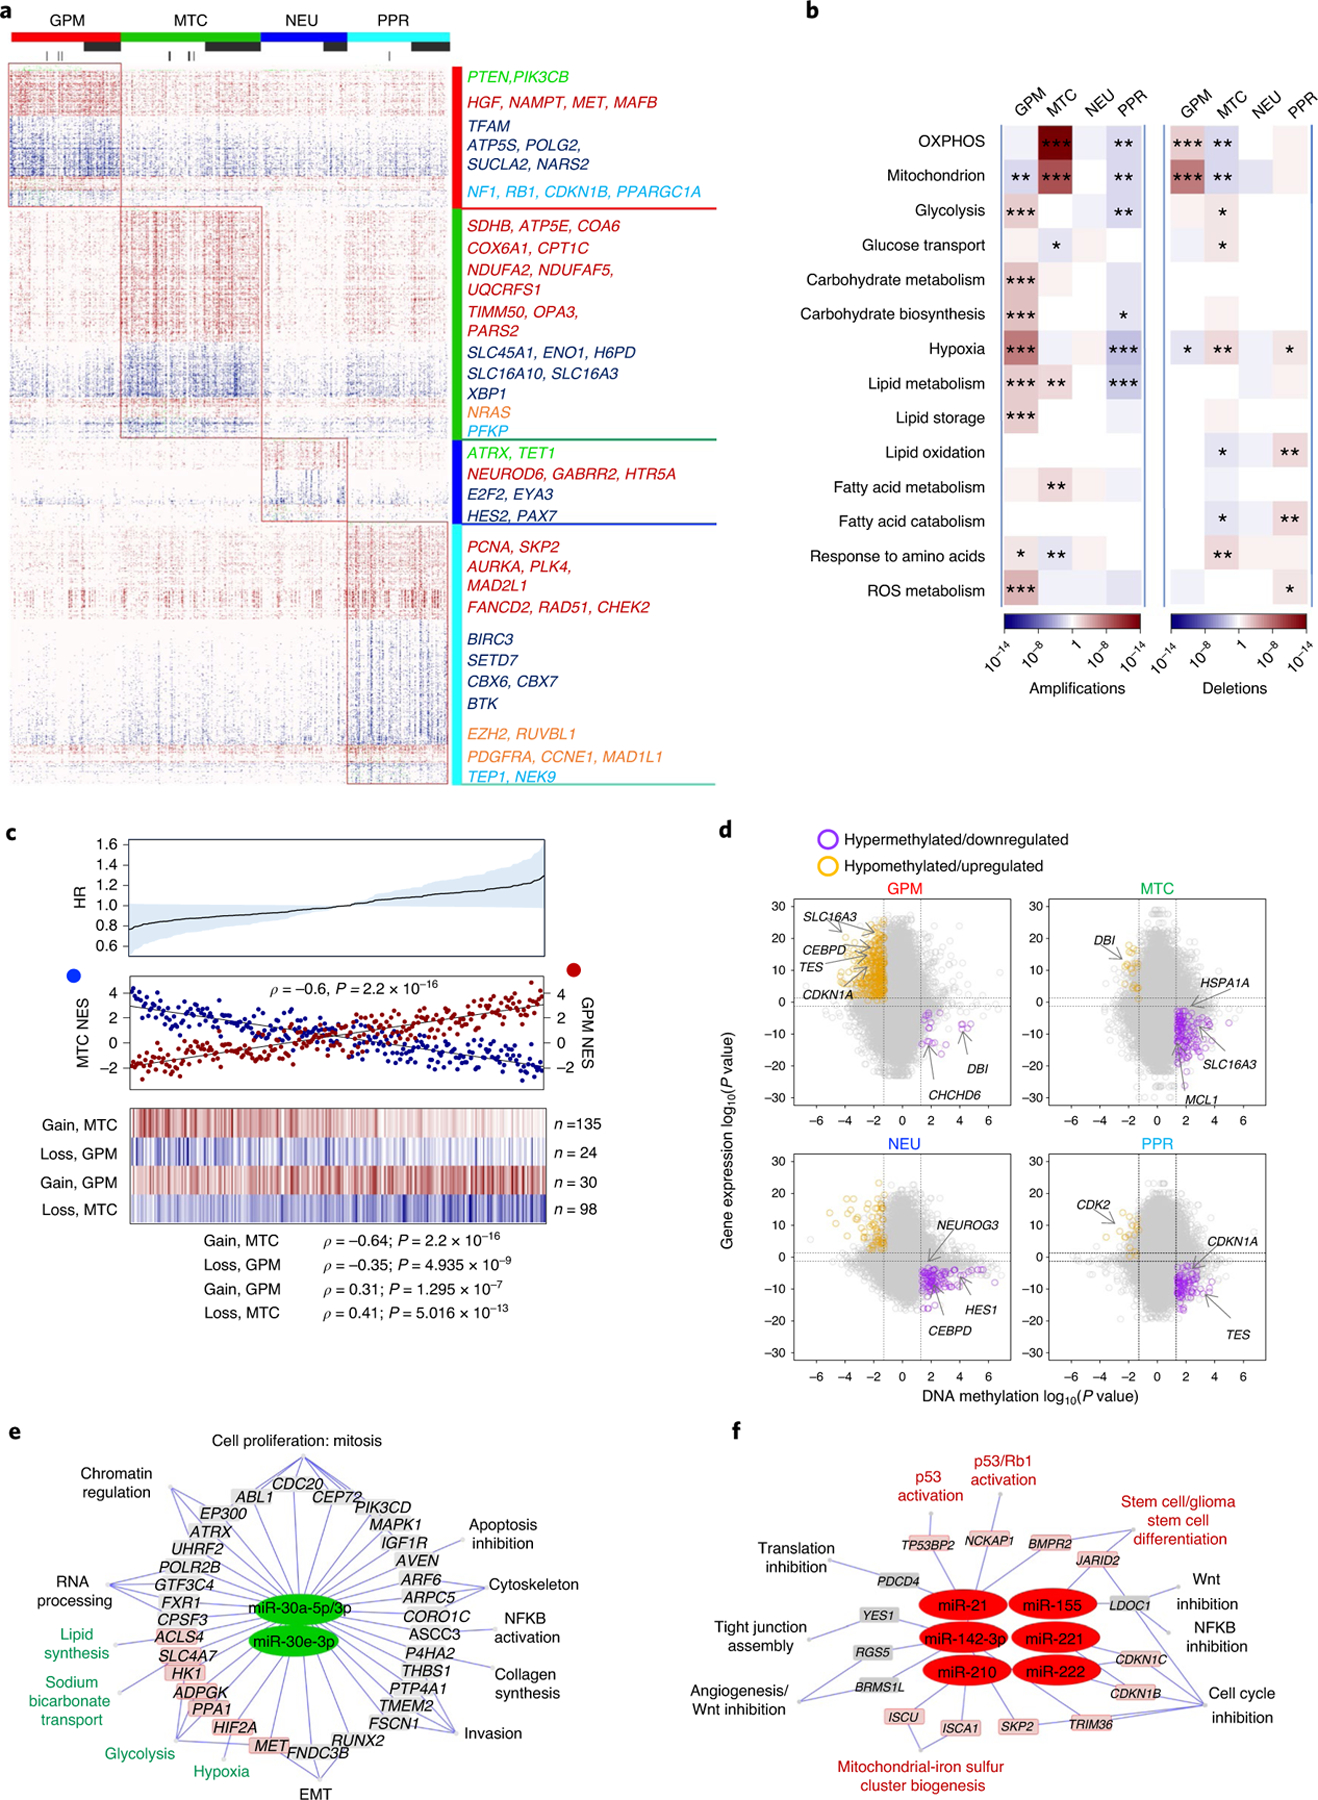
a, Mutations and/or CNVs significantly associated with GBM subclasses (n = 496 tumors); P < 0.05, two-sided Fisher’s exact and χ2 test; P values of individual genes are reported in Supplementary Table 12b–u). Columns represent tumors and rows are genes. Horizontal top and vertical color bars: GBM subtypes; horizontal middle and bottom bars: white and gray, samples with or without mutation (middle) or CNV (bottom) data, respectively. Representative gene alterations specific to each GBM subtype are indicated by color: green, mutation; red, amplification; blue, deletion; orange, mutation/amplification; cyan, mutation/deletion. b, Metabolic pathway enrichment analysis of amplifications (left) and deletions (right) in GBM subtypes. Red-to-blue scale, positive to negative enrichment (P value) of gene alterations in the pathway; *P < 0.10, **P < 0.05, ***P < 0.01, two-sided Fisher’s exact test. c, Top: HR for patients with GBM according to Cox’s proportional hazards model, testing the difference between GPM and MTC activities as the covariate (n = 273 tumors, P = 0.05; shaded area represents 95% CI). Middle: correlation analysis of MTC (blue) and GPM (red) activities in individual GBM (n = 273 tumors, Spearman’s correlation, ρ = −0.6, P = 2.2 × 10⁻¹⁶). Bottom: fCNV gain and loss of mitochondrial- and glycolytic-related genes in MTC GBM and GPM GBM. The number of genes amplified/deleted in each tumor is color coded (amplifications, red to white; deletions, blue to white). In all panels, n = 153 MTC and n = 120 GPM tumors. d, Starburst plots comparing DNA methylation and gene expression for 10,337 unique genes. Dashed lines indicate P = 0.01 (n = 59 tumors, two-sided MWW test). The bottom right and top left areas of each plot include genes significantly hypermethylated and downregulated (purple) or hypomethylated and upregulated (orange), respectively, in the specific subtype. e,f, Micro RNA gene target networks were significantly changed in subtypes MTC (e, green nodes) and GPM (f, red nodes) (n = 294 tumors; log2(fold change (FC)) > 0, P < 0.0005, two-sided MWW test). For each miRNA, we report targets whose expression was anticorrelated with miRNA expression (n = 294 tumors; Spearman’s correlation, ρ < 0 and P < 0.05). Highlighted are miRNA targets of interest regarding the biology of subtypes MTC and GPM GBM. P values for miRNAs and targets are included in Supplementary Table 14c. NFKB, nuclear factor kappa B; Wnt, wingless-related integration site.
To determine the impact of DNA methylation, we analyzed TCGA GBM samples profiled with the 450k DNA methylation array. The four GBM subtypes were associated with distinct DNA methylation clusters exhibiting differential methylation of regulatory promoter sequences (Extended Data Fig. 8a and Supplementary Table 14a) and subgroup-specific DNA hypermethylation and transcriptional repression in promoters of genes linked to the functional activity of the groups (Fig. 4d and Supplementary Table 14b).
We also identified subgroup-specific miRNAs (Extended Data Fig. 8b and Supplementary Table 14c) and functional miRNA targets (Spearman, ρ < 0 and P < 0.05; Supplementary Table 14d). MTC GBM exhibited activation of the miR-30 family of miRNAs (miR-30a-5p/3p and miR-30e-3p), which inhibit glycolysis, the Warburg effect and lipogenesis and promote mitochondrial respiration (Fig. 4e)19–21. Conversely, the GPM subtype overexpressed miR-210 and miR-21 and downregulated their target genes (Fig. 4f), promoting stress adaptation and suppression of mitochondrial respiration22,23 and inhibiting p53 and mitochondrial apoptosis tumor suppressor pathways24, respectively. miR-17–3p and miR-17–5p emerged as regulators of the PPR subtype supporting stemness and cell proliferation by suppression of PTEN and p21 (ref. 25), whereas miR-137, a brain-enriched miRNA with critical functions in neural development and differentiation26, was activated in the NEU subtype (Extended Data Fig. 8c,d).
Finally, we explored the reverse-phase protein array (RPPA) platform of TCGA GBM (Supplementary Table 14e). The transcription factor proteins XBP1 (ref. 27) and TAZ28, which enhance glycolysis and metabolism of glutamine and lipids, were highly expressed in GPM GBM (Extended Data Fig. 8e); BAX29, master regulator (MR) of mitochondrial-mediated apoptosis, accumulated in MTC (Extended Data Fig. 8f); KIT30, a receptor with essential functions in neurogenesis, in NEU (Extended Data Fig. 8g); cyclin B1 (ref. 31) (CCNB1), the key cyclin regulator of mitosis, and FOXM1 (ref. 32), driver of stemness of neural and glioma stem cells, in the PPR subtype (Extended Data Fig. 8h).
Metabolic GBM subtypes have divergent mitochondrial, glucose, glutamine and lipid metabolism
We asked whether the classification of single cells and primary GBM could also be applied to a cohort of patient-derived cellular (PDC) models of GBM. By using a random forest machine learning classifier33, PDCs partitioned into four groups, each exhibiting enrichment of the corresponding GBM subgroup signature (Extended Data Fig. 9a and Supplementary Table 15a–c), coherent pathway activation (Extended Data Fig. 9a) and expression of specific marker genes (Extended Data Fig. 9a). We used MTC and GPM GBM PDCs to experimentally test the metabolic state of these cells using multiple metabolic metrics. MTC PDCs exhibited higher basal, ATP-linked and maximal oxygen consumption rate (OCR) compared with GPM PDCs (Fig. 5a and Extended Data Fig. 9b). Conversely, basal glycolysis, as indicated by the extracellular acidification rate (ECAR) after glucose addition, was 2.5-fold higher in GPM than in MTC PDCs (Fig. 5b and Extended Data Fig. 9c). Consequently, MTC PDCs had an OCR/ECAR ratio >3.5-fold higher compared to GPM PDCs (Fig. 5c). GPM PDCs had a sixfold higher rate of glucose uptake and tenfold higher production of lactate than MTC (P = 0.0028 for glucose uptake, P = 0.0020 for lactate production; Fig. 5d,e). Glutamine is one of the most important nutrients utilized by cancer cells in the supply of carbon and reduction of nitrogen for biosynthetic reactions and redox homeostasis34, and expression of the major glutamine membrane transporter SLC1A5 was higher in primary GBM and PDC GPM than in MTC (Extended Data Fig. 9d,e). Accordingly, estimation of glutamine consumption was higher in GPM than MTC PDCs (5.3-fold, P = 0.000002; Fig. 5f).
Fig. 5 |. Divergent metabolic activities support MTC and GPM PDC subtypes.
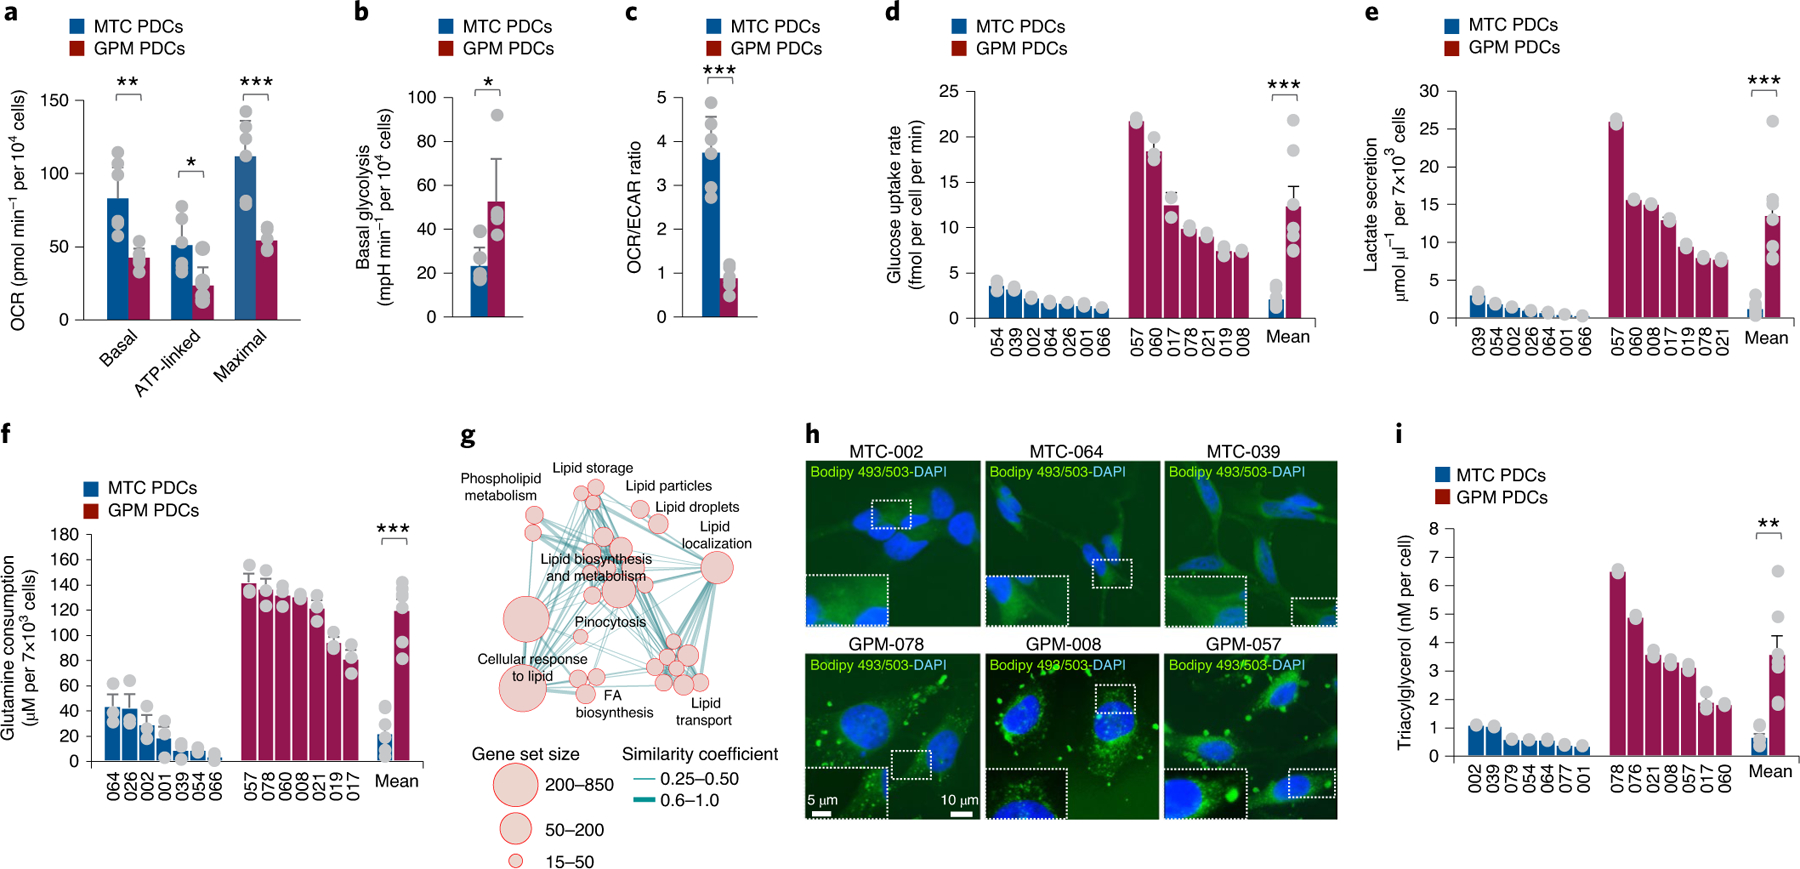
a, Basal, ATP-linked and maximal OCR in MTC and GPM PDCs. Data are mean ± s.d. of one representative experiment, including n = 6 MTC PDCs, each derived from an independent patient, and n = 6 GPM PDCs, each derived from an independent patient; *P = 0.0165 for ATP-linked OCR, **P = 0.0063 for basal OCR and ***P = 0.0024 for maximal OCR. b, Basal glycolysis in MTC and GPM PDCs. Data are mean ± s.d. of one representative experiment, including n = 6 MTC PDCs, each derived from an independent patient, and n = 6 GPM PDCs, each derived from an independent patient; *P = 0.0129. mpH, milli-pH. c, OCR/ECAR ratio of MTC and GPM PDCs. Data are mean ± s.d. of one representative experiment, including n = 6 MTC PDCs, each derived from an independent patient, and n = 6 GPM PDCs, each derived from an independent patient; ***P = 0.0002. d, Rate of glucose uptake in MTC and GPM PDCs. Data are mean ± s.d. of n = 3 independent experiments for each PDC, each performed in triplicate. Bars on the right-hand side of the graph indicate mean ± s.e.m. of values observed in the two sets of PDCs; n = 7 MTC PDCs and n = 7 GPM PDCs, each derived from an independent patient; ***P = 0.0028. e, Lactate secretion by MTC and GPM PDCs. Data are mean ± s.d. of n = 3 independent experiments for each PDC, each performed in triplicate. Bars on the right-hand side of the graph indicate mean ± s.e.m. of values observed in the two sets of PDCs; n = 7 MTC PDCs and n = 7 GPM PDCs, each derived from an independent patient; ***P = 0.0020. f, Glutamine consumption by MTC and GPM PDCs. Data are mean ± s.e.m. of n = 3 independent experiments for each PDC, each performed in triplicate. Bars on the right-hand side of the graph indicate mean ± s.e.m. of values observed in the two sets of PDCs; n = 7 MTC PDCs and n = 7 GPM PDCs, each derived from an independent patient; ***P = 0.000002. g, Enrichment map network of statistically significant lipid metabolism-related GO categories (logit(NES) > 0.58 and FDR < 0.05, two-sided MWW–GST) in GPM GBM. Nodes represent GO terms and lines their connectivity. Node size is proportional to the number of genes in the GO category, while line thickness indicates similarity coefficient. h, Microphotographs of MTC (top) and GPM (bottom) PDCs stained by Bodipy 493/503 (green); nuclei were counterstained with DAPI (blue). Insets show higher-magnification images of the outlined areas. i, Concentration of triacylglycerol in MTC and GPM PDCs. Data are mean ± s.d. of n = 3 independent experiments for each PDC, each performed in triplicate. Bars on the right-hand side of the graph indicate mean ± s.e.m. of values observed in the two sets of PDCs; n = 7 MTC PDCs and n = 7 GPM PDCs each derived from an independent patient; **P = 0.0032. a–c, Experiments were assessed with a minimum of four technical replicates for each PDC. Each of these experiments was repeated independently two times with similar results. In all experiments, significance was established by two-tailed t-test, unequal variance (Source data Fig. 5).
Among the most prominent set of interconnected metabolic pathways activated in GPM GBM cells and tumors were lipid metabolic activities, especially lipid synthesis and storage (Fig. 5g and Supplementary Table 15d). In cancer cells, lipid synthesis and storage in lipid droplets that primarily contain triacylglycerides promote survival and growth under adverse conditions35. Thus, we visualized lipid droplets in GPM and MTC PDCs using the lipophilic fluorescent dye BODIPY36 (Fig. 5h) and measured triacylglycerides using a bioluminescent assay (Fig. 5i). Both assays detected much higher triacylglyceride content in GPM than in MTC cells (5.4-fold difference, P = 0.0032; Fig. 5i).
SLC45A1 glucose-proton symporter on chromosome 1p36.23 has tumor suppressor activity in MTC GBM
In addition to the wide spectrum of biologically coordinated genetic alterations driving GBM subtypes, GISTIC2 (ref. 37) analysis performed to identify focal CNVs associated with each subtype revealed that MTC GBM harbored recurrent deletions of chromosome 1p36.23 (Extended Data Fig. 10a and Supplementary Table 16a–d). Chromosome 1p36.23 was also the top-ranking homozygous deletion, including genes with fCNV specifically associated with MTC compared with the other GBM subtypes (Fig. 6a and Supplementary Table 16e). The chromosome 1p36.23 locus harbors several genes with known functions in glucose metabolism (ENO1, CA6, SLC2A5/GLUT5 and SLC2A7/GLUT7) among which the passenger deletion of ENO1 coding for the alpha-enolase glycolytic enzyme was found to generate therapeutic vulnerability in GBM38. To identify tumor suppressor genes driving 1p36.23 deletion in MTC GBM, we scored genes included in the 1p36.23-deleted region of MTC GBM with ComFocal, an algorithm that integrates recurrence with focality (Fig. 6b and Supplementary Table 16f)39 and applied UNCOVER, a computational tool for the identification of genetic alterations associated with cancer phenotypes40 to the MTC profile of primary GBM (Extended Data Fig. 10b). We also used Fisher’s exact test to globally score those genes harboring functional homozygous deletions associated with MTC GBM (Extended Data Fig. 10c and Supplementary Table 16g). The three approaches independently identified SLC45A1 as the top-ranking gene focally and functionally deleted in 1p36.23 in the MTC subtype. Consistently, the minimal 1p36.23 deletion in glioma cell line H502 (ref. 41) encompassed SLC45A1 but did not affect ENO1 (Fig. 6c).
Fig. 6 |. The SLC45A1 glucose-proton symporter on chromosome 1p36.23 has tumor suppressor activity in mitochondrial GBM.
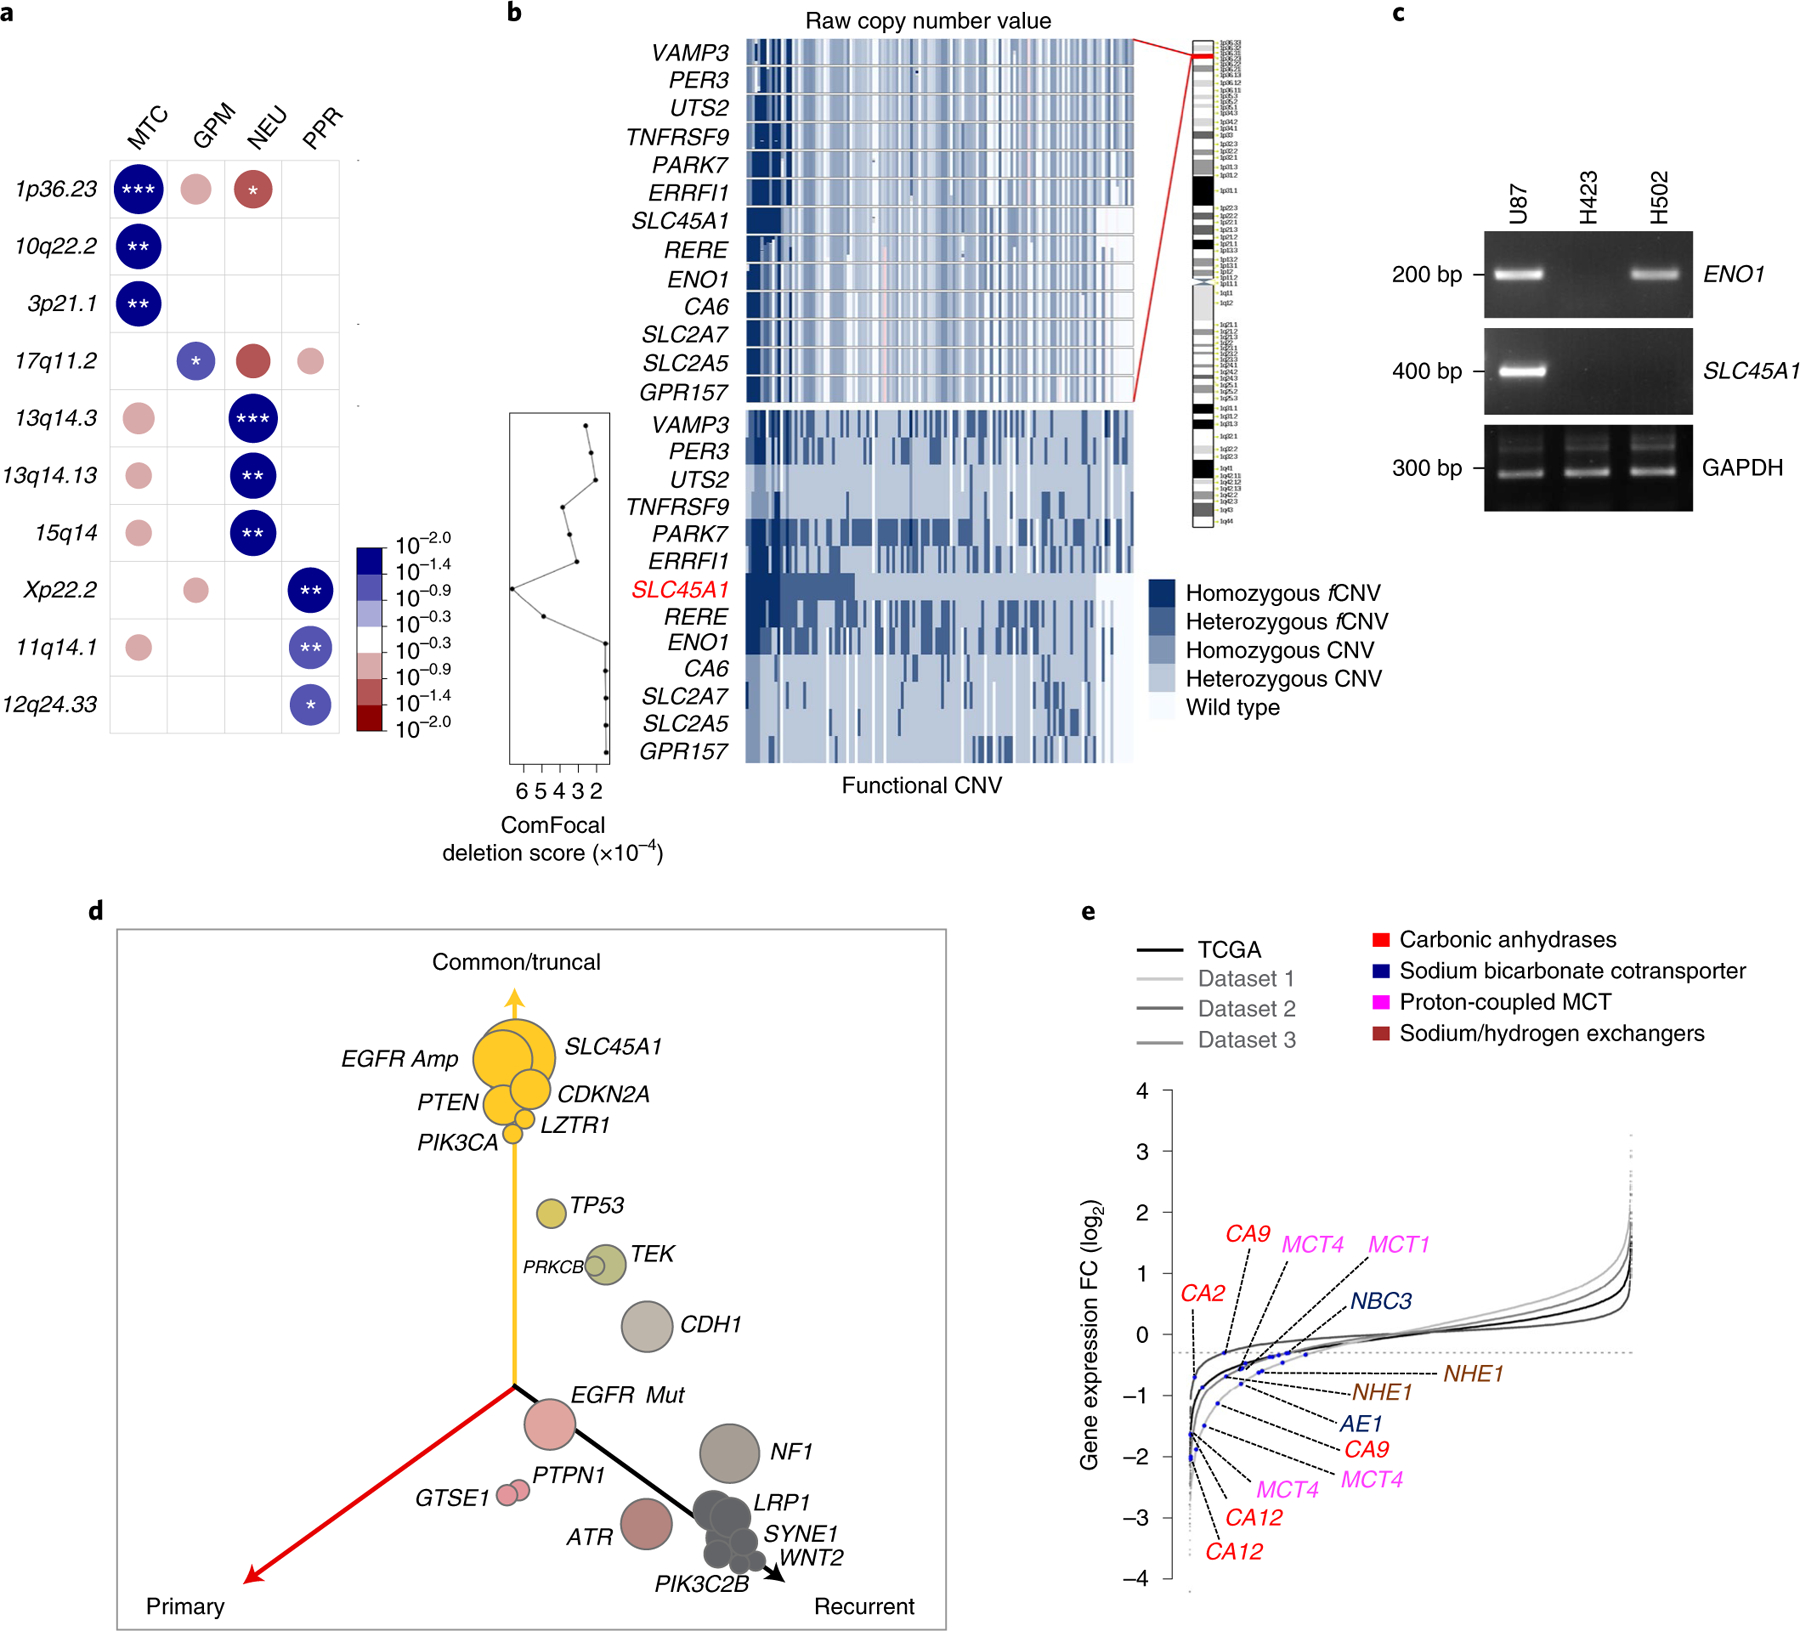
a, Highest-scoring deletions of chromosomal regions significantly associated with GBM subclasses (n = 487 tumors). Circles are color coded and size reflects –log10(P value) of subtype enrichment; *P < 0.10, **P < 0.05, ***P < 0.02, two-sided Fisher’s exact test. P values for individual chromosome bands are reported in Supplementary Table 16e. Blue-to-red scale indicates positive to negative enrichment. b, Top: raw copy number values of genes located on 1p36.23; bottom: homozygous, heterozygous and functional or nonfunctional events colored on a blue scale (lower right). Columns represent samples harboring at least one deleted gene, ordered by SLC45A1 deletion status. Deletion score of each gene by ComFocal (lower left). c, Genomic DNA PCR for ENO1 and SLC45A1 in U87, H423 and H502 cells. GAPDH is shown as control (Source Data Fig. 6). d, Three-dimensional bubble plot showing the frequency of driver genetic alterations in primary and recurrent GBM harboring homozygous deletions of SLC45A1 (n = 8 matched primary and recurrent GBM tumor pairs); left and right axes represent alterations occurring in primary and recurrent tumors, respectively; top axis, alterations shared by both tumors. The size of each bubble is proportional to the number of alterations. e, Rank order plot of genes expressed in MTC versus GPM groups. Genes are ranked from left to right in increasing expression order. Blue dots indicate acid–base transporters differentially downregulated in TCGA GBM and single-cell datasets (n = 175 tumors; n = 1,338 cells from dataset 1; n = 5,604 cells from dataset 2; n = 2,429 cells from dataset 3; log2(FC) < −0.3 and FDR < 0.05, two-sided MWW test). bp, base pairs.
To determine the mutation landscape of SLC45A1-deleted tumors, we integrated genomic data of untreated IDH wild-type GBM from TCGA and GLASS42 and obtained a dataset of 725 tumors, 20 of which harbored homozygous deletion of SLC45A1. We compared the frequency of CNVs and SNVs in GBM driver genes in SLC45A1-deleted with that of SLC45A1 wild-type GBM and found that EGFR, CDKN2A, PTEN, PIK3CA and LZTR1 were more frequently altered in tumors with SLC45A1 deletions, TP53, CDK4, ATRX, PIK3C2B, KIT, RB1 and PDGFRA were targeted less frequently in SLC45A1-deleted GBM whereas NF1 and MDM2 alterations occurred at similar frequency in both groups (Extended Data Fig. 10d). We also tracked the timing of SLC45A1 deletion in GBM evolution by determining the cancer cell fraction (CCF) in GBM harboring homozygous deletions of SLC45A1. SLC45A1 deletions were classified as clonal in each of the 20 tumors analyzed, thus indicating that loss of SLC45A1 is an early event in GBM evolution (Extended Data Fig. 10e). Matched recurrent samples were available from eight of the 20 SLC45A1-deleted GBM, and deletions of SLC45A1 were retained at recurrence (Supplementary Table 16h). To trace the evolutionary trajectory of SLC45A1-deleted GBM and determine the modules of genetic alteration associated with initiation and recurrence, we explored patient evolutionary trees and three-dimensional representation of alterations43. We confirmed that SLC45A1 deletions are truncal and that the truncal module of SLC45A1-deleted GBM included EGFR amplification and alterations of CDKN2A, PTEN, PIK3CA and LZTR1. The genetic alterations that were progressively more specific for recurrent tumors included TP53, TEK, EGFR mutations, NF1, LRP1, ATR and PIK3C2B (Fig. 6d and Extended Data Fig. 10f).
SLC45A1 encodes for a glucose-proton (H+) symporter that is specifically expressed in the central nervous system and transfers glucose and protons into the intracellular space44. Loss-of-function mutations of SLC45A1 lead to a disorder characterized by neurodevelopmental disability due to impaired glucose transport45. In cancer cells, the coupled intracellular proton-glucose transfer by SLC45A1 is predicted to counter the characteristic reversed pH gradient effected by multiple mechanisms of proton efflux that maintain an alkaline cytoplasmic pH46. Most of the genes encoding for ion pumps and transporters that facilitate proton extrusion from cancer cells (for example, SLC9A1, SLC16A1/MCT1 and SLC16A3/MCT4 and CA9) are downregulated in MTC glioma cells and tumors whereas they are highly expressed in the GPM group (Fig. 6e and Supplementary Table 8c). Consistent with this finding, intracellular pH (pHi) was lower in MTC than in GPM PDCs (MTC: pH 7.15, confidence interval (CI) = 7.0–7.3; GPM: pH 8.17, CI = 8.0–8.3; P = 0.000004; Fig. 7a). We speculated that, with an already acidic intracellular environment, MTC GBM may not tolerate further decrease in pHi as result of the constant symporter activity of SLC45A1. Indeed, lentivirus-mediated re-expression of SLC45A1 in H502 cells (Fig. 7b) decreased pHi below 7.0 (Fig. 7c) and markedly impaired cell proliferation in colony-forming assays and growth kinetics (Fig. 7d,e). Conversely, expression of SLC45A1 in U87 cells, which harbor an intact SLC45A1 locus (Fig. 6c), lacked discernible effects on either pHi or cell growth (Fig. 7b–e). Next, we reintroduced SLC45A1 in MTC PDC-002 and −064, which harbor homozygous deletion of SLC45A1 (Extended Data Fig. 10g,h), and GPM PDC-078 lacking SLC45A1 alterations, and observed strong inhibition of gliomasphere formation in PDC-002 and −064 but no effect in PDC-078 (Fig. 7f,g). Finally, we asked whether ectopic expression of the SLC9A1 proton extruder in PDC-002 would mitigate the negative effect on cell fitness caused by SLC45A1, and found that coexpression of SLC9A1 rescued self-renewal (Fig. 7h,i).
Fig. 7 |. Analysis of SLC45A1 function in GBM cells.
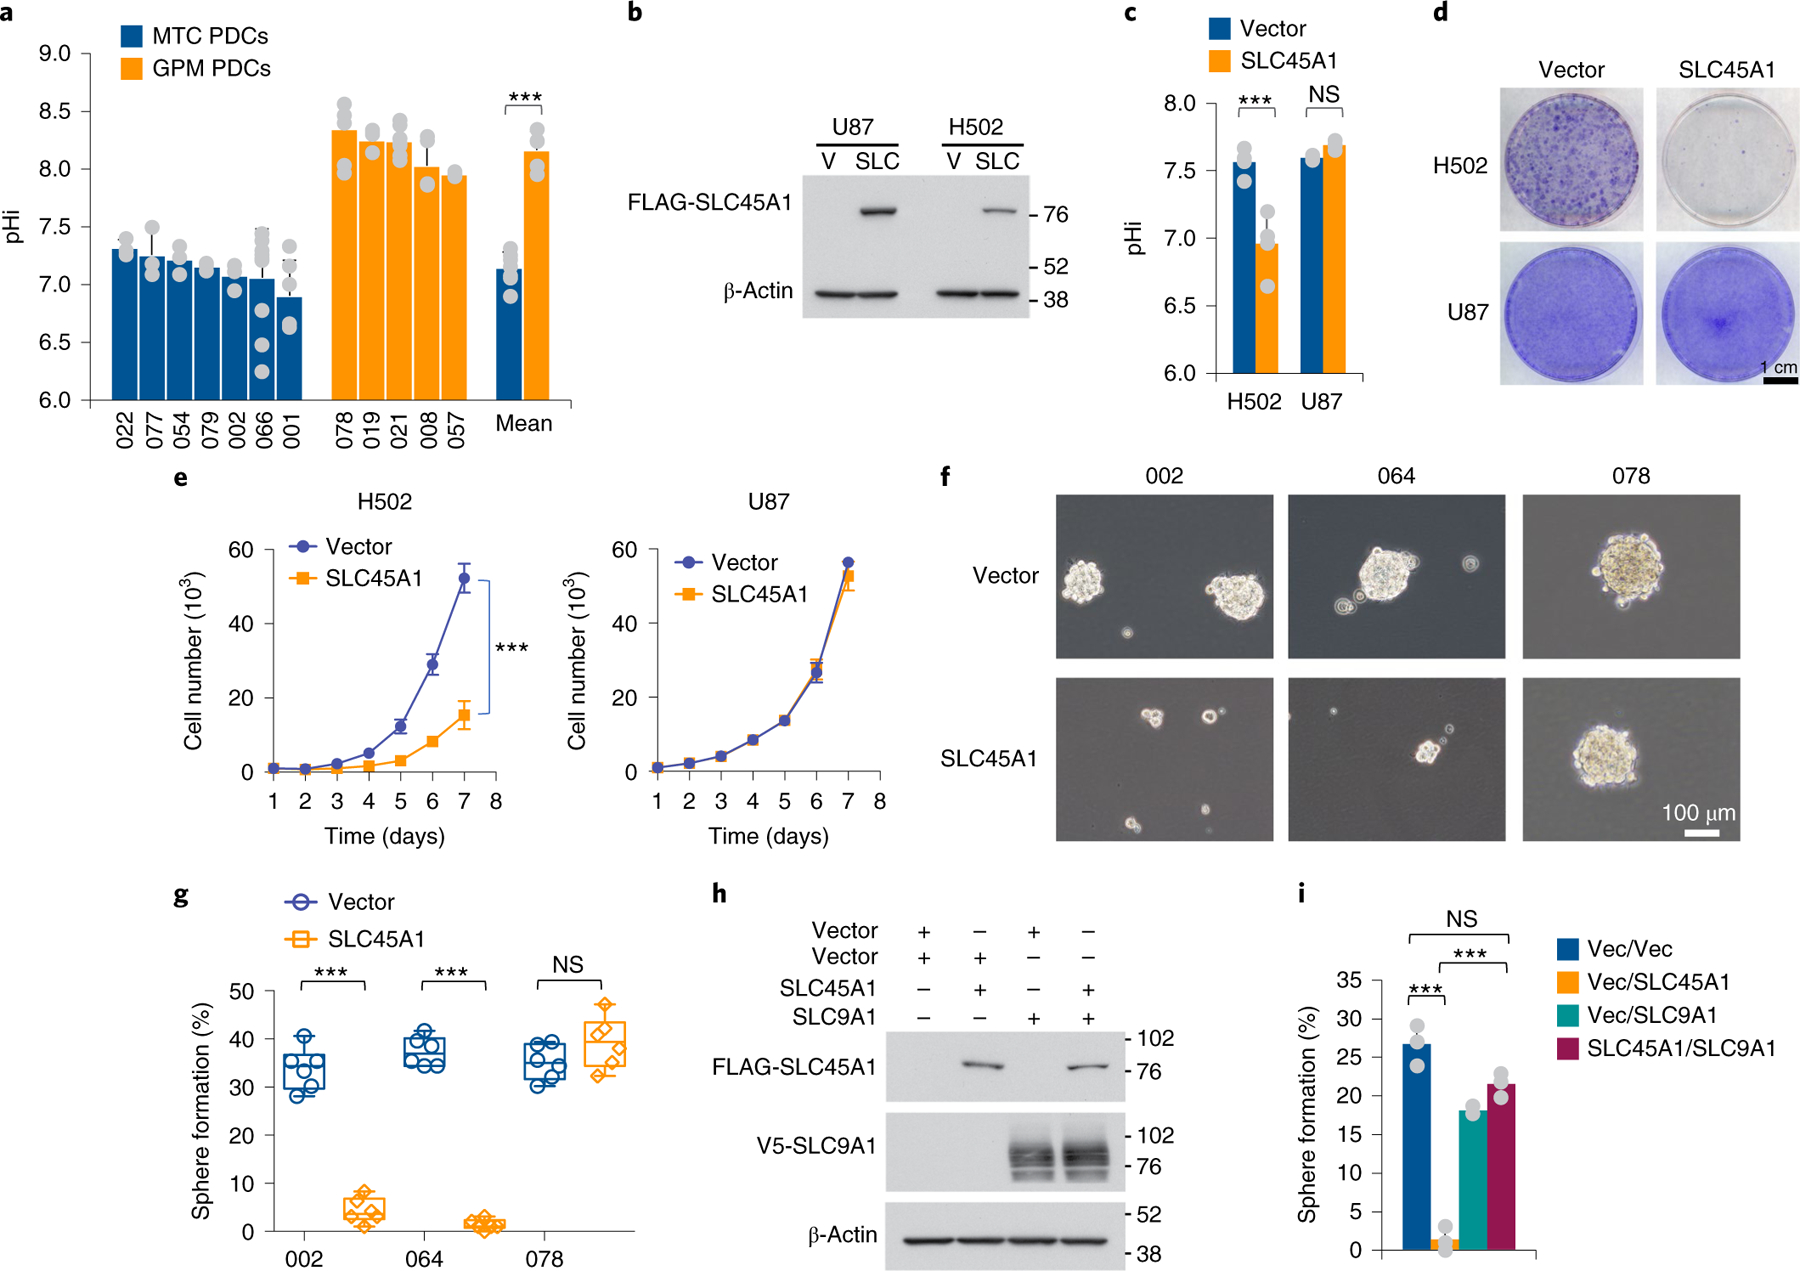
a, Quantification of pHi in MTC and GPM PDCs. Data are mean ± s.d. of n ≥ 3 independent experiments performed in seven MTC and five GPM PDCs, each derived from an independent patient and each assessed by four technical replicates (Source Data Fig. 7). Bars on the right-hand side of the graph indicate mean ± s.d. of the values observed in the two sets of PDCs; n = 7 MTC and n = 5 GPM PDCs, each derived from an independent patient; ***P = 0.000004. b, Immunoblot of FLAG-SLC45A1 in U87 (SLC45A1 wild type) and H502 cells (SLC45A1-deleted). V, vector; SLC, SLC45A1. c, Quantification of pHi in H502 and U87 cells expressing either SLC45A1 or the empty vector. Data are mean ± s.d. from n = 3 independent experiments for U87 and n = 4 independent experiments for H502, each performed with three technical replicates (***P = 0.0078 for vector versus SLC45A1 in H502 cells; NS, not significant). d, Representative images of colony formation of H502 and U87 cells treated as in c. e, Growth curves of independent cultures of cells expressing either SLC45A1 or the empty vector. Data are mean ± s.d from one experiment (n = 4 independent cultures; ***P = 0.00001 for vector versus SLC45A1 in H502 cells. f, Representative microphotographs of PDC-002 and −064 (SLC45A1-deleted) and PDC-078 (SLC45A1 wild type) following ectopic expression of SLC45A1 or the empty vector. g, Quantification of sphere-forming assay for cells treated as described in f. Data are from two independent experiments, each performed with three independent infections (n = 6 independent infections); ***P = 0.0000005 for vector versus SLC45A1 in PDC-002 and ***P = 0.0000001 in PDC-064). Box plots span the first to third quartiles, and whiskers show 1.5× interquartile range. h, Immunoblot of FLAG-SLC45A1 and V5-SLC9A1 in PDC-002 (SLC45A1-deleted) expressing either SLC45A1, SLC9A1, SLC45A1 plus SLC9A1 or the empty vector. i, Quantification of sphere-forming assay for cells described in h. Data are mean ± s.d. from one representative experiment; n = 3 independent infections; ***P = 0.0004, vector (vec) versus SLC45A1; ***P = 0.0001, vector/SLC45A1 versus SLC45A1/SLC9A1. The experiment was repeated two times with similar results. In all experiments, significance was established by two-tailed t-test, unequal variance (Source Data Fig. 7).
MTC GBM exhibits unique vulnerability to OXPHOS inhibition, increased sensitivity to radiotherapy and higher intracellular ROS
The finding that subtypes MTC and GPM GBM harbor reciprocal deletions and exhibit divergent metabolism suggested that the two metabolic GBM subgroups might harbor distinct therapeutic vulnerabilities. At variance with the metabolic redundancy of the GPM subtype, the exclusive reliance of MTC GBM upon OXPHOS for energy production suggested that a specific vulnerability might exist in this subtype. Therefore, we tested the sensitivity of 13 MTC and ten GPM PDCs to compounds that interfere with OXPHOS and mitochondrial metabolism. We used two inhibitors of mitochondrial complex I, metformin and IACS-010759, that decrease OXPHOS47,48; tigecycline, inhibitor of mitochondrial protein translation49; and menadione, inducer of mitochondrial ROS and apoptosis50. Mitochondrial inhibitors reduced the viability of MTC PDCs, albeit with variable potency and sensitivity in different PDCs (Fig. 8a–d). Conversely, GPM PDCs were resistant to all four compounds (Fig. 8a–d). A sensitivity score that integrated the activity of the four mitochondrial inhibitors not only separated MTC PDCs (responders) from GPM PDCs (nonresponders; Fig. 8e and Supplementary Table 17) but also indicated that higher sensitivity positively correlated with MTC transcriptional activity and negatively with GPM activity (Fig. 8e). Furthermore, the complementary fCN gains and losses of MTC and GPM gene sets robustly correlated with mitochondrial inhibitor sensitivity score (Fig. 8e). Treatment of GBM PDCs with inhibitors of glycolysis (DEAB and FX-11)51 had no effect regardless of the metabolic class of PDC (Fig. 8f,g). This finding indicates that activation of multiple metabolic pathways in GPM GBM probably creates a metabolic redundancy that generates tolerance to inhibition of glycolysis.
Fig. 8 |. MTC PDCs are distinctly sensitive to mitochondrial inhibition.
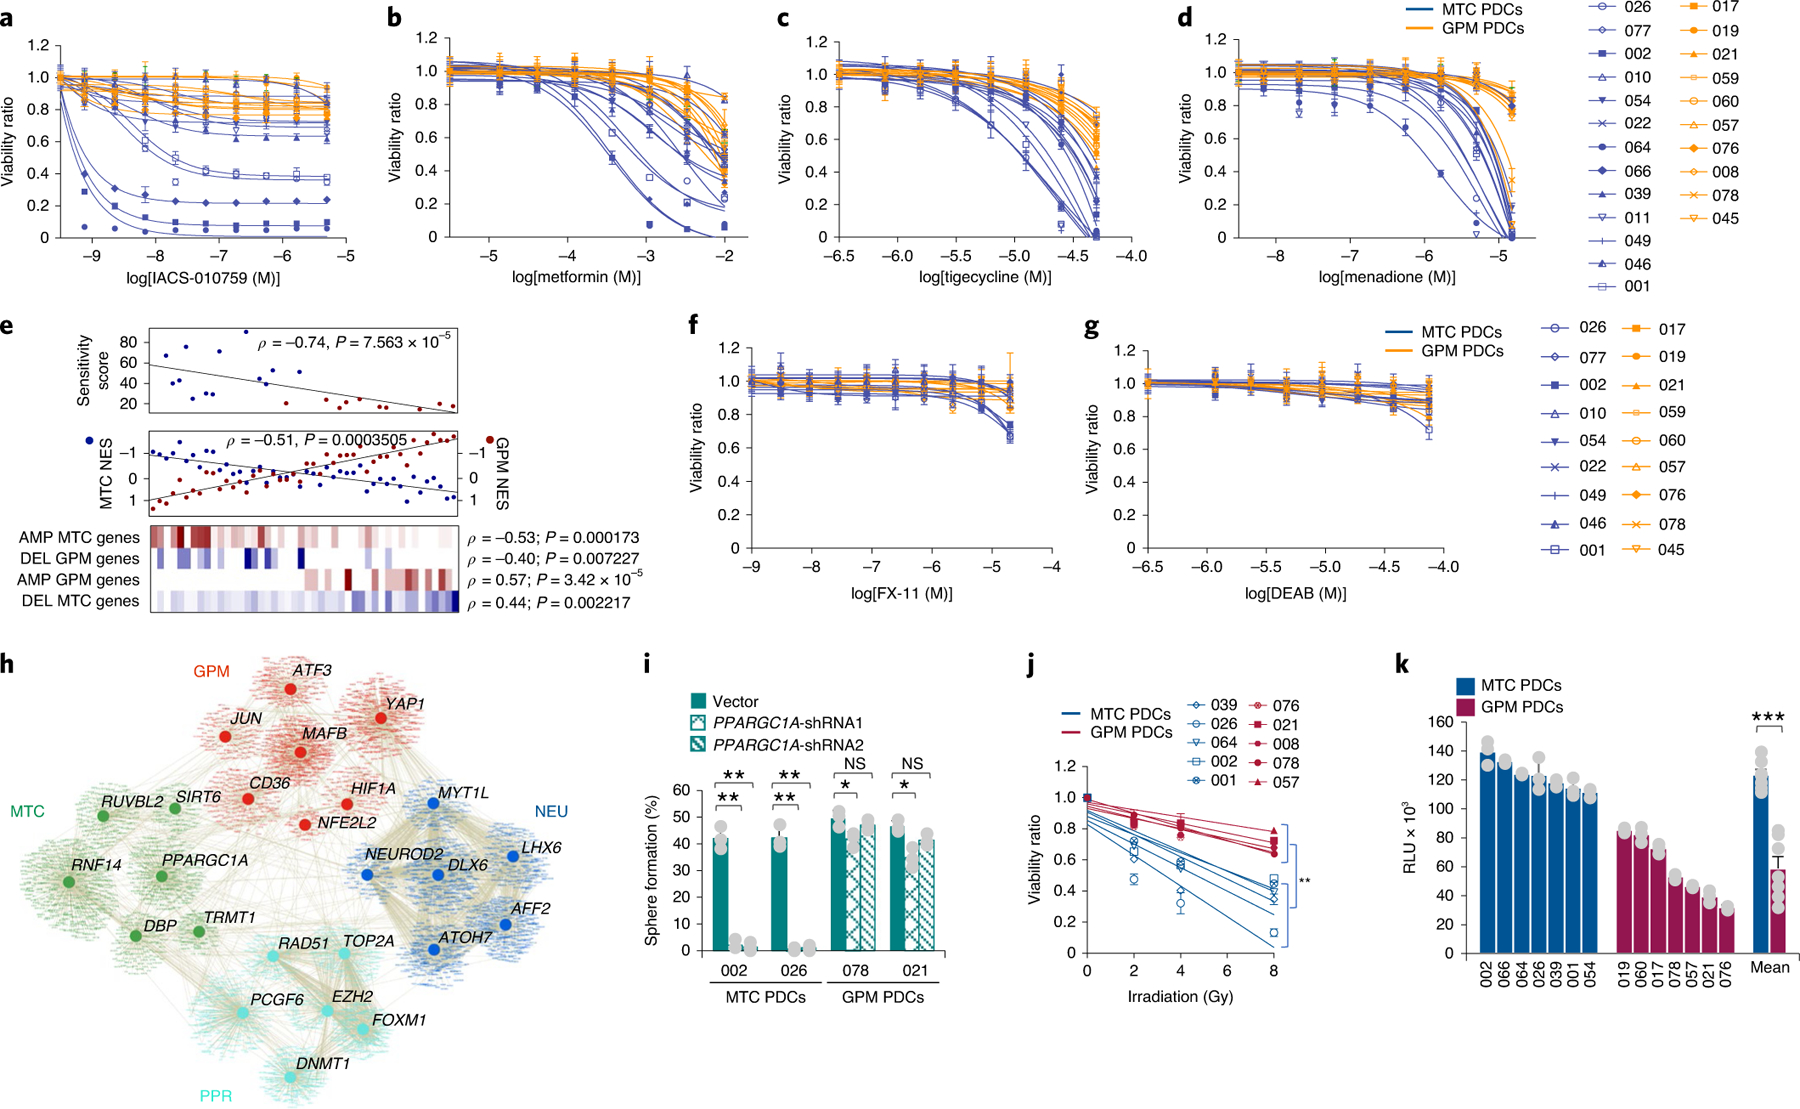
a–d, Viability curves of 13 MTC and ten GPM PDCs each derived from an independent patient treated with either IACS-010759 (a), metformin (b), tigecycline (c) or menadione (d). Data are mean ± s.d. of n ≥ 3 replicates for each PDC from one representative experiment. e, Top: mitochondrial inhibitor sensitivity score for MTC (blue dots) and GPM (red dots) PDCs (n = 13 MTC PDCs and n = 10 GPM PDCs; Spearman’s correlation, ρ = −0.74, P = 7.563 × 10⁻⁵). Middle: correlation analysis of MTC (blue) and GPM (red) activity in PDCs (n = 25 MTC PDCs and n = 21 GPM PDCs; Spearman’s correlation, ρ = −0.51, P = 0.0003). Bottom: enrichment of fCNV gain and loss of mitochondrial and glycolytic-related genes in MTC PDCs (n = 25) and GPM PDCs (n = 21). The number of genes amplified/deleted in each tumor is color coded (amplifications, red to white; deletions, blue to white). f,g, Viability curves of nine MTC PDCs and nine GPM PDCs, each derived from an independent patient, treated with either FX-11 (f) or DEAB (g). Data are mean ± s.d. from n ≥ 4 replicates for each PDC from one representative experiment. h, Transcriptional regulatory network of GBM subtypes. Representative MRs with differential activity (n = 304 tumors, n = 2,799 cells from dataset 1, n = 9,652 cells from dataset 2 and n = 4,916 cells from dataset 3; two-sided MWW test, FDR < 0.01) in TCGA and at least two out of three single-cell datasets are shown (two-sided MWW–GST test, logit(NES) > 0.58, FDR < 0.01). Nodes represent MRs and target genes, while lines represent interactions. i, Quantification of sphere-forming assay for two MTC and two GPM PDCs, each derived from an independent patient expressing two different short-hairpin RNAs for either PPARGC1A or the empty vector. Data are mean ± s.d. from one representative experiment including n = 3 independent infections for each PDC; **P = 0.0010 and 0.0013 for PDC-002 shRNA1 and shRNA2 versus vector, respectively; **P = 0.0030 and 0.0023 for PDC-026 shRNA1 and shRNA2 versus vector, respectively; *P = 0.0285 for PDC-078 shRNA1 versus vector; *P = 0.0142 for PDC-021 shRNA1 versus vector. j, Cell viability after irradiation of five MTC and five GPM PDCs, each derived from an independent patient. Data are mean ± s.d. of one representative experiment assessed by n = 30 replicates for each PDC; **P = 0.0022. k, ROS quantification in MTC and GPM PDCs. Data are mean ± s.d. of n = 3 independent experiments for each PDC, each performed in triplicate. Bars on the right-hand side of the graph indicate mean ± s.e.m. of values observed in the two sets of PDCs; n = 7 MTC PDCs and n = 7 GPM PDCs, each derived from an independent patient; ***P = 0.00006. Experiments in a–d, f, g, i and j were repeated two times with similar results. In all experiments, significance was evaluated by two-tailed t-test, unequal variance (Source Data Fig. 8).
To provide independent validation of the sensitivity of MTC GBM organoids to inhibitors of mitochondrial metabolism, we interrogated the effects of silencing PGC1α (PPARGC1A), a MR of mitochondrial biogenesis and metabolism52. Interestingly, PGC1α scored as MTC GBM-specific MR from the differential analysis of MRs distinctly connected with the biological functions activated in each single-cell and bulk GBM subgroup (Fig. 8h and Supplementary Table 18). Silencing of PGC1α with two nonoverlapping shRNA lentiviruses14 was incompatible with self-renewal and growth of MTC GBM, but had only minimal effects in GPM PDCs (Fig. 8i), supporting the notion that mitochondrial metabolism is essential for the survival and growth of MTC GBM.
Because mitochondria, rather than the nucleus, are the primary organelle determining the effects of radiotherapy in cancer cells53, we compared the sensitivity of MTC and GPM PDCs to radiotherapy, the standard of care for patients with GBM. MTC cells exhibited significantly higher sensitivity to radiotherapy treatment than GPM GBM (P = 0.0022; Fig. 8j). These findings provide a clue to the better survival of patients with MTC GBM. Production of ROS by mitochondria is the primary source of oxidative stress induced by ionizing radiation54. Accordingly, intracellular ROS were, on average, twofold higher in MTC than in GPM PDCs (P = 0.00006; Fig. 8k), illuminating the probable mechanism responsible for the higher sensitivity of MTC GBM cells to oxidative stressors.
Discussion
In this study, we present a transcriptional classification of IDH wild-type GBM based on the core biological functions denoting the identity of single glioma cells. A reproducible single-cell and bulk tumor typing was obtained when analyzing multiple datasets using a computational approach devised to measure pathway activities rather than gene signatures and supported by multiomics analyses. The pathway-based classifier segregated single glioma cells and primary GBM into four subtypes characterized by attributes of either development (NEU and PPR) or metabolism (MTC and GPM). With the inclusion of three separate scRNA-seq datasets, the computational approach was designed to overcome the challenges of batch integration by analysis of each tumor independently while combining downstream pathway measures. Nevertheless, the integrated analysis of scRNA-seq data obtained with different methods (droplet-based and full-length sequencing) remains a difficult task. Furthermore, as our approach focused primarily on glioma-cell-intrinsic biological states, future work will be required to explore in depth the heterogeneity within myeloid and other nontumor cell populations associated with each GBM subtype.
The pathway-based classification presented here introduces metabolism-associated GBM subtypes with prognostic and therapeutic implications for the MTC subgroup. It also adds an in-depth knowledge of the dynamics of neural cells within the neurodevelopmental axis of GBM. In this context, the PPR subgroup was enriched in tumor cells exhibiting neural progenitor features that coexist with the active cell cycle. Conversely, cells in the NEU subgroup expressed markers of neurons at various stages of maturation. Compared to previously established GBM classifiers3,11, the discrimination of PPR and NEU groups paints a map of functions in GBM that recapitulate the transcriptional programs active at different stages of neurogenesis in the normal brain, from TBR1-positive newly born to differentiated neurons establishing synaptic connectivity9,55. In contrast to a dynamic developmental core, the metabolic axis of GBM comprises two diverging metabolic states (MTC and GPM), sustained by opposing transcriptomic programs and genetic alterations generating a distinct metabolic dependency. Whereas the GPM subtype exhibited partial overlap with mesenchymal GBM, the MTC subtype defines a previously unknown glioma state that conveys prognostic and therapeutic information and is distributed orthogonally across the known subtypes. The hallmark features of two unique groups in the pathway-based classifier, subtypes PPR and MTC, can be generally distinguished by computational and metabolic analysis, respectively. For example, machine learning approaches were able to extract stem/progenitor cell indices from pan-cancer transcriptomes56. Conversely, in vivo metabolic studies have been used to identify functional mitochondrial heterogeneity within subtypes of lung cancer and it was proposed that these assays might also capture cancer metabolic vulnerabilities57.
The classic concept that oncogenic and tumor suppression functions are mainly executed by genes targeted by focal CNVs has recently been challenged by observations documenting much broader cancer-promoting activities by CNVs associated with gene expression changes in cis58–60. By identifying congruent genetic alterations in each GBM subgroup, with fCNVs and SNVs targeting genes directly effecting a distinct subgroup phenotype, our work expands the definition of driver genes that in GBM have primarily been restricted to focal alterations. We also identified deletion of chromosome 1p36.23 as a genetic alteration distinctly associated with MTC GBM. The analysis of focality and experimental follow-up implicated the proton-glucose symporter SLC45A1 in a previously unknown mechanism of tumor suppression specific for the MTC state. We propose that activation of multiple proton extruders in GPM cells maintains an alkaline pHi that reinforces glycolysis and confers resistance to apoptotic signals. Conversely, a lower basal pHi renders MTC cells highly sensitive to further pH reduction. In this scenario, deletion of the proton-glucose symporter SLC45A1 is a necessary step to prevent unsustainable intracellular acidification.
The contrasting GPM and MTC subgroups of GBM are associated not only with gain-of-function alterations in genes promoting each particular metabolic state, but also with deletions and mutational inactivation of genes that implement the opposite phenotype. These findings offered unexpected opportunities for synthetic lethal therapeutics in MTC GBM. The obligate mitochondrial activity of MTC GBM boosted intracellular ROS, thus contributing to explaining the higher sensitivity of MTC PDCs to irradiation and the better clinical outcome in patients with MTC GBM. Conversely, the broad resistance of the GPM GBM subtype to multiple treatment types underpins the protective redundancy of metabolic activaties in these tumors. Prominent among these, lipid biosynthesis and storage in lipid droplets represent a recognized protective mechanism in cancer cells35.
The reciprocal MTC/GPM activity score captured the divergent biology of these GBM subtypes and predicted the therapeutic response of MTC PDCs to OXPHOS inhibition. The MTC/GPM activity score may be of general significance in multiple tumor types, and will be incorporated into new clinical studies testing the effect of OXPHOS inhibitors in patients with GBM.
Methods
scRNA-seq datasets and sequencing.
Single-cell gene expression profiles were collected from three datasets of primary human high-grade IDH wild-type glioma for a total of 36 tumors (Supplementary Table 1). The first dataset consists of nine grade IV gliomas (eight GBM and one gliosarcoma) and includes multisector biopsies obtained by precision navigator surgery6. The second dataset includes seven gliomas (six GBM and one grade III IDH wild-type glioma), four of which have previously been reported7, plus three specimens not previously reported (PJ053, PJ069 and PW032.706). The third dataset includes 20 adult IDH wild-type GBM specimens4. Single-cell RNA-seq libraries in dataset 1 were constructed following the single-cell tagged reverse transcription–seq protocol with minor modifications as previously described61,62. Dataset 2 included GBM specimens dissociated and applied to an automated, microwell-based platform for scRNA-seq library construction7. Dataset 3 has been processed using Smart-Seq2 whole-transcriptome amplification, library construction and sequencing4. Raw sequencing reads of single cells were obtained from pooled library data by cell-specific barcodes. Sequences containing poly-A tails, sequencing adapters or low-quality bases (n bases >10%) were removed. Clean data were aligned to the GRCh38 human reference genome with STAR (v.2.0.5)63. PCR redundant reads were eliminated by unique molecular identifier sequences, and the number of unique mapped reads on each gene was calculated with htseq-count64.
scRNA-seq data processing and quality control.
Quality control methods are described in the Supplementary Note accompanying the manuscript. The final expression matrices include 4,227 cells (2,799 of which were malignant) for dataset 1, 10,315 (9,652 of which were malignant) for dataset 2 and 5,742 (4,916 of which were malignant) for dataset 3. A multistep approach to distinguish tumor from nontumor cells was applied (Supplementary Note).
Computational pipeline.
Methods for the definition of single-sample pathway activity, scBiPaD, characterization of the biological states of single-cell subpopulations with single-cell gene metasignature, and subtype classification multiomics analyses of primary GBM are included in the Supplementary Note, along with analyses of PDCs.
Impact of GBM functional subclasses on clinical outcome.
Overall survival was calculated from the day of surgery to either the day of death or the end of follow-up. Kaplan–Meier survival curves were compared using the log-rank test. Cox’s proportional hazards models were generated using the normalized enrichment score (NES; Supplementary Note) of each subtype as independent predictor. Cox’s proportional hazards regression analysis was performed, including clinical and molecular covariates (age at diagnosis, gender, MGMT methylation status and functional GBM subtypes) individually or in combination.
The association between functional groups and the clinical and molecular characteristics of GBM was performed using the χ2 test for binary covariates (gender, Karnofsky performance score, MGMT promoter status) and Kruskal–Wallis H-test with post hoc correction by Nemenyi’s test for multiple subtype comparison of continuous variables (age and mutation count).
Validation datasets.
We used tumor samples from three independent GBM cohorts and assigned each tumor to a distinct subtype on the basis of the highest significant score according to ssMWW–GST: logit(NES) > 0.58 and FDR < 0.01.
The first dataset consisted of 146 primary TCGA GBM IDH wild-type profiled by RNA-seq, of which 145 were available with survival data. Data were downloaded using the TCGAbiolinks R/Bioconductor package65. We applied GC content correction to the raw data for the within-normalization step and upper quantile for the between phase, according to a previously described pipeline66. Out of 146 classified samples, 125 were also profiled with Agilent chip G4502A and this cohort was used in the cross-validation. A total of 86% of tumors received the same subtype across different platforms (for concordance, the union of unclassified samples in both platforms has been excluded from the total number considered).
The second dataset comprised 183 IDH wild-type GBM from the Chinese Glioma Genome Atlas (CGGA) cohort profiled by RNA-seq, of which 175 had survival data available67. Data were extracted from two batches of 325 and 693 gliomas of varying grade and histology, and corrected for batch effect using the COMBAT algorithm68.
The third dataset included 219 GBM with available survival information (GEO: GSE13041) profiled with three different Affymetrix platforms (U133A, U133 Plus 2.0 and U95 v.2)69. Probe intensities were converted to gene symbols, retaining only those genes covered by all platforms. Batch effects were corrected using the COMBAT algorithm while survival differences were assessed using the log-rank test.
Finally, we validated the 192 pathways associated with survival in the combined single-cell datasets by building the individual tumor consensus clustering with the NES of 192 survival-associated pathways. This analysis produced 103 subpopulations that clustered in K = 4 groups according to the Calinski–Harabasz criterion. Cluster assignment was confirmed by independent analysis of each single-cell dataset (~94% concordance). Moreover, single-cell classification using a metasignature derived from the new subpopulation clusters revealed an overall concordance of subtype classification between the 5,032 and 192 pathway analyses of 91% for dataset 1, 93% for dataset 2 and 91% for dataset 3.
Analysis of the tumor microenvironment in GBM subclasses.
Tumor purity of bulk GBM was evaluated using the ABSOLUTE inference method12. Nontumor cells from single-cell cohorts were classified by ssMWW–GST using a collection of gene signatures of immune and stromal cells assembled from published reports3,7,13,70,71. The association between nontumor cell types and functional GBM cell states was evaluated using Spearman’s correlation. Enrichment of microglia or macrophages in the microenvironment of GPM and MTC tumors was tested in four GBM from dataset 1, two containing >75% GPM tumor cells (S4_D1 and S12_D1) and two comprising >75% MTC tumor cells (S1_D1 and S5_D1). For each individual myeloid cell, we defined a score calculating the difference in the expression mean of macrophage- and microglia-specific genes: S = µmacrophage – µmicroglia. To highlight the macrophage- and microglia-specific genes whose differential expression mainly distinguished the two subpopulations, we correlated the expression of each gene with the score S across all cells. We selected and represented in the heatmap 25 genes with the highest (macrophage gene set) and the lowest (microglia gene set) correlation.
Assembly of transcriptional interactomes and MR analysis.
To identify MRs of gene expression signatures activated in the four GBM subtypes, a context-specific transcriptional network from the Agilent gene expression profiles of 534 IDH wild-type GBM was assembled using the RGBM algorithm72. As input for the construction of the transcriptional network, a list of putative transcription regulators/factors (TFs) was derived from the Human Transcription Factors website including 2,765 proteins73, a transcription factor list previously published74, genes from the Ingenuity Pathways Knowledge Base and a list of known TFs from the TRANSFAC database75. The list of putative TFs was further manually revisited, retaining those for which scientific evidence demonstrated their role as regulators of transcription. The list includes a total of 2,360 TFs expressed in the TCGA GBM IDH wild-type dataset. The transcriptional interactome comprised 210,468 (median regulon size, 147) interactions between 1,450 TFs (with at least 15 target genes) and 16,613 target genes. TF activity enrichment in each individual tumor or cell was computed by ssMWW–GST, as described in the Supplementary Note. We independently derived candidate MRs from the GBM TCGA cohort and the three single-cell datasets, and retained as significant (two-sided MWW–GST, FDR < 0.01, logit(NES) > 0.58; and two-sided MWW test for differential activity, FDR < 0.01) only those MRs consistently activated in tumors and at least two single-cell datasets.
Plasmids, cloning and lentivirus production.
Complementary DNAs for SLC45A1 and SLC9A1 were amplified by PCR and cloned into vectors pLVX and PLX, respectively, in-frame with the tag FLAG or V5. Lentivirus was produced by cotransfection of the lentiviral vectors with plasmids pCMV-ΔR8.1 and pCMV-MD2.G into HEK293T cells, as previously described14. Lentiviral vectors used for silencing of PPARGC1A were previously published14 and include the following sequences:
shPPARGC1A-Hs-1: GCAGAGTATGACGATGGTATTCTCGAGAATACCATCGTCATACTCTGC shPPARGC1A-Hs-2: CCGTTATACCTGTGATGCTTTCTCGAGA AAGCATCACAGGTATAACGG.
Genomic DNA PCR.
Genomic DNA from glioma cell lines and PDCs was assayed by semiquantitative PCR. Primer sequences are:
SLC45A1: Fw 5′-AGGTCCCCATGGGATTGAGT-3′; Rv
5′- GCACAATTGACAGCTGGGTC-3′
ENO1: Fw 5′-TCACCTGTTGGCTACACAGAC-3′; Rv
5′-CTTGGTGGAAAGTGAGGCGAG-3′.
Cell culture.
The human cell lines used were U87 (ATCC HTB-14), HEK293T (ATCC CRL-11268), H502 and H423 (ref. 41). Cells were cultured as previously described14.
Patient-derived cells were obtained using excess material collected for clinical purposes from deidentified brain tumor specimens. Donors (patients diagnosed with GBM) were anonymous. Work with these materials was designated as Institute for Research in Biomedicine (IRB) exempt under paragraph 4, and is covered under IRB protocol (no. IRB-AAAI7305) and Onconeurotek tumor bank certification (no. NF S96 900), and by authorization from the appropriate ethics committee (CPP Ile de France VI, ref. A39II) and the French Ministry for research (no. AC 2013–1962). PDCs were cultured and transduced, and gliomasphere assay was performed as described14,76.
Cell growth assay.
Time course analysis of the cellular growth of H502 and U87 cells expressing SLC45A1 or the empty vector was performed by plating 1,000 cells per well in DMEM in six-well plates containing 10% fetal bovine serum. Viable cells were counted daily. Data are mean ± s.d. of four replicates, and experiments were repeated twice. For clonogenic assay, 1,000 cells were plated in 60-mm2 dishes. Cells were fixed in methanol and stained with crystal violet 2 weeks later. Photographs of one experiment performed in duplicate are presented. Experiments were repeated twice.
Quantification of pHi.
Cells were plated at a density of 40,000–80,000 per 130 μl of medium (four replicates) on opaque black 96-well plates. After 24–48 h, cells were stained using pHrodo Green AM Intracellular pH Indicator (Invitrogen, no. P35373) for 30 min at 37 °C. Cells were washed with Fluoro Brite medium (Gibco, no. A18967–01) and immediately assayed using a multiplate fluorescence reader (VICTOR NIVO, Perkin Elmer) at 509–533-nm wavelength. pH calibration was obtained using the Intracellular pH Calibration Buffer Kit pH 4.5, pH 5.5, pH 6.5 and pH 7.5 (Invitrogen, no. P35379).
Metabolic assays.
Measurement of OCR and extracellular acidification.
The extracellular flux changes of oxygen and protons were measured using the XF96 Extracellular Flux Analyzer (Agilent) as previously described14.
Basal glycolysis indicates a normalized value of extracellular acidification, rate 4–8 (after glucose injection). Data are mean ± s.d. from at least seven replicates in six MTC and six GPM PDCs, each derived from an independent patient. Experiments were performed twice.
Intracellular glucose uptake, extracellular lactate concentration, glutamine consumption, triacylgliceride accumulation, lipid droplet visualization and ROS quantification.
Measurement of the rate of glucose uptake, lactate secretion, glutamine consumption and triacylgliceride accumulation was performed using Glucose Uptake-Glo Assay (PROMEGA, no. J1342), Lactate-Glo Assay (PROMEGA, no. J5022), Glutamine/Glutamate-Glo Assay (PROMEGA, no. J5022) and Triglyceride-Glo Assay (PROMEGA, no. J3161), respectively, according to the manufacturer’s instructions. Briefly, cells were plated at a density of 7,000 per 130 μl (three replicates) of medium containing 8 mM glucose and 2 mM glutamine in opaque white 96-well plates. Glucose uptake and lactate secretion were assayed 24 h after plating, while glutamine was measured at 36 h and triacylglicerides at 96 h. Luminescence was recorded at 0.3-s integration on a GloMax instrument. Data are mean ± s.d. of triplicate observations from seven MTC and seven GPM PDCs from one representative experiment for glucose uptake, lactate secretion and triacylgliceride accumulation assays; and from two independent experiments for glutamine consumption.
Quantification of ROS was performed using ROS-Glo Assay (PROMEGA, no. G8821) according to the manufacturer’s instructions. Briefly, cells were plated at a density of 7,000 per 80 μl (three replicates) and assayed 48 h later. Luminescence was recorded at 0.3-s integration on a GloMax instrument. Data are expressed as mean relative light units (RLU) ± s.d. of triplicate observations from seven MTC and seven GPM PDCs from one representative experiment.
For visualization of lipid droplets in GBM PDCs, 30,000 cells were plated on laminin-coated glass coverslips; 96 h later, cells were washed with PBS and fixed in 3% paraformaldehyde for 15 min at room temperature. After two washes with PBS and quenching in 50 mM glycine, cells were stained with Bodipy 493/503 (Molecular Probes, no. D3922) at a concentration of 2 μg ml−1 for 30 min at room temperature. Coverslips were washed three times with PBS, counterstained with DAPI (Sigma) and mounted in Aqua Poly/Mount (Polysciences). Images were acquired under a ×60/0.9 numerical aperture objective Olympus 1 × 70 microscope equipped with a digital camera.
Compound treatment of PDCs.
Cells were cultured in DMEM/F12 medium supplemented with N-2, B-27, EGF and FGF. Cells were plated in 130 μl of medium in opaque white 96-well plates. Twenty-four hours later, cells were treated for 72 h with two- to threefold serial dilutions of selected compounds (Fig. 8) in six replicates. Viability was determined using CellTiterGlo assay reagent (Promega, no. G7570) and the GloMax-Multi+ Microplate Multimode Reader (Promega).
Mitochondrial inhibitor sensitivity score.
Patient-derived cells were treated with mitochondrial inhibitors (IACS-010759, metformin, tigecycline or menadione). The integrated score representative of the combined effect of the four drugs was obtained using the area under the curve (AUC) of dose–response for each individual drug. The mitochondrial sensitivity score (MSS) was defined as
where i (i = 1,…,n) represents the ith cell line, j (j = 1,…,4) represents the jth drug and the ratio represents the normalized sensitivity score of the ith cell line to the jth drug such that the most responsive cell line for that drug was assigned a value of 100%.
Irradiation treatment of GBM PDCs.
Patient-derived cells were plated in 96-well plates 24 h before radiation treatment. Cells were exposed to various irradiation doses (2, 4 and 8 Gy at 1.0 Gy min−1) from a 137Cs source (GammaCell 40 irradiator, Teratronics). Mock-irradiated cells were cultured in parallel. Viability was determined 96 h later using CellTiterGlo assay reagent (Promega, no. G7570) and the GloMax-Multi+ Microplate Multimode Reader (Promega). Data are expressed as mean ± s.d. of the viability ratio from six observations in five MTC and five GPM PDCs. Experiments were performed at least twice. Statistical significance was calculated from the value of slopes.
Immunoblot.
Cells were lysed in RIPA buffer (50 mM Tris-HCl pH 7.5, 150 mM NaCl, 1 mM EDTA, 1% NP40, 0.5% sodium dexoycholate, 0.1% sodium dodecyl sulfate, 1.5 mM Na3VO4, 50 mM sodium fluoride, 10 mM sodium pyrophosphate, 10 mM β-glycerolphosphate and EDTA-free protease inhibitor cocktail; Roche). Lysates were cleared by centrifugation at 15,000 r.p.m. for 15 min at 4 °C, then separated by SDS–polyacrylamide gel electrophoresis and transferred to polyvinylidene difluoride membrane. Membranes were blocked in Tris-buffered saline with 5% nonfat milk and 0.1% Tween 20, and probed with primary antibodies overnight at 4 °C. Antibodies and concentrations were as follows: FLAG 1:1,000 (Sigma, no. F1804), V5 1:1,000 (Invitrogen, no. R960–25) and β-actin 1:4,000 (Sigma, no. A5441). Secondary antibody anti-mouse conjugated horseradish peroxidase was purchased from Invtrogen (no. 31438), and either Enhanced ChemiLuminescence (Amersham, no. RPN2209) or Super Signal West Femto (Thermo Scientific, no. 34095) was used for detection.
Statistics and reproducibility.
In general, at least two independent experiments were performed with a minimum of three biological replicates, as specified in figure legends. No statistical methods were used to predetermine sample size. No data were excluded from the analyses, the experiments were not randomized and the investigators were not blinded to allocation during experiments and outcome assessment. Comparisons between two groups were analyzed by either Welch’s t (two-tailed, unequal variance) or two-sided MWW–GST test. Comparison between three or more groups was assessed by analysis of variance or Kruskal–Wallis test with Nemenyi post hoc correction for multiple comparison. Enrichment analysis of biological pathways was assessed using either two-sided MWW–GST or two-sided Fisher’s exact test. Correlation analyses were performed using Spearman’s correlation. Association between two groups was assessed by two-sided Fisher’s exact test; association between three or more groups was assessed by the χ2 test. Survival differences were evaluated using the log-rank test or Cox’s proportional hazards model. Results in graphs are expressed as either means ± s.d. or means ± s.e.m., as presented in figure legends for the indicated number of observations. Box plots span the first to third quartiles and whiskers show 1.5× interquartile range. All statistical analyses were performed and P values obtained using either GraphPad Prism software 6.0, R v.3.4.4, Jupyter Notebooks v.5.7.2 or Python v.3.6.
Reporting Summary.
Further information on research design is available in the Nature Research Reporting Summary linked to this article.
Extended Data
Extended Data Fig. 1 |. The computational framework of scBiPaD.
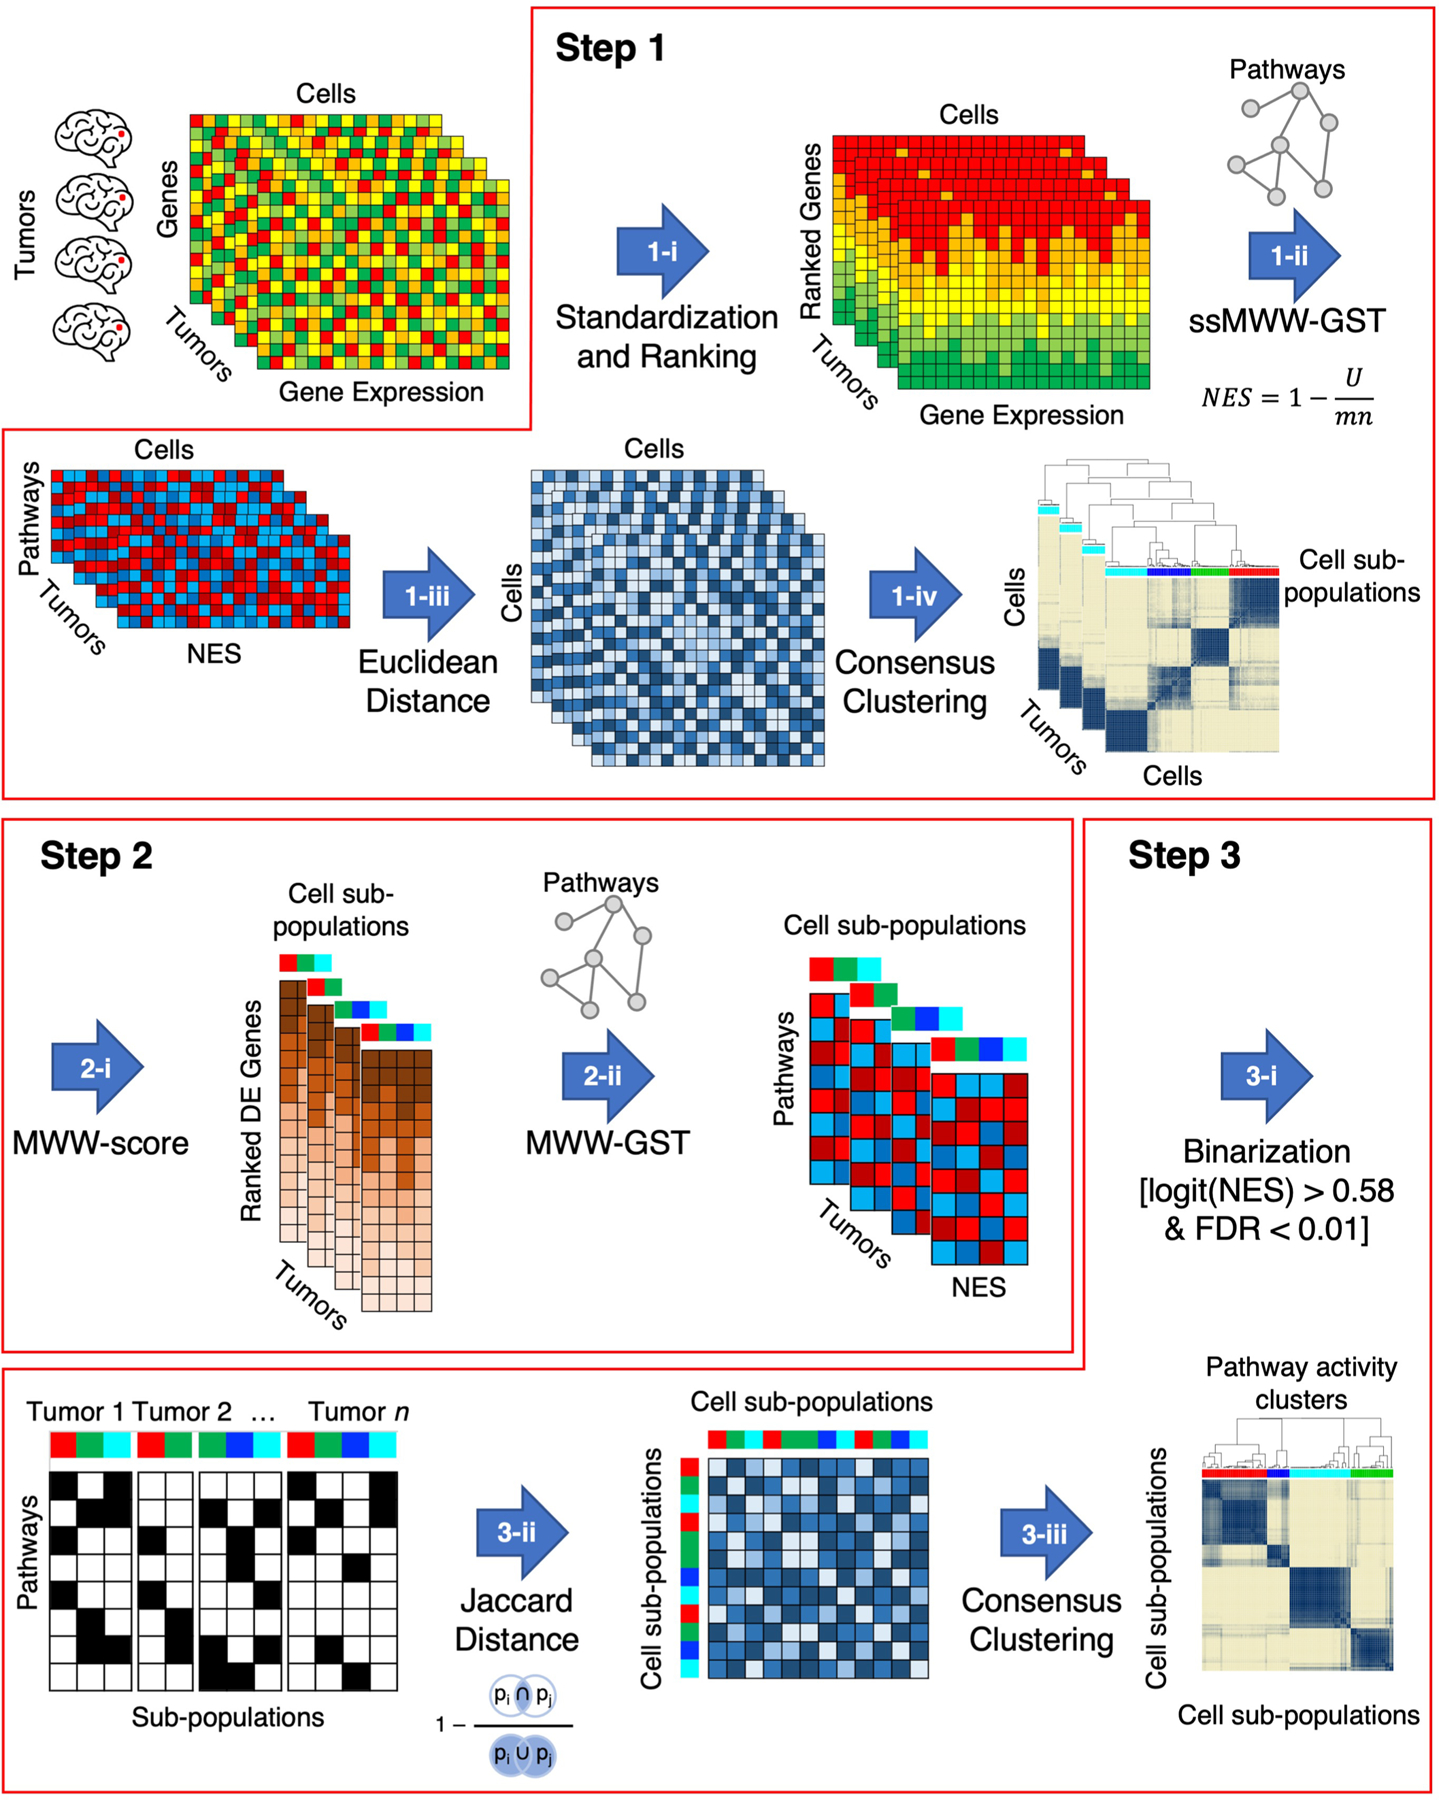
Step 1: identification of cell sub-populations of cells in each individual tumor that share activation of similar biological functions; Step 2: determination of enriched biological pathways in each cell sub-population by defining cluster-specific ranked-lists; Step 3: identification of cell sub-populations that share coherent biological functions across multiple tumors. In Step 1-i, the ranked list for each cell in each tumor is obtained by standardizing and ranking genes. The activity matrix (NES) of all cells composing each tumor is obtained by calculating the single-sample activity of all the 5,032 biological pathways with ssMWW-GST (Step 1-ii) and used to generate the Euclidean distance between every pair of cells in each tumor (Step 1-iii). Finally, the cell sub-populations of each tumor are identified by applying the consensus clustering on the basis of the Euclidean distance of the NES (Step 1-iv). In the following step (Step 2-i), the MWW-score is used to generate a cluster-specific ranked-list of genes for each cell sub-population by comparing the expression profiles of the cells in the cluster with all other cells in the same tumor. The enriched biological pathways of each cell sub-populations are derived in Step 2-ii by using MWW-GST as in Step 1-ii. Each cell sub-population is then represented by a binary vector, with 1 indicating the enriched biological pathways (Step 3-i) and the binary matrix is used in Step 3-ii to derive the Jaccard distance. In the last step, 3-iii, cell sub-populations are clustered by Jaccard distance using consensus clustering.
Extended Data Fig. 2 |. expression of subtype associated markers and mapping of marker genes on the population structure of neurodevelopmental subtype.
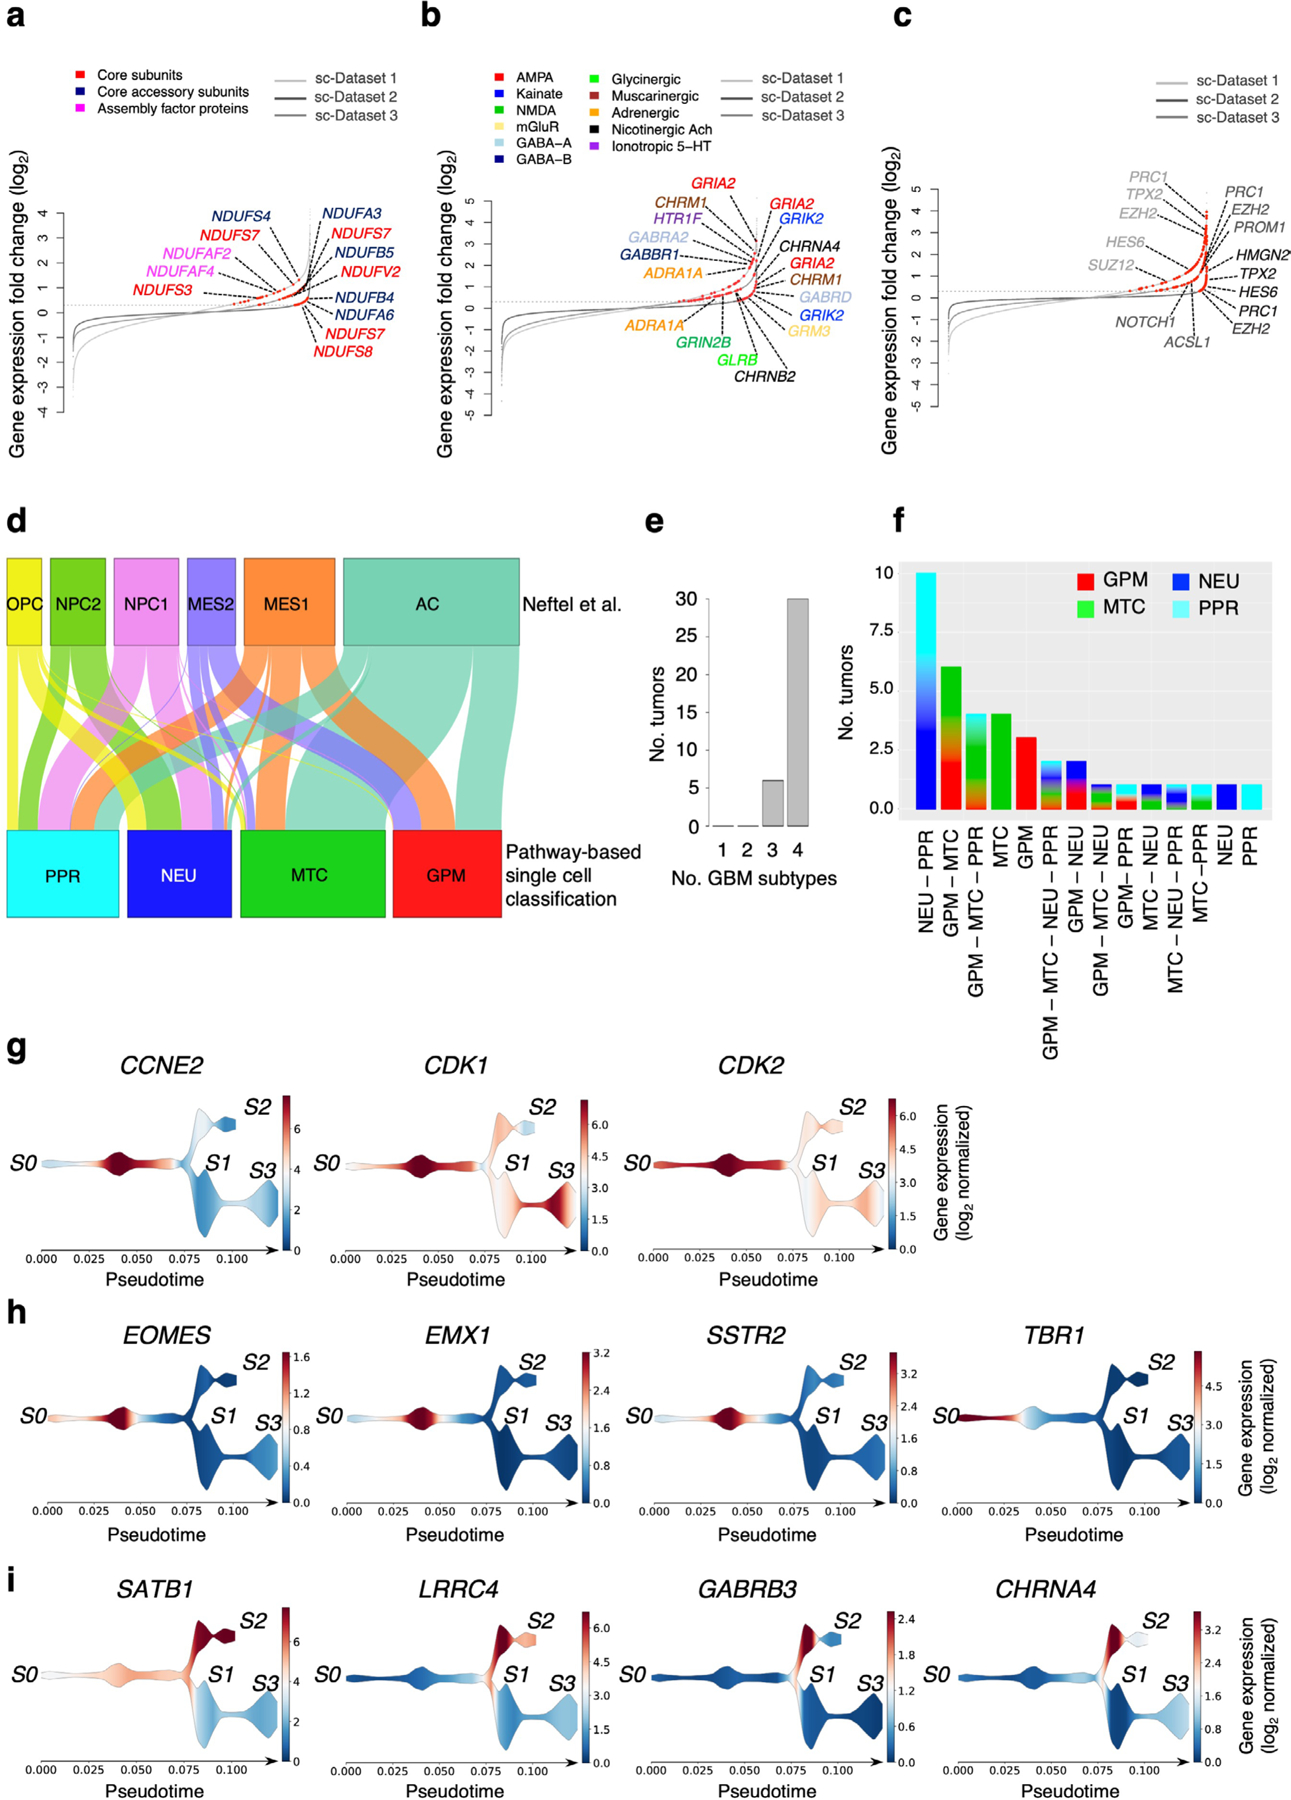
a, Rank order plot of changes in genes expressed in MTC cells versus the other groups. Genes are ranked from left to right in increasing expression order. Red dots indicate mitochondrial respiratory complex I genes differentially expressed in each single cell dataset [n = 2,799 cells for dataset 1, n = 9,652 cells for dataset 2, n = 4,916 cells for dataset 3; log2(FC) > 0.3 and FDR < 0.05, two-sided MWW test]. Representative genes upregulated in at least two out of three datasets are shown. Colors indicate complex I structural classes. b, Rank order plot of changes of genes expressed in NEU cells versus the other groups. Genes are ranked as in a. Red dots indicate neurotransmitter receptors differentially expressed in each single cell dataset [n = 2,799 cells for dataset 1, n = 9,652 cells for dataset 2, n = 4,916 cells for dataset 3; log2(FC) > 0.3 and FDR < 0.05, two-sided MWW test]. For each dataset, upregulated genes representing distinct neurotransmitter receptor families are indicated by different colors. c, Rank order plot of changes of genes expressed in PPR cells versus the other groups. Genes are ranked as in a, b. Red dots indicate neural progenitor marker genes differentially expressed in each single cell dataset [n = 2,799 cells for dataset 1, n = 9,652 cells for dataset 2, n = 4,916 cells for dataset 3; log2(FC) > 0.3 and FDR < 0.05, two-sided MWW test]. Representative genes differentially expressed in at least two out of three single cell datasets are indicated. d, Sankey diagram showing subtype assignment of single glioma cells according to scBiPaD classification and the described cell states4. e, Bar plot of the number of tumors and states in each of the 36 samples of the single cell cohort. f, Bar plot showing functional cell state (at least 15% of cells in the sample) composition of 36 GBM samples. g, Stream plots of proliferation markers expressed by the PPR cells at the tumor core. h, Stream plots of neural progenitor markers. Expression overlaps with proliferation markers and is excluded from the more differentiated cells at the tumor periphery. The newly born neuron marker TBR1 is expressed in a subset of cells of the neurodevelopment branch. i, Stream plots of synaptic and neurotransmitter receptor genes in non-proliferative cells at the invasive rim. Color scale indicates the log2 normalized expression of the indicated gene.
Extended Data Fig. 3 |. Analysis of survival-associated biological pathways in single glioma cells.
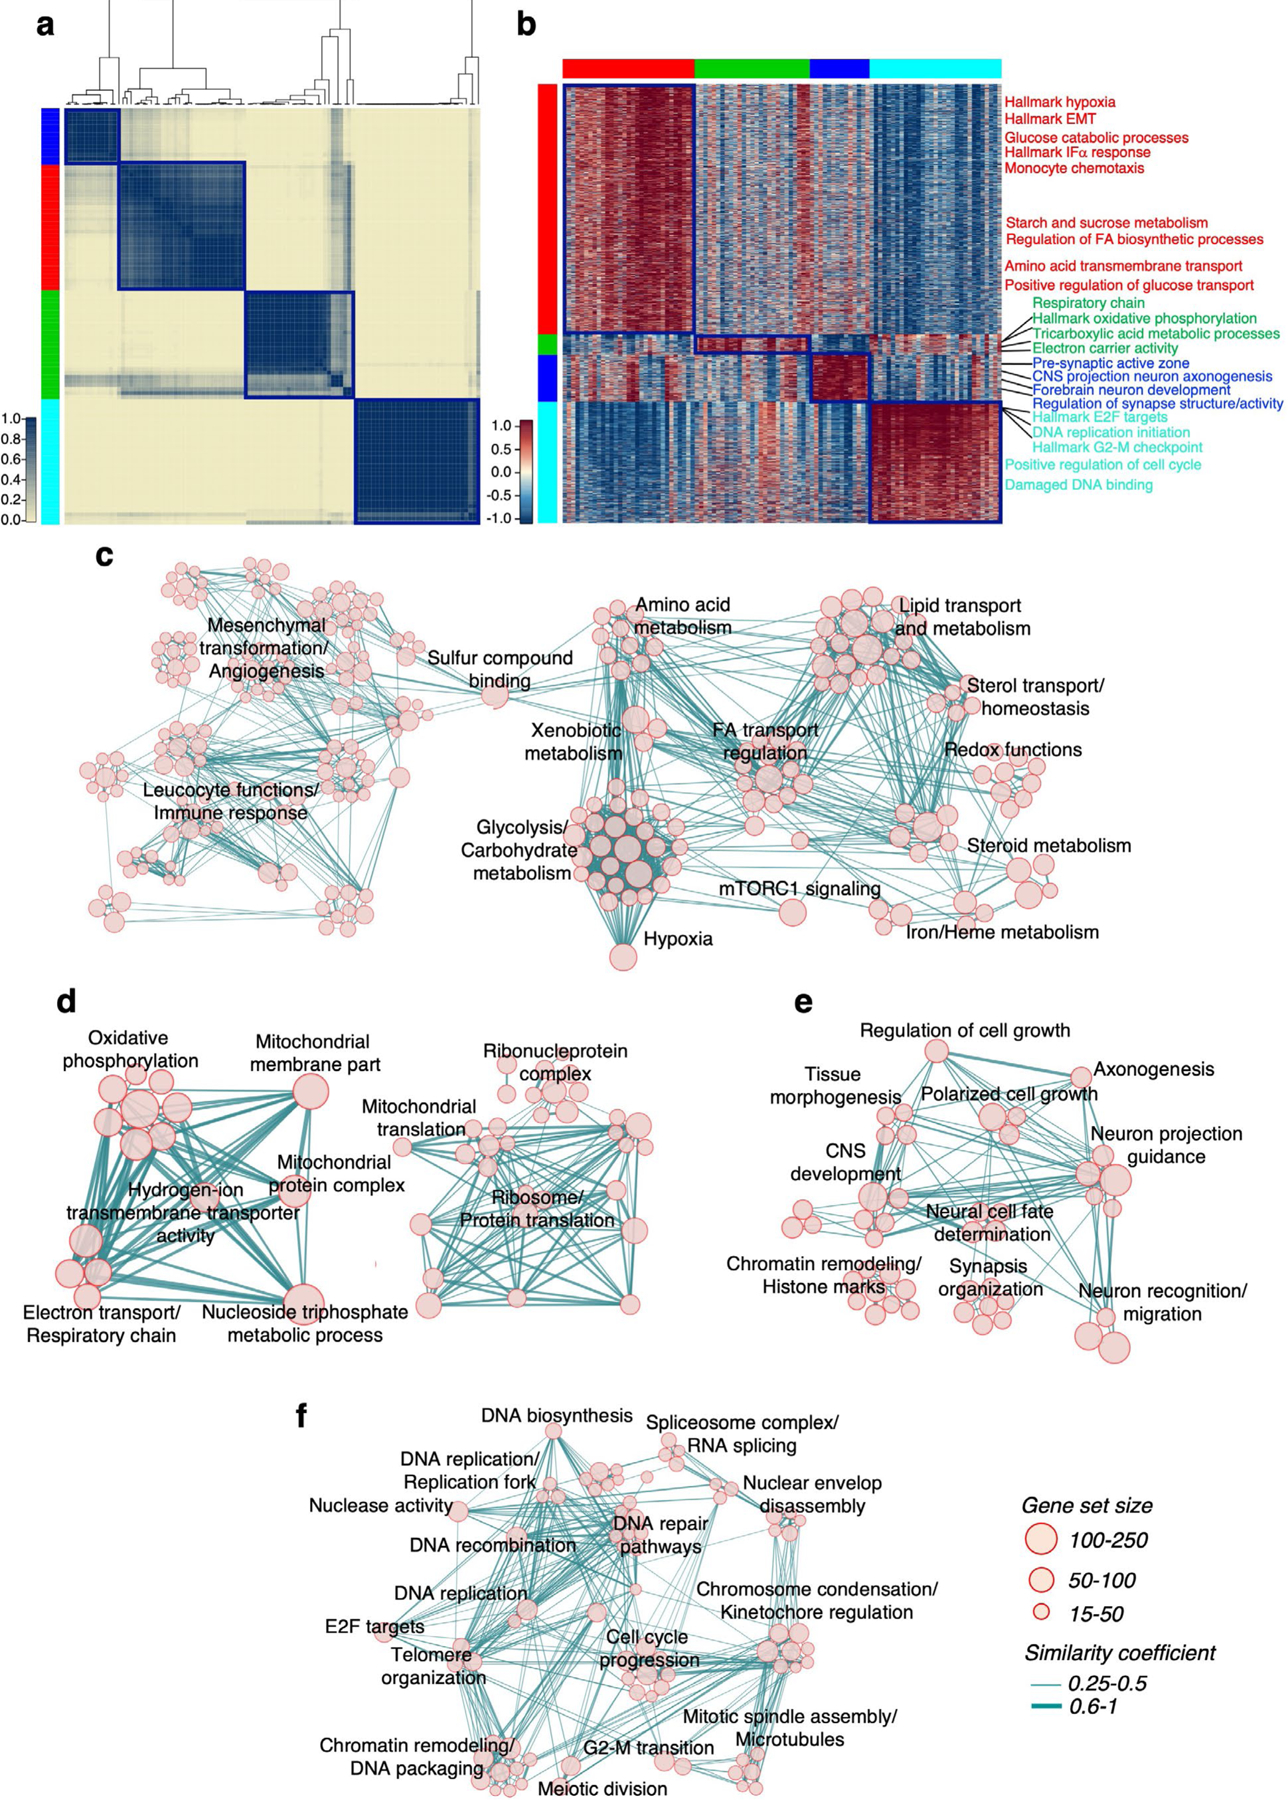
a, Consensus clustering of 103 cell sub-populations from the three single cell datasets obtained using 192 biological pathways significantly associated with patient survival. Columns and rows are cell sub-populations. Left track: red, GPM; green, MTC; blue, NEU; cyan, PPR. b, Heatmap of the biological activities of cell sub-populations in a. Each group was defined by shared activated pathways among the 5,032-pathway collection (n = 103 cell sub-populations; effect size > 0.3, FDR < 0.0001, two-sided MWW test). Columns are cell sub-populations, rows are pathway activities. Pathway activity level is color-coded. Representative pathways specifically activated in each of the four functional subtypes are indicated. Left and top tracks are as in a. c, Enrichment map network of statistically significant and not redundant GO categories [logit(NES) > 0.58 and FDR < 0.05, two-sided MWW-GST] in GPM; d, MTC; e, NEU; f, PPR medoids. Nodes are GO terms and lines their connectivity. Node size is proportional to number of genes in the GO category; line thickness indicates similarity coefficient. The right-hand side of the network in c was magnified 1.5-fold for a better visualization of the significant activities.
Extended Data Fig. 4 |. t-SNe plot visualization of tumors and functional cell states in single glioma cells.
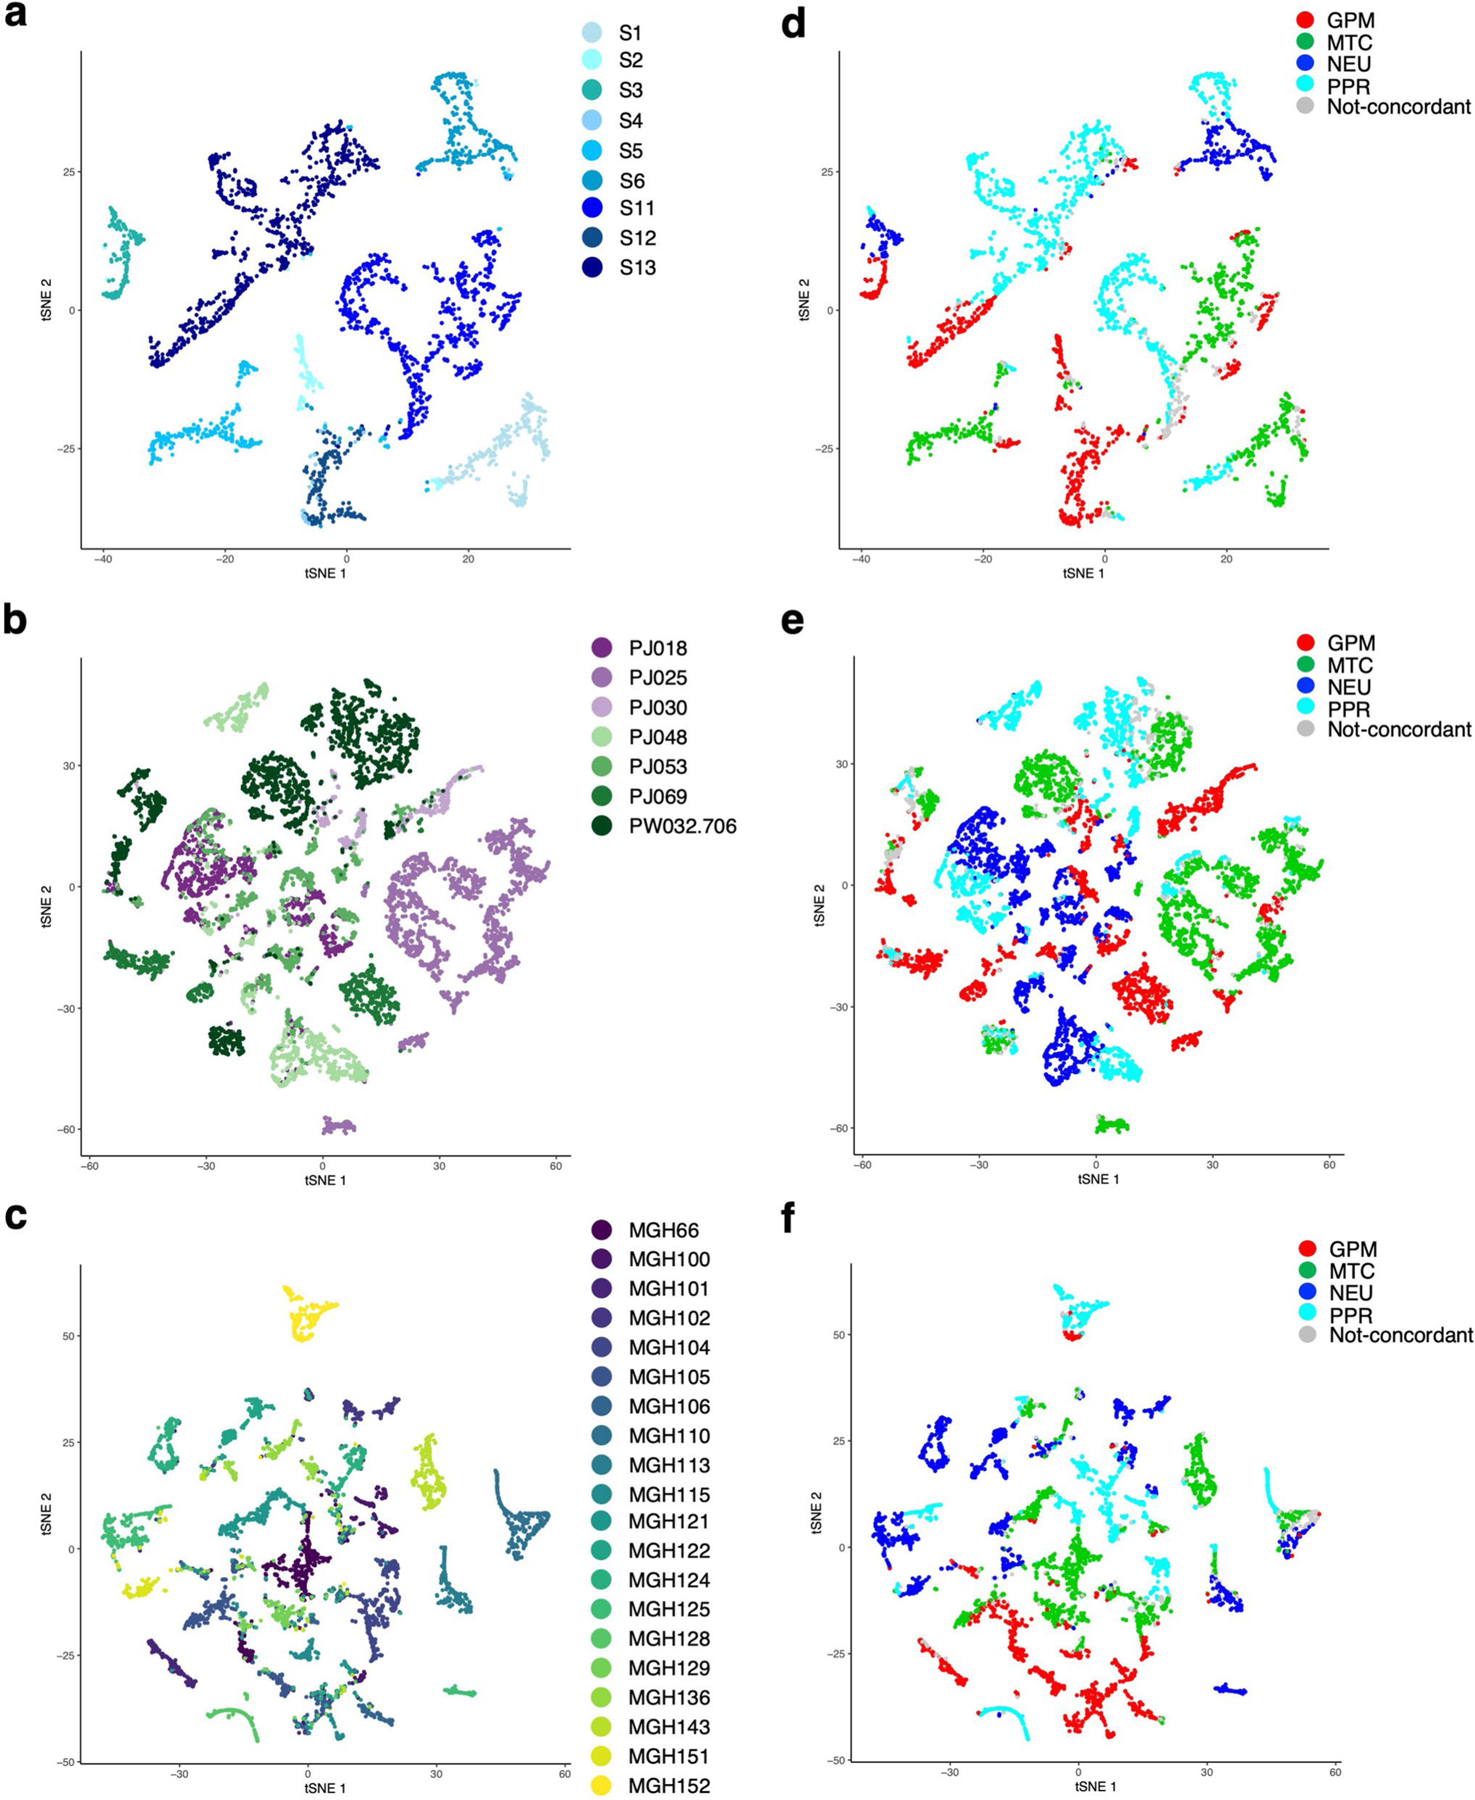
a, t-SNE plot of malignant cells colored by tumor from dataset 1; b, dataset 2; c, dataset 3. d, t-SNE plot of malignant cells from dataset 1 colored according to functional states; e, t-SNE plot of malignant cells from dataset 2 colored according to functional states; f, t-SNE plot of malignant cells from dataset 3 colored according to functional states. Cells concordantly classified using 5,032 or 192 pathways are colored: red, GPM; green, MTC; blue, NEU; cyan, PPR; grey, cells not concordantly classified.
Extended Data Fig. 5 |. Characterization of biological subtypes of bulk primary GBM.
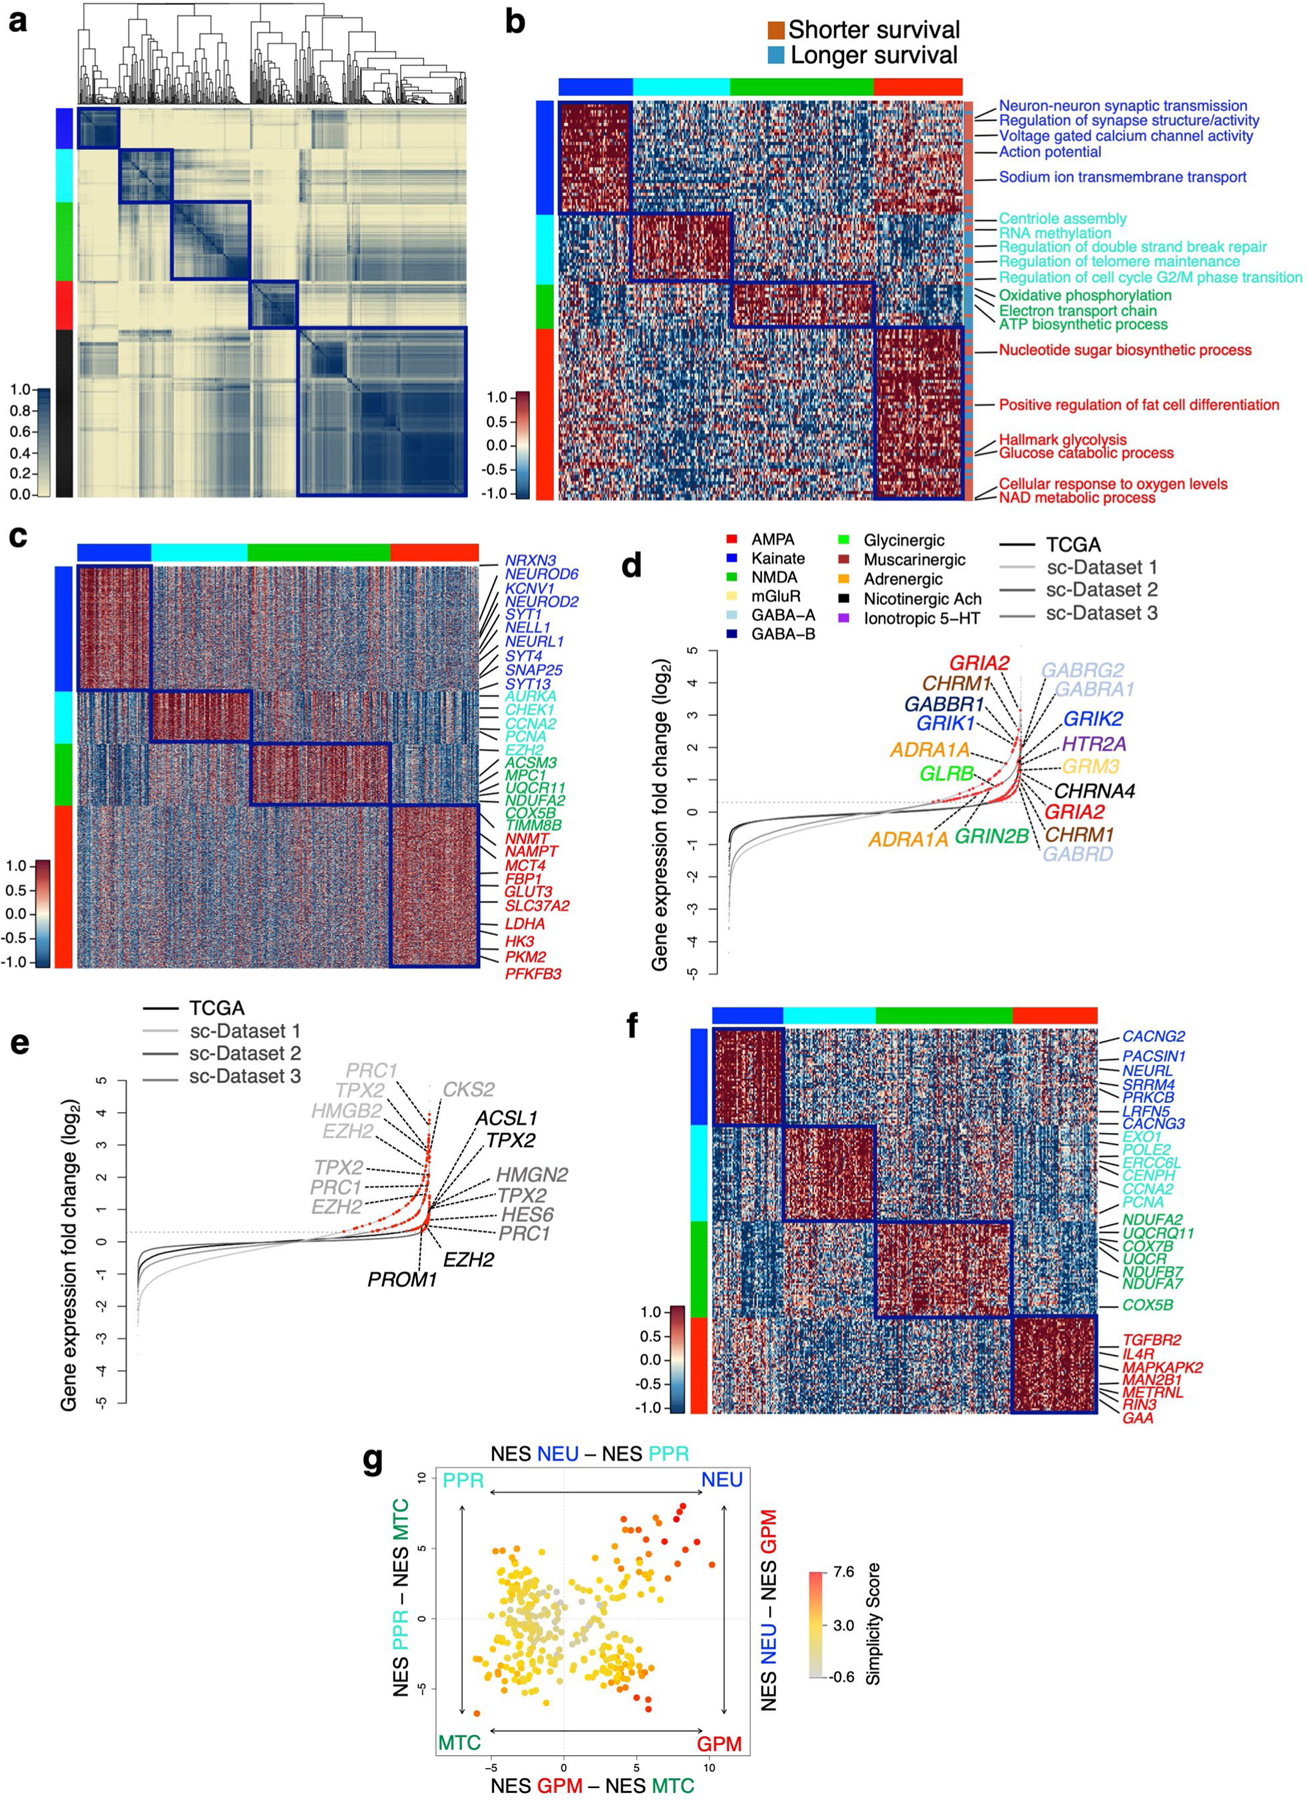
a, Consensus clustering of 534 GBM on the activity of 192 survival-associated pathways (p < 0.05, log-rank test; p-value of individual pathways are reported in Supplementary Table 6b). Columns and rows are individual tumors. Left track: red, GPM; green, MTC; blue, NEU; cyan, PPR; black, unclassified. b, Heatmap of pathway activity in 304 classified GBM including 126 out of 192 survival-associated and differentially active pathways in the four GBM subtypes (effect size > 0.3 and FDR < 0.01, two-sided MWW test). Columns are individual tumors and rows are pathway activity. Pathways characteristically activated in each core subtype are indicated. Left and top tracks: red, GPM; green, MTC; blue, NEU; cyan, PPR. c, Heatmap of genes differentially expressed and upregulated in GBM subtypes (n = 304 tumors; Kruskal-Wallis analysis with post hoc correction by Nemenyi’s test for multiple comparison; FDR < 0.01 and log2(FC) > 0.5). Columns are individual tumors, rows are genes. Representative genes specifically upregulated in each GBM subtype are indicated. Tracks are as in b. d, Rank order plot of changes of genes expressed in GBM NEU. Genes are ranked from left to right in increasing expression order. Red dots indicate neurotransmitter receptors differentially expressed in NEU tumors and cells (n = 2,799 cells for dataset 1, n = 9,652 cells for dataset 2, n = 4,916 cells for dataset 3, n = 304 tumors for TCGA dataset; log2(FC) > 0.3, FDR < 0.05, two-sided MWW test). For each dataset, upregulated genes in neurotransmitter receptor families are indicated by colors. e, Rank order plot of changes of genes expressed in GBM PPR. Genes are ranked as in d. Red dots indicate neural progenitor genes differentially expressed in each dataset (n = 2,799 cells for dataset 1, n = 9,652 cells for dataset 2, n = 4,916 cells for dataset 3, n = 304 tumors for TCGA dataset; log2(FC) > 0.3, FDR < 0.05, two-sided MWW test). Representative genes differentially expressed in at least three datasets are indicated. f, Heatmap showing the 50 highest scoring genes of the four GBM subtypes-specific signatures. Rows are genes and columns are tumors (n = 304 tumors). Track are as in b, c. g, Two-dimensional representation of GBM subtype enrichment scores (n = 304 tumors). Quadrant are GBM subtypes, the position of dots (tumors) reflects the relative subtype-specific score of each tumor as indicated by x- and y-axes, and their color the subtype simplicity score. Gray, tumors that do not fall in the respective subtype quadrant.
Extended Data Fig. 6 |. Validation of the biological classification of GBM and comparison with established classifiers.
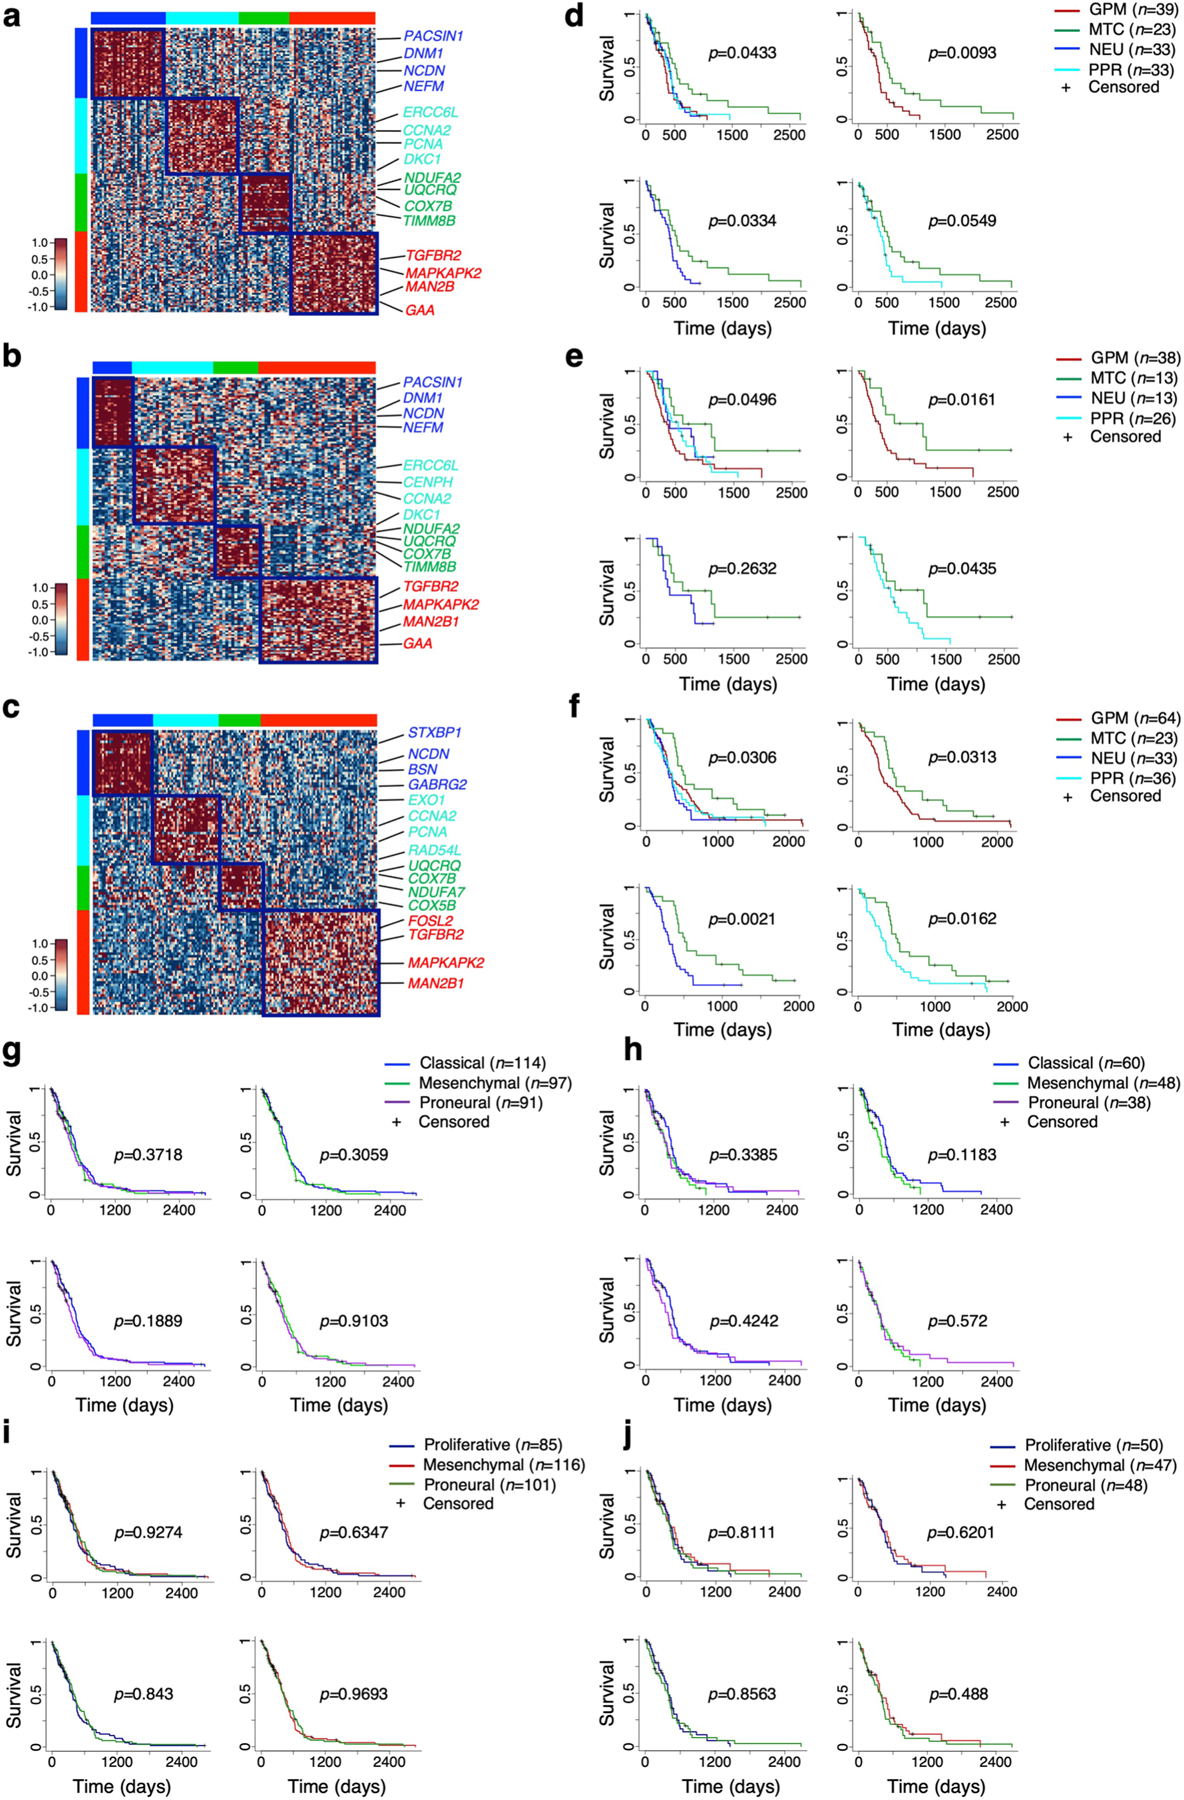
Subtype-specific gene signatures were used to classify GBM from independent cohorts. a, Heatmap of GBM from the TCGA cohort profiled by RNA-seq (n = 129 tumors). b, Heatmap of GBM from the CGGA cohort (n = 94 tumors). c, Heatmap of GBM69 (n = 158 tumors). d, Kaplan-Meier of patients in a (128 out of 129 patients with survival data available). e, Kaplan-Meier of patients in b (90 out of 94 patients with survival data available). f, Kaplan-Meier of patients in c (156 out of 158 patients with survival data available). Patients were stratified according to the four biological subtypes; survival differences were assessed using the log-rank test. g, Kaplan-Meier of patients with GBM from the TCGA cohort profiled by Agilent microarray (n = 302 patients, log-rank test) and h, Patients with GBM from the TCGA cohort profiled by RNA-seq (n = 145 patients, log-rank test) classified according to mesenchymal, proneural and classical subtype. i, Kaplan-Meier of GBM patients as in g and j, patients as in h classified according to mesenchymal, proneural and proliferative subtype.
Extended Data Fig. 7 |. Analysis of the tumor microenvironment and GBM driver alterations in the biological GBM subtypes.
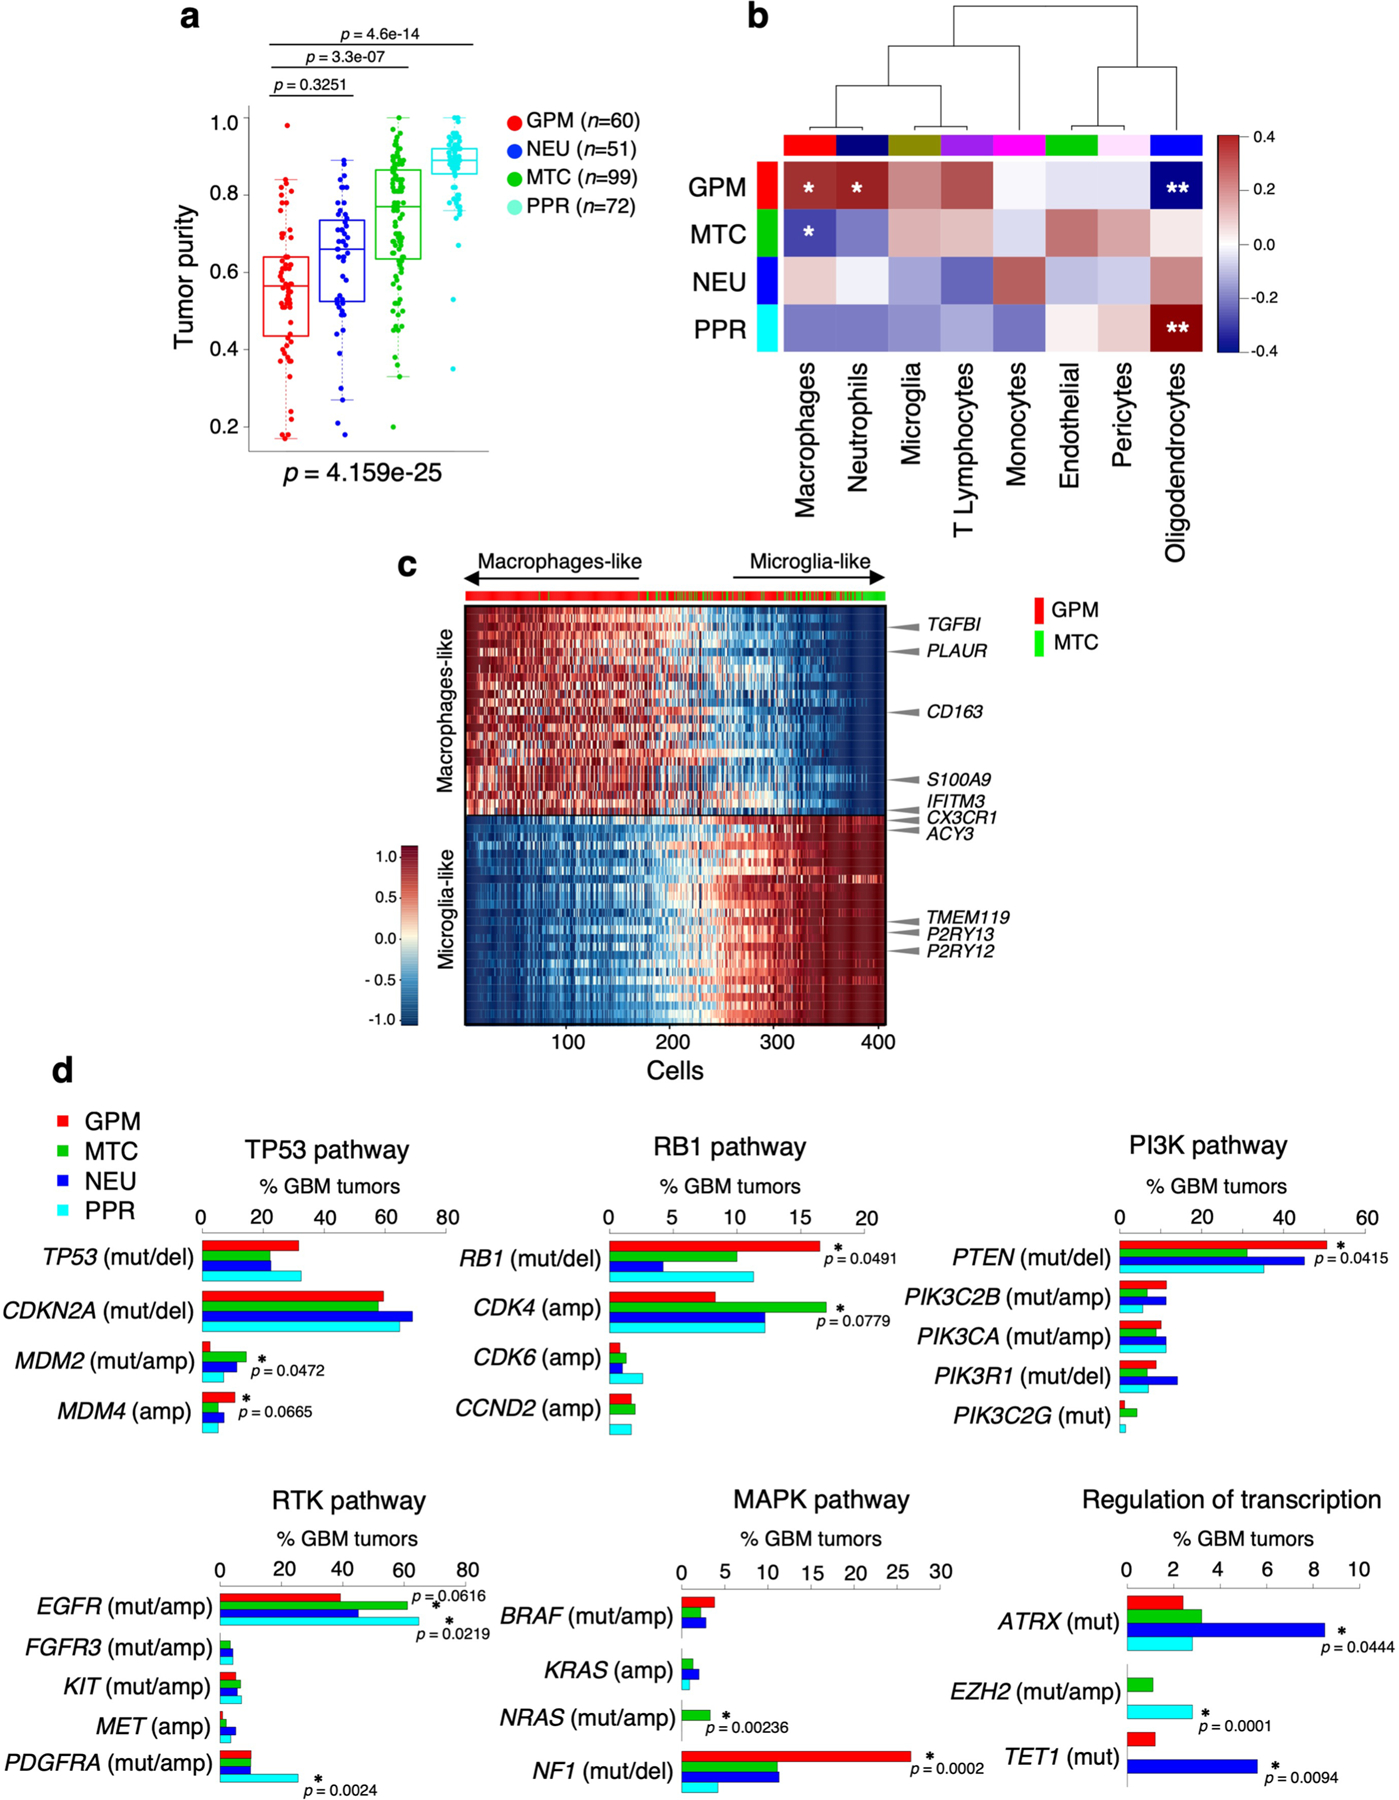
a, Box plots of GBM subtypes tumor purity scores computed by ABSOLUTE; p-values: Kruskal-Wallis test with Nemenyi post hoc correction for multiple comparison (n = 282 tumors). Box plots span the first to third quartiles and whiskers show the 1.5× interquartile range. b, Correlation analysis of nontumor cell fraction in relationship with GBM cell state fraction (n = 36 tumors; Spearman’s correlation; p = 0.089 GPM versus macrophages; p = 0.067 GPM versus neutrophils; p = 0.017 GPM versus oligodendrocytes; p = 0.092 MTC versus macrophages; p = 0.026 PPR versus oligodendrocytes; *p < 0.10; **p < 0.05). Rows are GBM cell states. Columns are non-tumor cell types. Blue to red scale indicates negative to positive correlation. c, Heatmap of the expression of the top 25 microglia- and macrophage-specific genes in nontumor cells from two GPM and two MTC GBM from single cell dataset 1. Cells are ordered by gene expression fold-change of macrophage- versus microglia-specific genes. The top horizontal track shows in red and green nontumor cells from GBM whose tumor cells have a dominant GPM (S4_D1, n = 67 cells, and S12_D1, n = 246 cells) or MTC state (S1_D1, n = 65 cells, and S5_D1, n = 29 cells), respectively. Representative microglia and macrophages marker genes are indicated. d, Bar plots showing the frequency distribution of GBM driver genes grouped by signaling pathways across GBM subtypes. Asterisks indicate the statistical significance (n = 496 tumors; two-sided Fisher’s exact test).
Extended Data Fig. 8 |. Characterization of GBM biological states by multi-omics data analysis.
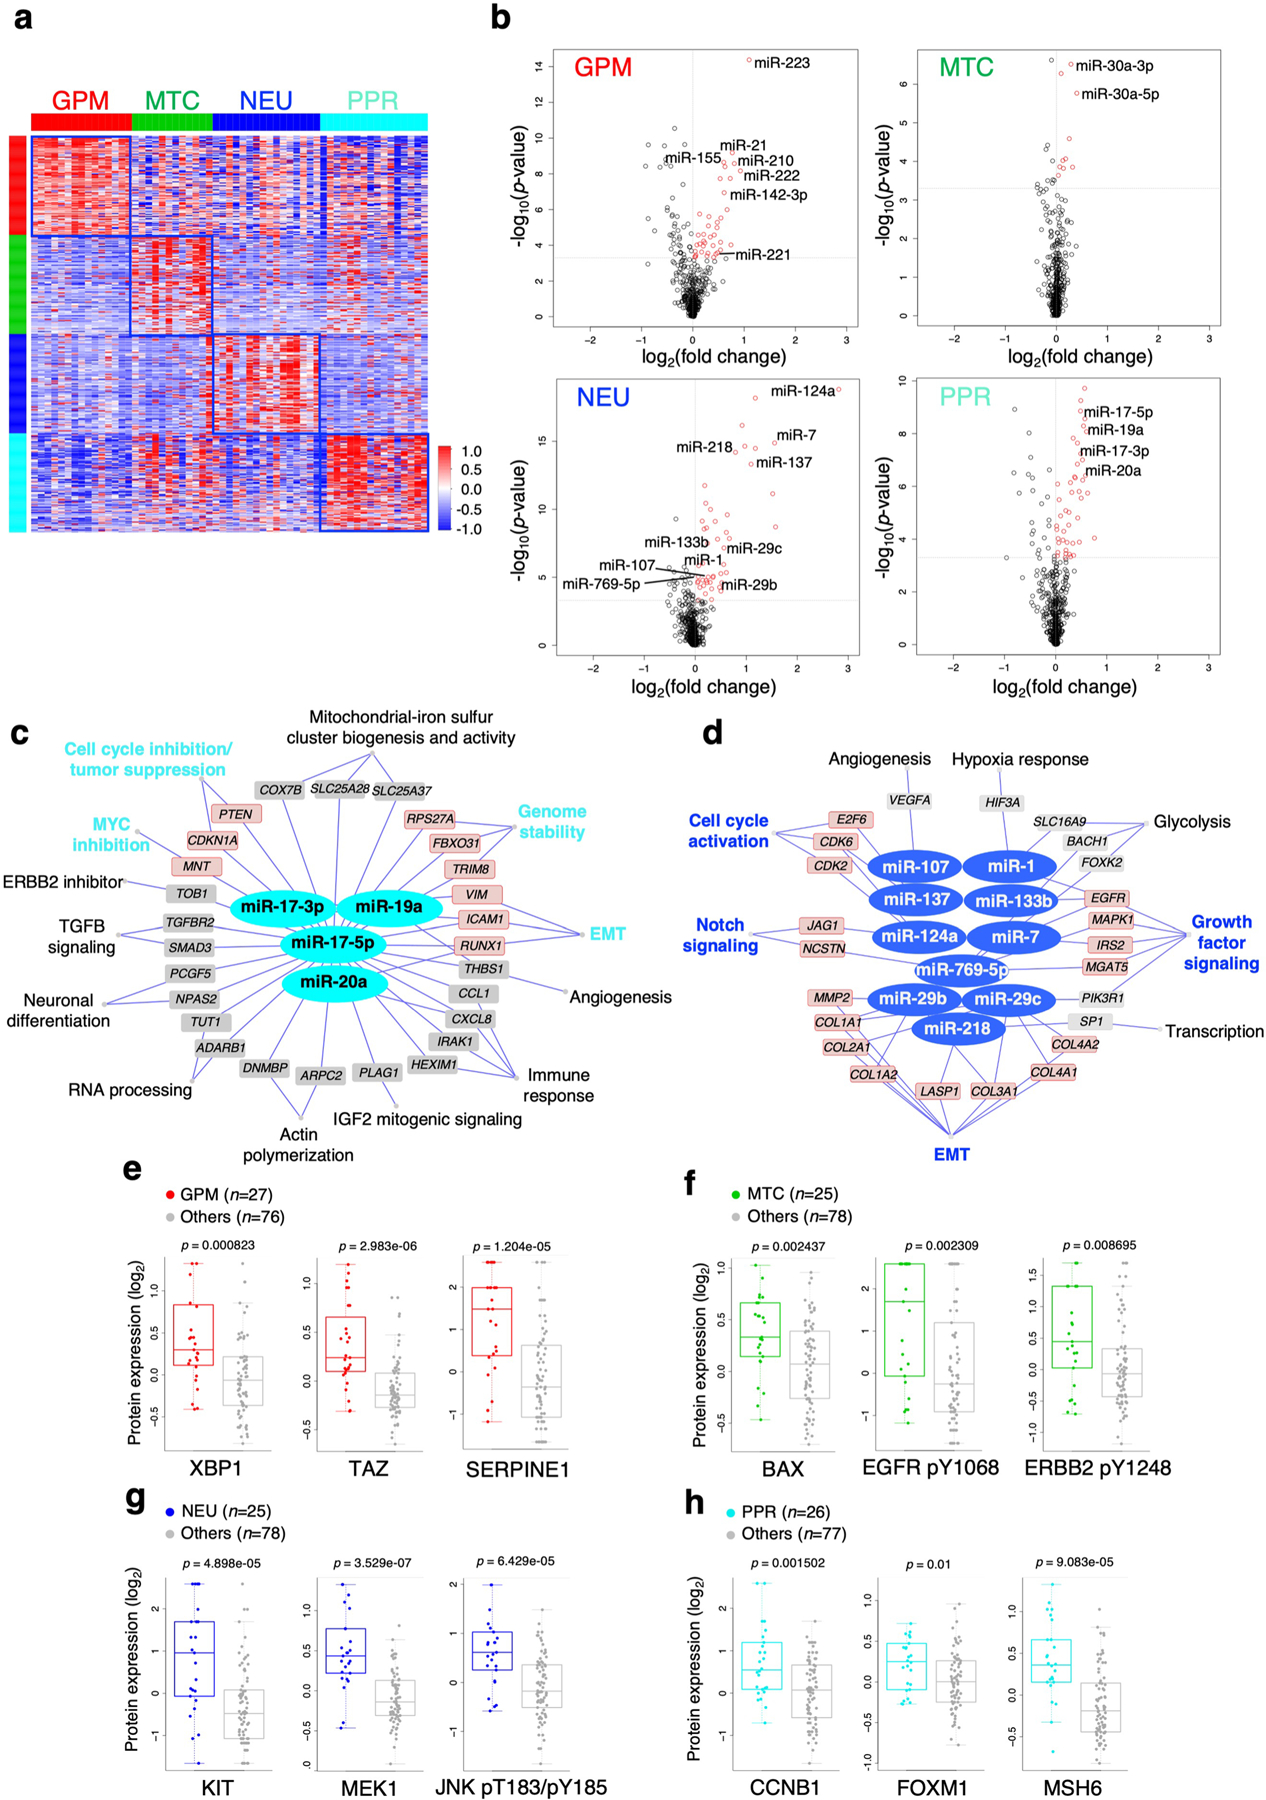
a, Heatmap of the M-values of the 100 probes most differentially methylated between GBM subtypes (n = 59 tumors; two-sided MWW test, p < 0.01 and absolute methylation log2(fold-change) > 0.58). b, Volcano plots of differentially expressed miRNA. Upregulated miRNAs in each GBM subtype are indicated in red [n = 294 tumors; log2(FC) ≥ 0 and p-value < 0.0005, two-sided MWW test]. Vertical and horizontal gray lines demarcate log2(FC) and p-value cutoff, respectively. Representative miRNAs upregulated in each functional subtype are indicated. c, Representative miRNA-gene targets networks significantly upregulated in PPR and d, NEU GBM subtypes [n = 294 tumors; log2(FC) > 0 and p < 0.0005, two-sided MWW test]. miRNA targets whose expression was anti-correlated with miRNA expression are listed (n = 294 tumors; Spearman’s correlation, ρ < 0 and p < 0.05) and biological pathways regulated by miRNA-target activity are indicated. Red nodes indicate miRNA targets of interest for the biology of the specific GBM subtype. p-values of individual genes in a-d are reported in Supplementary Table 14a, c, d, respectively. e-h, Box plots showing the expression of selected proteins or phosphoproteins significantly up-regulated (n = 103 tumors; two-sided MWW test) by RPPA in e, GPM; f, MTC; g, NEU; h, PPR GBM. Box plots span the first to third quartiles and whiskers show the 1.5× interquartile range.
Extended Data Fig. 9 |. Genomic and metabolic characterization of GBM PDCs.
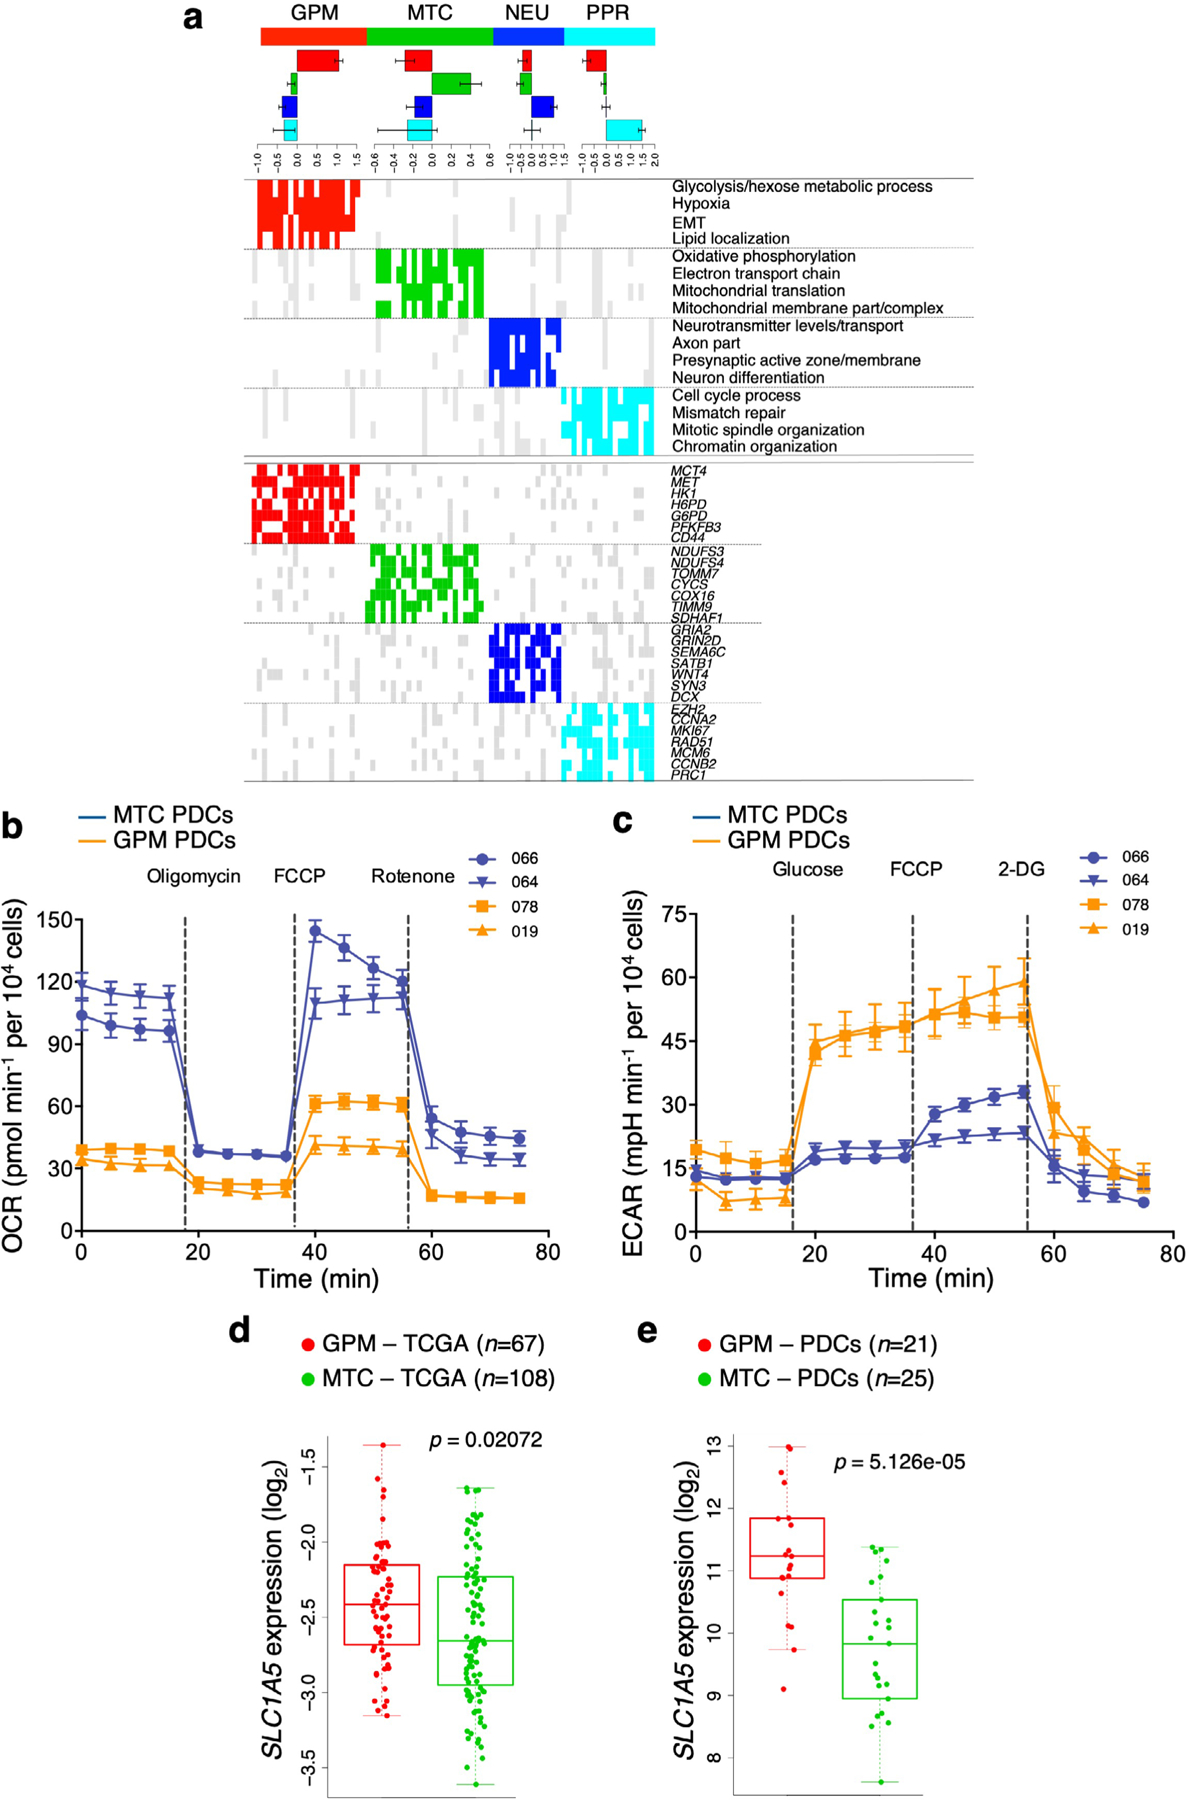
a, Classification of PDCs by random forest. Upper panel, bar plot showing mean ± s.d. of NES of subtype-specific biological activity in each PDC subgroup. Middle panel, representative biological pathways exhibiting differential activity among subtypes [n = 79 PDCs; logit(NES) > 0.3 and FDR < 0.05, two-sided MWW test]. Bottom panel, representative genes differentially expressed in PDC subtypes (n = 79 PDCs; log2(FC) > 0.3 and FDR < 0.05, two-sided MWW test). Red, green, blue, and cyan indicate significant pathway activation/gene up-regulation in PDCs classified as GPM, MTC, NEU or PPR, respectively; gray, pathway activation/gene up-regulation in any other subtype; white, lack of activation or up-regulation. b, OCR kinetics in 2 MTC PDCs each derived from an independent patient and 2 GPM PDCs each derived from an independent patient shows elevated OCR in MTC PDCs. Data are mean ± s.d. from one representative experiment for each PDC including n ≥9 replicates (see Source Data Extended Data Fig. 9). c, ECAR kinetics in 2 MTC PDCs each derived from an independent patient and 2 GPM PDCs each derived from an independent patient shows elevated glycolysis in GPM PDCs. Data are mean ± s.d. from one representative experiment for each PDC including n ≥7 replicates (see Source Data Extended Data Fig. 9). mpH, milli pH unit. Experiments were repeated two times with similar results. d, Box plots showing the expression of SLC1A5 in GPM (n = 67 tumors) and MTC (n = 108 tumors) primary GBM. e, Box plots showing the expression of SLC1A5 in GPM and MTC PDCs (n = 21 GPM PDCs each derived from an independent patient and n = 25 MTC PDCs each derived from an independent patient); p-value: two-sided MWW test. Box plots span the first to third quartiles and whiskers show the 1.5× interquartile range.
Extended Data Fig. 10 |. SLC45A1 is the target of chromosome 1p36.23 deletion in MTC GBM.
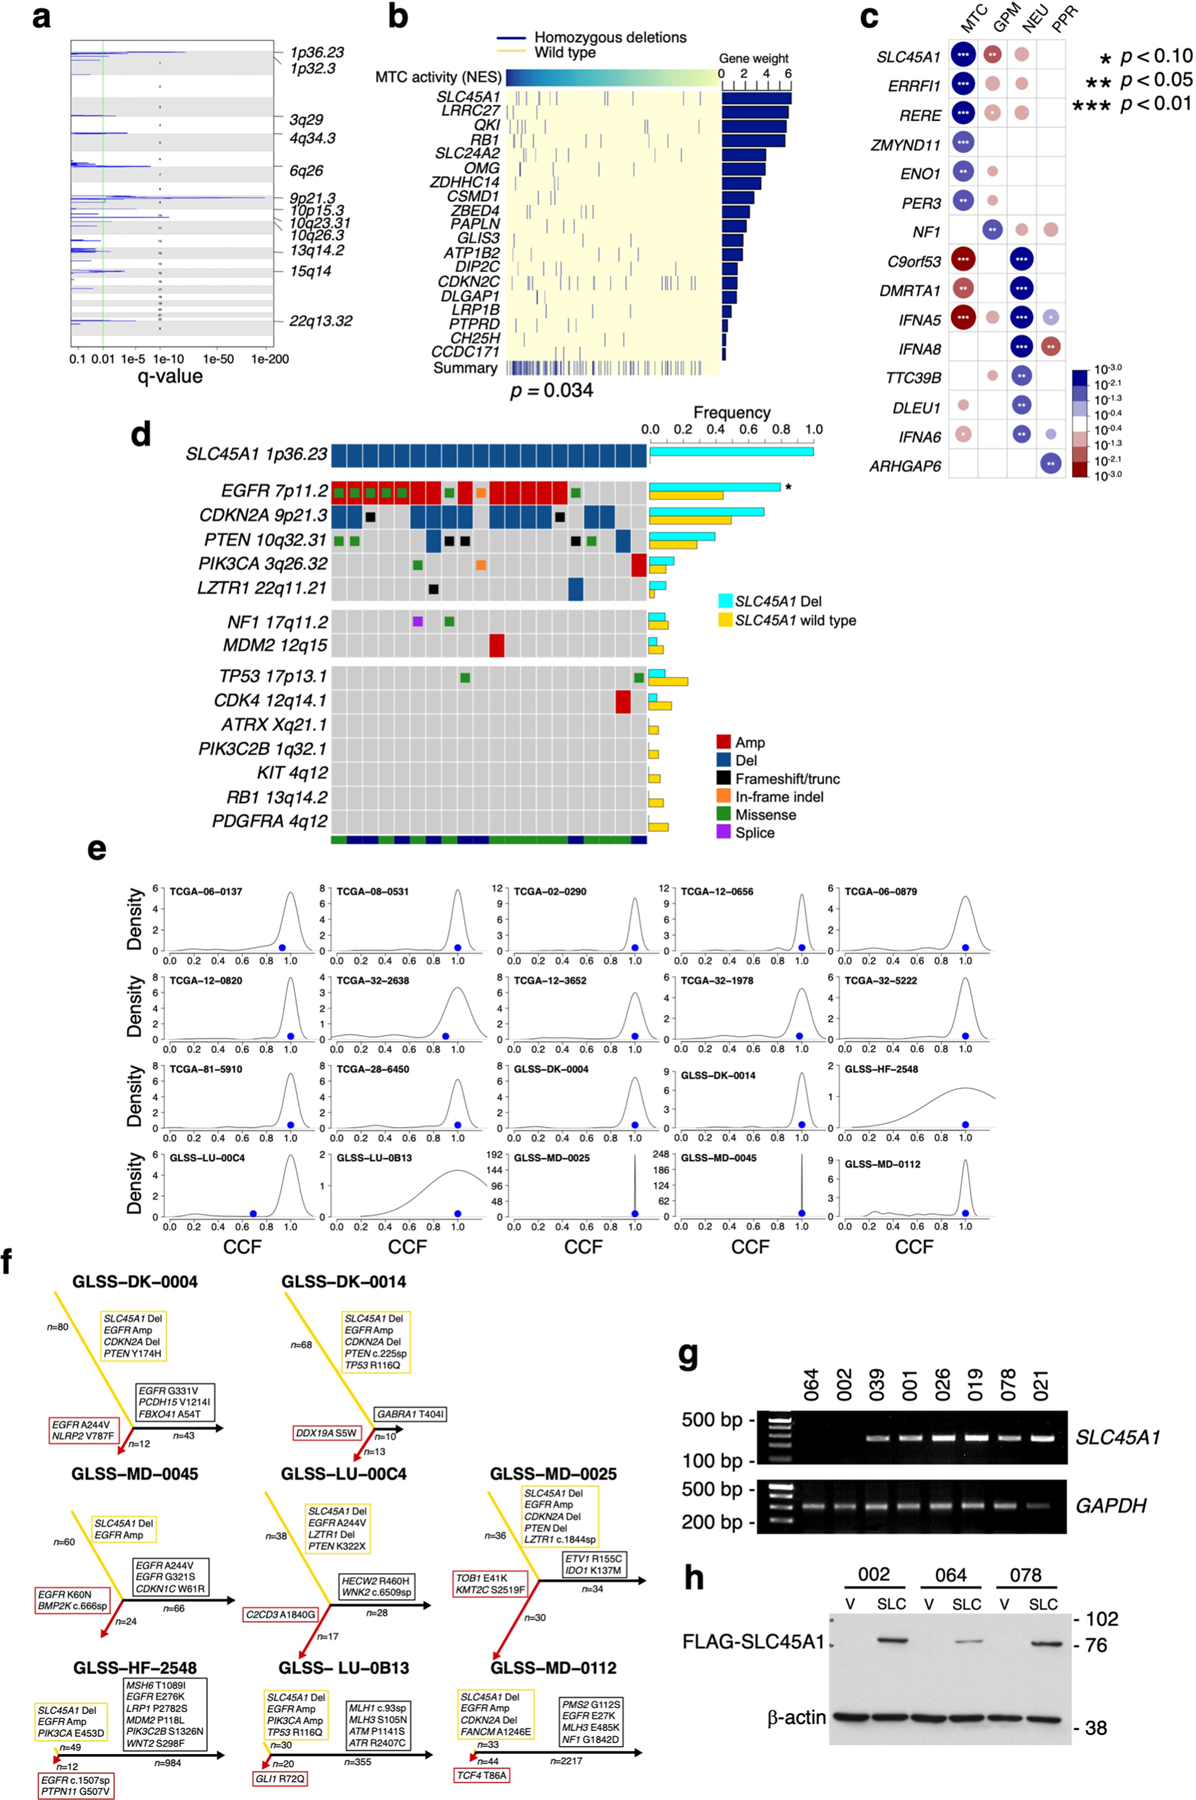
a, Schematics of chromosome location peak deletions in MTC GBM (n = 153 tumors) identified using GISTIC2 (Benjamini Hochberg FDR q-value < 0.01; q-value of chromosome bands are reported in Supplementary Table 16b). b, The matrix of homozygous deleted genes identified by UNCOVER as associated with MTC NES in primary GBM (n = 487 tumors; p = 0.034, permutation test). Top row, blue to yellow: higher to lower NES values for samples (columns). Deletions in each sample are in dark blue; samples not deleted are in yellow. The last row shows the alteration profile from the entire analysis. The bar plot on the right side indicates the gene weight for each alteration. c, Association of homozygous deletions in each GBM subtype. Circles are color-coded and their dimension reflects the -log10(p-value) of the enrichment (n = 487 tumors; p-value, two-sided Fisher’s exact test; see Supplementary Table 16g). Blue to red scale indicates positive to negative association. d, Frequency of genetic alterations of GBM driver genes in SLC45A1-deleted (n = 20 tumors) compared to SLC45A1 wild-type GBM (n = 705 tumors). The bottom track indicates the dataset (green, TCGA; blue, GLASS). Asterisk, p = 2.33e-03, two-sided Fisher’s Exact test (n = 725 tumors). e, Sample density plot depicting the relative frequency distribution of CCF estimated for the genetic alterations occurring in SLC45A1-deleted GBM (n = 20 tumors). Blue dot, CCF of SLC45A1 deletion. f, Evolutionary trees of genetic alterations in primary and recurrent SLC45A1-deleted GBM (n = 8 matched primary and recurrent tumor pairs); yellow, red and black branches are truncal, primary private and recurrent private alterations, respectively; the length of branches is proportional to the number of genetic alterations. GBM driver genes are indicated. g, PCR amplification of genomic DNA shows deletion of SLC45A1 in PDC-002 and PDC-064. h, Immunoblot of FLAG-SLC45A1 in PDC-002, PDC-064 (harboring SLC45A1 deletion) and PDC-078 (SLC45A1 wild type). Experiments in g, h were repeated two times with similar results. See Source Data Extended Data Fig. 10.
Supplementary Material
Acknowledgements
We thank D. Bigner (Duke University Medical Center, Durham, NC, USA) for the generous gift of H423 and H502 glioma cells. This work was supported by NIH grant nos. R01CA101644, U54CA193313, R01CA131126 and R01CA239721 (to A.L.); R01CA178546, U54CA193313, R01CA179044, R01CA190891 and R01CA239698; NCI P30 Supplement GBM CARE-HOPE; The Chemotherapy Foundation (to A.I.); and Italian Association for Cancer Research (AIRC) no. IG 2018 ID. 21846 (to M.C.). S.M. is recipient of a fellowship from AIRC.
Footnotes
Code availability
The source code used for the pathway-based classification and the code related to the figures of the study are available at GitHub: https://github.com/miccec/GBMstates.
Competing interests
A.L. and A.I. are inventors of a biomarker technology that has been licensed to QIAGEN. A.I. received sponsored research funding from AstraZeneca and Taiho Pharmaceutical and has served as a paid consultant/advisor to AIMEDBIO Inc. A.L. received sponsored research funding from Celgene. All other authors declare no competing interests.
Extended data is available for this paper at https://doi.org/10.1038/s43018-020-00159-4.
Supplementary information is available for this paper at https://doi.org/10.1038/s43018-020-00159-4.
Peer review information Nature Cancer thanks the anonymous reviewers for their contribution to the peer review of this work.
Data availability
Single-cell RNA-seq datasets 1, 2 and 3 are available from Gene Expression Omnibus (GEO, accession nos. GSE117891, GSE103224 and GSE131928, respectively). Single-cell RNA-seq read count data for the additional samples in dataset 2 (PJ053, PJ069 and PW032.706) and sequencing data for PDC samples (gene expression read counts, genetic mutations and copy number segmentation) have been submitted to Synapse (http://synapse.org, accession no. syn22314624). TCGA GBM data (Agilent chip G4502A and RNA-seq gene expression, somatic mutation calls, Affymetrix SNP 6.0 array copy number segmentation, Illumina Infinium Human Methylation 450k DNA methylation, Agilent miRNA and RPPA quantification) are available from the GDC Data Portal (https://portal.gdc.cancer.gov/). The CGGA GBM dataset is available from the CGGA data portal (http://cgga.org.cn/index.jsp). Data from ref. 69 are available from GEO (accession no. GSE13041). Data from ref. 17 are available at the Sequence Read Archive (SRA, accession no. SRP074425), European Genome-phenome Archive (EGA, accession nos. EGAS00001001033, EGAS00001000579, EGAS00001001044, EGAS00001001041 and EGAS00001001800) and the Japanese Genotype–Phenotype Archive (accession no. JGAS00000000004). The GBM longitudinal GLASS dataset is available from Synapse (http://synapse.org/glass). Source data for Figs. 5a–f,h,i, 6c, 7a–c,e–i and 8a–d,f,g,i–k and Extended Data Figs. 9b,c and 10g,h are provided as with this paper. All other data supporting the findings of this study are available from the corresponding author on reasonable request. Further information on research design is available in the Nature Research Reporting Summary linked to this article.
References
- 1.Cieslik M & Chinnaiyan AM Cancer transcriptome profiling at the juncture of clinical translation. Nat. Rev. Genet 19, 93–109 (2018). [DOI] [PubMed] [Google Scholar]
- 2.Verhaak RG et al. Integrated genomic analysis identifies clinically relevant subtypes of glioblastoma characterized by abnormalities in PDGFRA, IDH1, EGFR, and NF1. Cancer Cell 17, 98–110 (2010). [DOI] [PMC free article] [PubMed] [Google Scholar]
- 3.Wang Q et al. Tumor evolution of glioma-intrinsic gene expression subtypes associates with immunological changes in the microenvironment. Cancer Cell 32, 42–56 (2017). [DOI] [PMC free article] [PubMed] [Google Scholar]
- 4.Neftel C et al. An integrative model of cellular states, plasticity, and genetics for glioblastoma. Cell 178, 835–849 (2019). [DOI] [PMC free article] [PubMed] [Google Scholar]
- 5.Kim S, Kon M & DeLisi C Pathway-based classification of cancer subtypes. Biol. Direct 7, 21 (2012). [DOI] [PMC free article] [PubMed] [Google Scholar]
- 6.Yu K et al. Surveying brain tumor heterogeneity by single-cell RNA-sequencing of multi-sector biopsies. Natl Sci. Rev 7, 1306–1318 (2020). [DOI] [PMC free article] [PubMed] [Google Scholar]
- 7.Yuan J et al. Single-cell transcriptome analysis of lineage diversity in high-grade glioma. Genome Med 10, 57 (2018). [DOI] [PMC free article] [PubMed] [Google Scholar]
- 8.Leone G, Abla H, Gasparre G, Porcelli AM & Iommarini L The Oncojanus paradigm of respiratory complex I. Genes (Basel) 9, 243 (2018). [DOI] [PMC free article] [PubMed] [Google Scholar]
- 9.Venkataramani V et al. Glutamatergic synaptic input to glioma cells drives brain tumour progression. Nature 573, 532–538 (2019). [DOI] [PubMed] [Google Scholar]
- 10.Chen H et al. Single-cell trajectories reconstruction, exploration and mapping of omics data with STREAM. Nat. Commun 10, 1903 (2019). [DOI] [PMC free article] [PubMed] [Google Scholar]
- 11.Phillips HS et al. Molecular subclasses of high-grade glioma predict prognosis, delineate a pattern of disease progression, and resemble stages in neurogenesis. Cancer Cell 9, 157–173 (2006). [DOI] [PubMed] [Google Scholar]
- 12.Carter SL et al. Absolute quantification of somatic DNA alterations in human cancer. Nat. Biotechnol 30, 413–421 (2012). [DOI] [PMC free article] [PubMed] [Google Scholar]
- 13.Caruso FP et al. A map of tumor–host interactions in glioma at single-cell resolution. Gigascience 9, giaa109 (2020). [DOI] [PMC free article] [PubMed] [Google Scholar]
- 14.Frattini V et al. A metabolic function of FGFR3–TACC3 gene fusions in cancer. Nature 553, 222–227 (2018). [DOI] [PMC free article] [PubMed] [Google Scholar]
- 15.Zhang J et al. The combination of neoantigen quality and T lymphocyte infiltrates identifies glioblastomas with the longest survival. Commun. Biol 2, 135 (2019). [DOI] [PMC free article] [PubMed] [Google Scholar]
- 16.Venteicher AS et al. Decoupling genetics, lineages, and microenvironment in IDH-mutant gliomas by single-cell RNA-seq. Science 355, eaai8478 (2017). [DOI] [PMC free article] [PubMed] [Google Scholar]
- 17.Wang J et al. Clonal evolution of glioblastoma under therapy. Nat. Genet 48, 768–776 (2016). [DOI] [PMC free article] [PubMed] [Google Scholar]
- 18.D’Angelo F et al. The molecular landscape of glioma in patients with neurofibromatosis 1. Nat. Med 25, 176–187 (2019). [DOI] [PMC free article] [PubMed] [Google Scholar]
- 19.Koh EH et al. Mitochondrial activity in human white adipocytes is regulated by the ubiquitin carrier protein 9/microRNA–30a axis. J. Biol. Chem 291, 24747–24755 (2016). [DOI] [PMC free article] [PubMed] [Google Scholar]
- 20.Koh EH et al. miR-30a remodels subcutaneous adipose tissue inflammation to improve insulin sensitivity in obesity. Diabetes 67, 2541–2553 (2018). [DOI] [PMC free article] [PubMed] [Google Scholar]
- 21.Li L et al. miR-30a-5p suppresses breast tumor growth and metastasis through inhibition of LDHA-mediated Warburg effect. Cancer Lett 400, 89–98 (2017). [DOI] [PubMed] [Google Scholar]
- 22.Chan SY et al. MicroRNA-210 controls mitochondrial metabolism during hypoxia by repressing the iron-sulfur cluster assembly proteins ISCU1/2. Cell Metab 10, 273–284 (2009). [DOI] [PMC free article] [PubMed] [Google Scholar]
- 23.Favaro E et al. MicroRNA-210 regulates mitochondrial free radical response to hypoxia and Krebs cycle in cancer cells by targeting iron sulfur cluster protein ISCU. PLoS ONE 5, e10345 (2010). [DOI] [PMC free article] [PubMed] [Google Scholar]
- 24.Papagiannakopoulos T, Shapiro A & Kosik KS MicroRNA-21 targets a network of key tumor-suppressive pathways in glioblastoma cells. Cancer Res 68, 8164–8172 (2008). [DOI] [PubMed] [Google Scholar]
- 25.Bobbili MR, Mader RM, Grillari J & Dellago H OncomiR-17–5p: alarm signal in cancer? Oncotarget 8, 71206–71222 (2017). [DOI] [PMC free article] [PubMed] [Google Scholar]
- 26.Sun G et al. miR-137 forms a regulatory loop with nuclear receptor TLX and LSD1 in neural stem cells. Nat. Commun 2, 529 (2011). [DOI] [PMC free article] [PubMed] [Google Scholar]
- 27.Liu Y et al. XBP1 silencing decreases glioma cell viability and glycolysis possibly by inhibiting HK2 expression. J. Neurooncol 126, 455–462 (2016). [DOI] [PubMed] [Google Scholar]
- 28.Koo JH & Guan KL Interplay between YAP/TAZ and metabolism. Cell Metab 28, 196–206 (2018). [DOI] [PubMed] [Google Scholar]
- 29.Gao ZY et al. Metformin induces apoptosis via a mitochondria-mediated pathway in human breast cancer cells in vitro. Exp. Ther. Med 11, 1700–1706 (2016). [DOI] [PMC free article] [PubMed] [Google Scholar]
- 30.Hirata T et al. Stem cell factor induces outgrowth of c-kit-positive neurites and supports the survival of c-kit-positive neurons in dorsal root ganglia of mouse embryos. Development 119, 49–56 (1993). [DOI] [PubMed] [Google Scholar]
- 31.Strauss B et al. Cyclin B1 is essential for mitosis in mouse embryos, and its nuclear export sets the time for mitosis. J. Cell Biol 217, 179–193 (2018). [DOI] [PMC free article] [PubMed] [Google Scholar]
- 32.Gong AH et al. FoxM1 drives a feed-forward STAT3-activation signaling loop that promotes the self-renewal and tumorigenicity of glioblastoma stem-like cells. Cancer Res 75, 2337–2348 (2015). [DOI] [PMC free article] [PubMed] [Google Scholar]
- 33.Breiman L Random forests. Mach. Learn 45, 5–32 (2001). [Google Scholar]
- 34.Cluntun AA, Lukey MJ, Cerione RA & Locasale JW Glutamine metabolism in cancer: understanding the heterogeneity. Trends Cancer 3, 169–180 (2017). [DOI] [PMC free article] [PubMed] [Google Scholar]
- 35.Petan T, Jarc E & Jusovic M Lipid droplets in cancer: guardians of fat in a stressful world. Molecules 23, 1941 (2018). [DOI] [PMC free article] [PubMed] [Google Scholar]
- 36.Fam TK, Klymchenko AS & Collot M Recent advances in fluorescent probes for lipid droplets. Materials (Basel) 11, 1768 (2018). [DOI] [PMC free article] [PubMed] [Google Scholar]
- 37.Mermel CH et al. GISTIC2.0 facilitates sensitive and confident localization of the targets of focal somatic copy-number alteration in human cancers. Genome Biol 12, R41 (2011). [DOI] [PMC free article] [PubMed] [Google Scholar]
- 38.Muller FL et al. Passenger deletions generate therapeutic vulnerabilities in cancer. Nature 488, 337–342 (2012). [DOI] [PMC free article] [PubMed] [Google Scholar]
- 39.Trifonov V, Pasqualucci L, Dalla Favera R & Rabadan R MutComFocal: an integrative approach to identifying recurrent and focal genomic alterations in tumor samples. BMC Syst. Biol 7, 25 (2013). [DOI] [PMC free article] [PubMed] [Google Scholar]
- 40.Sarto Basso R, Hochbaum DS & Vandin F Efficient algorithms to discover alterations with complementary functional association in cancer. PLoS Comput. Biol 15, e1006802 (2019). [DOI] [PMC free article] [PubMed] [Google Scholar]
- 41.Duncan CG et al. Integrated genomic analyses identify ERRFI1 and TACC3 as glioblastoma-targeted genes. Oncotarget 1, 265–277 (2010). [DOI] [PMC free article] [PubMed] [Google Scholar]
- 42.Barthel FP et al. Longitudinal molecular trajectories of diffuse glioma in adults. Nature 576, 112–120 (2019). [DOI] [PMC free article] [PubMed] [Google Scholar]
- 43.Jolly C & Van Loo P Timing somatic events in the evolution of cancer. Genome Biol 19, 95 (2018). [DOI] [PMC free article] [PubMed] [Google Scholar]
- 44.Shimokawa N et al. Past-A, a novel proton-associated sugar transporter, regulates glucose homeostasis in the brain. J. Neurosci 22, 9160–9165 (2002). [DOI] [PMC free article] [PubMed] [Google Scholar]
- 45.Srour M et al. Dysfunction of the cerebral glucose transporter SLC45A1 in individuals with intellectual disability and epilepsy. Am. J. Hum. Genet 100, 824–830 (2017). [DOI] [PMC free article] [PubMed] [Google Scholar]
- 46.Webb BA, Chimenti M, Jacobson MP & Barber DL Dysregulated pH: a perfect storm for cancer progression. Nat. Rev. Cancer 11, 671–677 (2011). [DOI] [PubMed] [Google Scholar]
- 47.Molina JR et al. An inhibitor of oxidative phosphorylation exploits cancer vulnerability. Nat. Med 24, 1036–1046 (2018). [DOI] [PubMed] [Google Scholar]
- 48.Wheaton WW et al. Metformin inhibits mitochondrial complex I of cancer cells to reduce tumorigenesis. eLife 3, e02242 (2014). [DOI] [PMC free article] [PubMed] [Google Scholar]
- 49.Skrtic M et al. Inhibition of mitochondrial translation as a therapeutic strategy for human acute myeloid leukemia. Cancer Cell 20, 674–688 (2011). [DOI] [PMC free article] [PubMed] [Google Scholar]
- 50.Criddle DN et al. Menadione-induced reactive oxygen species generation via redox cycling promotes apoptosis of murine pancreatic acinar cells. J. Biol. Chem 281, 40485–40492 (2006). [DOI] [PubMed] [Google Scholar]
- 51.Altman BJ, Stine ZE & Dang CV From Krebs to clinic: glutamine metabolism to cancer therapy. Nat. Rev. Cancer 16, 619–634 (2016). [DOI] [PMC free article] [PubMed] [Google Scholar]
- 52.Fernandez-Marcos PJ & Auwerx J Regulation of PGC-1alpha, a nodal regulator of mitochondrial biogenesis. Am. J. Clin. Nutr 93, 884S–890S (2011). [DOI] [PMC free article] [PubMed] [Google Scholar]
- 53.Richardson RB & Harper ME Mitochondrial stress controls the radiosensitivity of the oxygen effect: implications for radiotherapy. Oncotarget 7, 21469–21483 (2016). [DOI] [PMC free article] [PubMed] [Google Scholar]
- 54.Kim W et al. Cellular stress responses in radiotherapy. Cells 8, 1105 (2019). [DOI] [PMC free article] [PubMed] [Google Scholar]
- 55.Venkatesh HS et al. Electrical and synaptic integration of glioma into neural circuits. Nature 573, 539–545 (2019). [DOI] [PMC free article] [PubMed] [Google Scholar]
- 56.Malta TM et al. Machine learning identifies stemness features associated with oncogenic dedifferentiation. Cell 173, 338–354 (2018). [DOI] [PMC free article] [PubMed] [Google Scholar]
- 57.Momcilovic M et al. In vivo imaging of mitochondrial membrane potential in non-small-cell lung cancer. Nature 575, 380–384 (2019). [DOI] [PMC free article] [PubMed] [Google Scholar]
- 58.Davoli T et al. Cumulative haploinsufficiency and triplosensitivity drive aneuploidy patterns and shape the cancer genome. Cell 155, 948–962 (2013). [DOI] [PMC free article] [PubMed] [Google Scholar]
- 59.Sack LM et al. Profound tissue specificity in proliferation control underlies cancer drivers and aneuploidy patterns. Cell 173, 499–514 (2018). [DOI] [PMC free article] [PubMed] [Google Scholar]
- 60.Solimini NL et al. Recurrent hemizygous deletions in cancers may optimize proliferative potential. Science 337, 104–109 (2012). [DOI] [PMC free article] [PubMed] [Google Scholar]
- 61.Dong J et al. Single-cell RNA-seq analysis unveils a prevalent epithelial/mesenchymal hybrid state during mouse organogenesis. Genome Biol 19, 31 (2018). [DOI] [PMC free article] [PubMed] [Google Scholar]
- 62.Gao S et al. Tracing the temporal-spatial transcriptome landscapes of the human fetal digestive tract using single-cell RNA-sequencing. Nat. Cell Biol 20, 721–734 (2018). [DOI] [PubMed] [Google Scholar]
- 63.Dobin A & Gingeras TR Mapping RNA-seq reads with STAR. Curr. Protoc Bioinformatics 51, 11.14.11–11.14.19 (2015). [DOI] [PMC free article] [PubMed] [Google Scholar]
- 64.Anders S, Pyl PT & Huber W HTSeq—a Python framework to work with high-throughput sequencing data. Bioinformatics 31, 166–169 (2015). [DOI] [PMC free article] [PubMed] [Google Scholar]
- 65.Colaprico A et al. TCGAbiolinks: an R/Bioconductor package for integrative analysis of TCGA data. Nucleic Acids Res 44, e71 (2016). [DOI] [PMC free article] [PubMed] [Google Scholar]
- 66.Risso D, Schwartz K, Sherlock G & Dudoit S GC-content normalization for RNA-seq data. BMC Bioinformatics 12, 480 (2011). [DOI] [PMC free article] [PubMed] [Google Scholar]
- 67.Zhao Z et al. Comprehensive RNA-seq transcriptomic profiling in the malignant progression of gliomas. Sci Data 4, 170024 (2017). [DOI] [PMC free article] [PubMed] [Google Scholar]
- 68.Johnson WE, Li C & Rabinovic A Adjusting batch effects in microarray expression data using empirical Bayes methods. Biostatistics 8, 118–127 (2007). [DOI] [PubMed] [Google Scholar]
- 69.Lee Y et al. Gene expression analysis of glioblastomas identifies the major molecular basis for the prognostic benefit of younger age. BMC Med. Genomics 1, 52 (2008). [DOI] [PMC free article] [PubMed] [Google Scholar]
- 70.Hussain SF et al. The role of human glioma-infiltrating microglia/macrophages in mediating antitumor immune responses. Neuro. Oncol 8, 261–279 (2006). [DOI] [PMC free article] [PubMed] [Google Scholar]
- 71.Quail DF & Joyce JA The microenvironmental landscape of brain tumors. Cancer Cell 31, 326–341 (2017). [DOI] [PMC free article] [PubMed] [Google Scholar]
- 72.Mall R et al. RGBM: regularized gradient boosting machines for identification of the transcriptional regulators of discrete glioma subtypes. Nucleic Acids Res 46, e39 (2018). [DOI] [PMC free article] [PubMed] [Google Scholar]
- 73.Lambert SA et al. The human transcription factors. Cell 175, 598–599 (2018). [DOI] [PubMed] [Google Scholar]
- 74.Vaquerizas JM, Kummerfeld SK, Teichmann SA & Luscombe NM A census of human transcription factors: function, expression and evolution. Nat. Rev. Genet 10, 252–263 (2009). [DOI] [PubMed] [Google Scholar]
- 75.Wingender E The TRANSFAC project as an example of framework technology that supports the analysis of genomic regulation. Brief. Bioinformatics 9, 326–332 (2008). [DOI] [PubMed] [Google Scholar]
- 76.Lee SB et al. An ID2-dependent mechanism for VHL inactivation in cancer. Nature 529, 172–177 (2016). [DOI] [PMC free article] [PubMed] [Google Scholar]
Associated Data
This section collects any data citations, data availability statements, or supplementary materials included in this article.
Supplementary Materials
Data Availability Statement
Single-cell RNA-seq datasets 1, 2 and 3 are available from Gene Expression Omnibus (GEO, accession nos. GSE117891, GSE103224 and GSE131928, respectively). Single-cell RNA-seq read count data for the additional samples in dataset 2 (PJ053, PJ069 and PW032.706) and sequencing data for PDC samples (gene expression read counts, genetic mutations and copy number segmentation) have been submitted to Synapse (http://synapse.org, accession no. syn22314624). TCGA GBM data (Agilent chip G4502A and RNA-seq gene expression, somatic mutation calls, Affymetrix SNP 6.0 array copy number segmentation, Illumina Infinium Human Methylation 450k DNA methylation, Agilent miRNA and RPPA quantification) are available from the GDC Data Portal (https://portal.gdc.cancer.gov/). The CGGA GBM dataset is available from the CGGA data portal (http://cgga.org.cn/index.jsp). Data from ref. 69 are available from GEO (accession no. GSE13041). Data from ref. 17 are available at the Sequence Read Archive (SRA, accession no. SRP074425), European Genome-phenome Archive (EGA, accession nos. EGAS00001001033, EGAS00001000579, EGAS00001001044, EGAS00001001041 and EGAS00001001800) and the Japanese Genotype–Phenotype Archive (accession no. JGAS00000000004). The GBM longitudinal GLASS dataset is available from Synapse (http://synapse.org/glass). Source data for Figs. 5a–f,h,i, 6c, 7a–c,e–i and 8a–d,f,g,i–k and Extended Data Figs. 9b,c and 10g,h are provided as with this paper. All other data supporting the findings of this study are available from the corresponding author on reasonable request. Further information on research design is available in the Nature Research Reporting Summary linked to this article.


