

MIB and MIP bind to antibodies and disrupt the antigen binding site to promote the dissociation of antibody-antigen interactions.
Abstract
Mycoplasma immunoglobulin binding (MIB) and mycoplasma immunoglobulin protease (MIP) are surface proteins found in the majority of mycoplasma species, acting sequentially to capture antibodies and cleave off their VH domains. Cryo–electron microscopy structures show how MIB and MIP bind to a Fab fragment in a “hug of death” mechanism. As a result, the orientation of the VL and VH domains is twisted out of alignment, disrupting the antigen binding site. We also show that MIB-MIP has the ability to promote the dissociation of the antibody-antigen complex. This system is functional in cells and protects mycoplasmas from antibody-mediated agglutination. These results highlight the key role of the MIB-MIP system in immunity evasion by mycoplasmas through an unprecedented mechanism, and open exciting perspectives to use these proteins as potential tools in the antibody field.
INTRODUCTION
Pathogens and their hosts are engaged in an everlasting evolutionary battle, with both sides developing an arsenal of tools to fight and counter their opponents (1). Multicellular organisms, in particular vertebrates, have highly sophisticated immune systems to distinguish self from non-self and eliminate potential threats (2). Immunoglobulins are central components of these systems, as they are involved in a wide array of functions including neutralization of viruses and agglutination or opsonization of bacteria (3). In turn, successful pathogens evolved multiple strategies to avoid or subvert the innate and adaptive immune systems, allowing them to persist in their hosts (4). A number of these anti-immune strategies directly target the immunoglobulins, through two main categories of effectors: (i) immunoglobulin-binding proteins (5, 6) and (ii) immunoglobulin proteases (7). The first category includes a diverse set of effectors that bind to various conserved domains of the immunoglobulins, preventing their recognition by other components of the immune system, and ultimately leading to reduced complement recruitment or opsonization. Among these effectors, Protein G, Protein A, and Protein L are well characterized and extensively used in biotechnology. The second category of effectors comprises immunoglobulin-specific proteases that cleave the heavy chain in the hinge region, resulting in the separation of the antigen-binding fragment (Fab) and the constant fragment (Fc). While the Fab remains intact and capable of binding the antigen, it can no longer participate in the recruitment of the complement or trigger opsonization, which are both Fc-mediated.
Mycoplasmas are bacteria characterized by their fast evolution, reduced genomes [~1 million base pairs (Mbp)], and the absence of a cell wall (8). They are obligate parasites able to colonize the mucosal surfaces of a wide range of hosts, including humans and most livestock species. Many mycoplasmas are pathogenic, raising important concerns in both the medical and veterinary fields (9). Most mycoplasma infections have a chronic nature, suggesting that these organisms are able to efficiently counter the immune systems of their hosts. A small number of effectors targeting immunoglobulins have been identified in a few mycoplasma species, such as the protease CysP (10) or the broadly reacting immunoglobulin-binding Protein M (11). A few years ago, we identified a two-component system called mycoplasma immunoglobulin binding (MIB)–mycoplasma immunoglobulin protease (MIP) that binds and cleaves immunoglobulins (12). MIB tightly interacts with the immunoglobulin G (IgG) Fab domain and subsequently recruits the serine protease MIP. MIP is activated in the presence of MIB and cleaves the IgG heavy chain between the VH and CH1 domains (fig. S1). Because of its biochemical function and its conservation in the majority of mycoplasma species, the MIB-MIP system appears crucial to mycoplasma immune evasion.
Here, we have solved the structure of MIB and MIP in complex with a goat IgG Fab using cryo–electron microscopy (cryo-EM). On the basis of these structural insights, we have explored the interplay between the MIB-MIP system and immunoglobulins recognizing specific antigens, both in vitro and in mycoplasma cells.
RESULTS
Architecture of the MIB-MIP-Fab complex
The tripartite complex composed of MIB, MIP, and the Fab fragment of goat IgG was reconstituted in vitro from purified components. The Fab fragments correspond to a polyclonal mix that was generated by the proteolysis of polyclonal IgGs from goat serum. MIB and MIP were derived from our model organism Mycoplasma mycoides subsp. capri strain GM12 (Mmc). The prototypical MIB and MIP were MIB83 (encoded by the locus MMCAP2_0583) and MIP82 (encoded by the locus MMCAP2_0582), respectively. Both proteins were expressed in Escherichia coli as truncated variants to remove their predicted N-terminal transmembrane segment (MIB83: residues 1 to 35, MIP82: residues 1 to 33). To capture the complex with an entire Fab in its “precleavage” state, we used the inactive mutant S759AMIP82 in which the catalytic serine (Ser759) of the protease was mutated into an alanine (12).
The complex was isolated using gel filtration (fig. S2A), deposited on cryo-EM grids, vitrified in liquid ethane, and visualized using cryo-EM. Movies were recorded using a Titan Krios equipped with a K2 direct electron detector (table S1). Particles were selected, extracted from realigned micrographs (fig. S2B), and further processed in RELION 3.0.7 (table S1). A cryo-EM map of the MIB83-S759AMIP82-Fab complex was obtained with an overall resolution of 2.8 Å (fig. S2, C to G, and table S1).
MIB83, MIP82, and Fab form a complex with a 1:1:1 stoichiometry as previously reported (Fig. 1) (12). This asymmetric complex has a globular shape of around 100 Å in diameter (Fig. 1). Densities corresponding to the four immunoglobulin domains of the Fab are recognizable at the center of the map. As the goat Fabs used are polyclonal, a homology model has been generated using a consensus sequence for the Fab light and heavy chains and placed in these densities. The surrounding densities were used to obtain an atomic model for MIB83 or MIP82 (see Materials and Methods for details) (Fig. 2A).
Fig. 1. Cryo-EM density map of the tripartite complex between MIB83, S759AMIP82, and a goat IgG Fab.
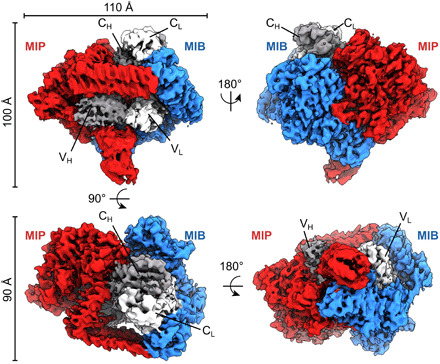
The map is segmented with MIB83 colored in blue, S759AMIP82 in red, the Fab heavy chain in dark gray, and the Fab light chain in light gray. Alternative orientations of the map are shown, and the axis and angles of rotation between these orientations are indicated, as well as the overall dimensions of the complex.
Fig. 2. Structures of MIB83 and S759AMIP82 and their interactions with the Fab.
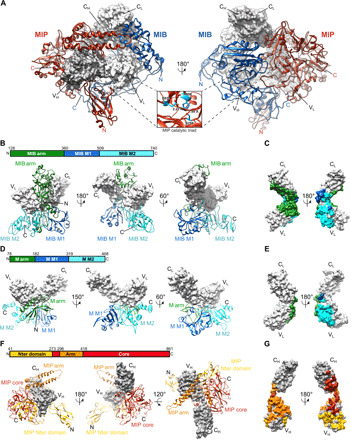
(A) Structure of the complex between MIB83, S759AMIP82, and a goat IgG Fab fragment (gray surfaces). Inset: zoomed-in view of the catalytic triad in the S759AMIP82 core domain. (B) Interaction of MIB83 (ribbon) with the Fab light chain (surface). MIB83 structure is split into three domains: MIB arm (green), MIB M1 (blue), and MIB M2 (cyan). (C) Footprint of MIB83 on the Fab light chain in surface representation. (D) Structure of Protein M [ribbon; Protein Data Bank (PDB): 4NZR] in complex with the light chain of a Fab (gray surface). Protein M structure is split into three domains: M arm (green), M M1 (blue), and M M2 domains (cyan). (E) Footprint of Protein M on the light chain of the Fab in surface representation. (F) Interaction of S759AMIP82 (ribbon) with the Fab heavy chain (gray surface). S759AMIP82 is split into three domains: MIP N-terminal domain (yellow), MIP core (red), and MIP arm domains (orange). (G) Footprint of S759AMIP82 on the Fab heavy chain in surface representation.
MIB shares structural features with Protein M, a previously characterized Ig-binding protein from Mycoplasma genitalium (11). MIB is composed of two Protein M–like domains, named M1 (residues 360 to 509) and M2 (residues 510 to 740), decorated by a specific N-terminal arm domain (residues 128 to 359) (Fig. 2, A and B). The MIB M1 domain is very similar to the equivalent domain in Protein M (residues 182 to 319) (Fig. 2, B and D, and fig. S3A). The MIB M2 domain also resembles the equivalent domain in Protein M (residues 320 to 468) but with less structural conservation (Fig. 2, B and D, and fig. S3B). In particular, a long loop at the N terminus of the MIB M2 domain (residues 533 to 546) is absent in Protein M (fig. S3B). At its C terminus, MIB contains an additional region made of a three-strand β sheet and one helix (Fig. 2, B and D, and fig. S3B). In Protein M, this C-terminal extension consists of two helices (Fig. 2, B and D, and fig. S3B). The unique MIB N-terminal arm is made of a globular domain (residues 180 to 330), connected to MIB M1 by a long C-terminal linker and to the MIB M1 and M2 domains via a large N-terminal hairpin (residues 128 to 179) (Fig. 2B and fig. S3C). The equivalent N-terminal Protein M arm domain (residues 78 to 181) has a completely different structure (Fig. 2D and fig. S3D). No clear density for the residues 36 to 128 could be observed, revealing the flexible nature of this part of MIB83.
MIP is made of a protease domain (residues 273 to 296 and 418 to 861, named Core) flanked by a long arm domain made of antiparallel α helices (residues 297 to 417) and by an N-terminal pillar (residues 41 to 273) (Fig. 2, A and F). The protease domain contains a typical thrombin-like serine protease core decorated with large loop insertions (residues 512 to 537, 564 to 626, 639 to 744, and 790 to 861) (fig. S3E). The protease catalytic triad is made of Ser759, His450, and Asp539 (Fig. 2A and fig. S3F). It is localized in the vicinity of the linker connecting the Fab VH and CH1 domain. The alanine replacing the catalytic serine of MIP is situated 20 Å from the proteolytic site, which we previously identified between residues Ser137 and Ala138 of the Fab heavy chain (fig. S3F) (12). The N-terminal pillar is made of an Ig-like domain linked to a helix domain that is directly in contact with the protease domain (Fig. 2F). The density corresponding to the Ig-like domain of the pillar was not well resolved, highlighting its flexible nature. A homology model of this part of the protein was used and fitted in the density.
We previously showed that MIB and MIP are not able to interact in the absence of the Fab (12). However, in the structure of the MIB-MIP-Fab complex, they make direct contacts (Fig. 2A). In particular, the MIP protease core domain makes extensive interactions with the MIB M1 and M2 domains (fig. S3G). Most of these contacts are mediated by a long loop insertion in the MIP core domain (residues 672 to 688). In addition, the MIB C-terminal extension interacts with the MIP pillar. The tips of the MIB and MIP arms are also in contact, closing both arms around the Fab (Fig. 2A and S3G).
The whole structure is stabilized by the extensive interactions between these proteins and the Fab. The MIB M2 domain binds the VL domain of the Fab (Fig. 2, B and C) and also encircles the light chain between the CL and VL domains to make extensive contacts with the Fab in this region (Fig. 2C). The 515 to 528 loop of the M1 domain makes additional contacts with the CL and VL domains. In contrast, it was previously shown that Protein M predominantly binds the Fab variable VL domain through contacts with its M2 and arm domains (Fig. 2, D and E) (11). Multiple contacts exist between MIP and the Fab, as MIP core domain interacts with the Fab CH and VH domains, while the MIP arm encircles the heavy chain between the Fab CH and VH domains (Fig. 2G). Last, the MIP N-terminal Ig-like domain makes contacts with the Fab VH.
MIB and MIP disrupt the antigen binding site of the Fab
The conformation of the Fab within the MIB-MIP-Fab complex appears drastically changed when compared to the structures of isolated Fabs in their native states (Fig. 3 and fig. S4). While the structure and relative positions of the CL and CH domains in the MIB-MIP-Fab complex are not modified, the VL and VH domains are twisted out of their native location (Fig. 3, A, B, and D, and fig. S4). The angle between the CL and VL domains is shifted from around 103° in their typical native position (13) to 83° in the MIB-MIP-Fab complex (Fig. 3A). The angle between the CH and the VH domains is also changed from 72° in the native Fab to around 162° in the MIB-MIP-Fab complex (Fig. 3A). These changes have drastic consequences on the structure of the antigen binding site, as the distance between the VL and VH complementarity-determining regions (CDRs) is greater than 40 Å. This is nearly twice the usual distance of 20 to 25 Å measured in an isolated Fab (Fig. 3A). It is important to note that the density for the VH is not well resolved, underlining the high degree of flexibility of this domain in the MIB-MIP-Fab complex. The proposed atomic model shows the best fit of this domain in the density. These changes are not observed in a Fab fragment bound to Protein M, as the antigen binding site remains in a conformation that is very close to the one of isolated Fabs (Fig. 3, A, C, and E, and fig. S4).
Fig. 3. The structure of the antigen binding site of the Fab bound to MIB83 and S759AMIP82 is disrupted.
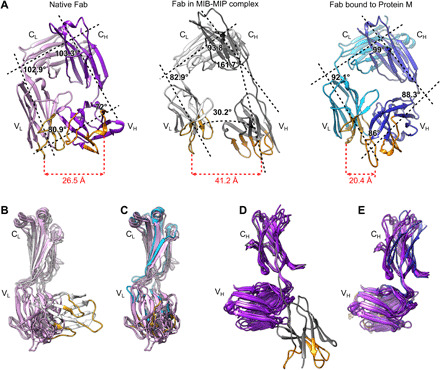
(A) Comparison of isolated and bound Fabs structures. Left: Isolated Fab (PDB: 6TCM). Light chain: pink; heavy chain: purple. Middle: Goat IgG Fab in complex with MIB83 and S759AMIP82. Light chain: light gray; heavy chain: dark gray. Right: Fab in complex with Protein M (PDB: 4NZR). Light chain: cyan; heavy chain: blue. The main axis of each domain was determined in Chimera and is indicated as a black dashed line. The calculated angles between these axes are displayed, as well as the distance between the CDR1 loops of the VL and VH domains. The complementarity-determining regions (CDRs) of the VH and VL domains are colored orange and yellow, respectively. (B to D) Superimposition of the structures of various isolated Fabs (PDB: 6TCM, 4POZ, 4HBC, 4POZ, and 5ILT) with the Fab bound to MIB83-S759AMIP82 and to Protein M. (B) Superimposition of the light chains of isolated Fabs and Fab bound to MIB-MIP. (C) Superimposition of the light chains of isolated Fabs and Fab bound to Protein M. (D) Superimposition of the heavy chains of isolated Fabs and Fab bound to MIB-MIP. (E) Superimposition of the heavy chains of isolated Fabs and Fab bound to Protein M.
We then investigated if a Fab antigen binding site can be disrupted by MIB83 alone. The structure of the same polyclonal goat Fabs in complex with MIB83 was solved by cryo-EM at a resolution of 3.5 Å (figs. S7 and S8). Our results show that MIB and the Fab light chain have the same conformations in the MIB-Fab complex than in the MIB-MIP-Fab complex (fig. S8, A and C). However, whereas the position of the VL domain is identical to that observed in the MIB-MIP-Fab structure, the density for the VH is not visible in the consensus map (fig. S8B). This underlines the high degree of flexibility of this domain in the MIB-Fab complex and shows that this domain is also displaced by MIB alone. After three-dimensional (3D) classification, we obtained a map in which the VH domain is visible using a subset of the particles (33% of the dataset). In the corresponding structure, the VH is also twisted out of its normal alignment (fig. S8D), albeit at a different angle than in the MIB-MIP-Fab complex (fig. S8E). Together, these data confirm that MIB alone does disrupt the antigen binding site.
MIB and MIP promote the dissociation of the antigen-antibody complex
Given the disruption of the antigen binding site observed in our structural data, we hypothesized that the MIB-MIP system could affect the antibody-antigen interaction. To study this hypothesis, we first determined whether MIB and MIP could process immunoglobulins in the presence of their cognate antigens. We used three specific, affinity-purified goat IgGs and their corresponding antigens: human transferrin (hTransferrin), human albumin (hAlbumin), and horseradish peroxidase (HRP). We checked whether the immunoglobulin VH domain was cleaved off when antibodies were bound to their antigen. IgGs were incubated with a molar excess of antigens for 20 min before the addition of MIB83 and MIP82. The reactions were stopped 10 min later and the proteins were analyzed by SDS–polyacrylamide gel electrophoresis (PAGE) (fig. S5). The results show that the immunoglobulin heavy chain is cleaved in all cases, whether the antigen is present or not, yielding the ~44-kDa proteolytic heavy chain fragment as a hallmark of MIB-MIP activity.
Then, we analyzed whether the antibody-antigen interaction was affected by the addition of MIB and MIP using size exclusion chromatography (Fig. 4 and fig. S6). Similar results were observed for the three IgG-antigen pairs. Antibody-antigen mixtures, preincubated for 20 min before injection on the chromatography column, resulted in a broad peak eluting at the void volume of the column (V = 8 ml), corresponding to a complex size greater than 600 kDa. No peak was present at the elution volume of the unbound IgG. A peak was observed at the volume for the unbound antigen, corresponding to the excess of antigen in the reaction (Fig. 4, A to C). These observations indicate that all the IgGs were bound to their antigen forming large aggregates corresponding to the agglutination of the antigens by polyclonal antibodies.
Fig. 4. MIB and MIP promote the dissociation of the antigen-antibody interaction.
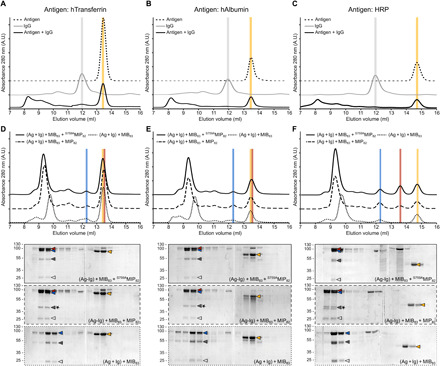
(A to C) Size exclusion chromatography analysis of the interaction between a specific antibody (IgG) and its corresponding antigen [(A) hTransferrin; (B) hAlbumin; (C) HRP]. The IgG and the antigen were incubated for 30 min before injection in the column. Colored vertical bars indicate the specific elution volumes of the antigen (gold) and the IgG (gray). (D to F) Interaction between the IgG and its corresponding antigen [(D) hTransferrin; (E) hAlbumin; (F) HRP] in the presence of MIB-MIP or MIB alone. Top: Size exclusion chromatography analysis of the different samples. Colored vertical bars indicate the specific elution volumes of MIB83 (blue), MIP82 and S759AMIP82 (red), and the antigens (gold). Bottom: SDS-PAGE analysis of the different fractions collected during the size exclusion chromatography. Arrowheads indicate the position of each protein: MIB83 (blue), MIP82 or S759AMIP82 (red), IgG heavy chain (dark gray), IgG light chain (light gray), and the antigens (gold). The star indicates the cleavage of the IgG heavy chain. For the antigen HRP, two bands can be seen for the cleaved IgG heavy chain due to the polyclonal nature of the anti-HRP antibodies used here. A.U., arbitrary units.
The addition of MIB and S759AMIP to these agglutinated aggregates resulted in their dissociation and the formation of the soluble MIB-IgG-S759AMIP complex (Fig. 4, D to F). The main peak (elution volume V = 9.3 ml) elutes at the same volume as the peak observed for MIB83-IgG-S759AMIP82 complexes formed in the absence of antigen (fig. S6). SDS-PAGE analysis confirmed that this main peak contained MIB83, S759AMIP82, and the IgG but no antigen. The antigen was only detected in fractions (hTransferrin: elution volume V = 13.4 ml; hAlbumin: elution volume V = 13.6 ml; HRP: elution volume V = 14.8 ml) that did not contain IgG. Similar results were obtained when MIB alone or the enzymatically active MIP-MIP complex was mixed with the agglutinated aggregates. These results show that the addition of MIB and MIP, but also of MIB alone, promotes the complete dissociation of the IgG-antigen interaction, even within agglutinated aggregates. This dissociation is independent of the VH cleavage, as it occurs with both catalytically active and inactive variants of MIP.
MIB and MIP are functional in vivo
We extended our analysis of the MIB-MIP system at the cellular level in our model organism Mmc. Genomic analysis showed that this organism has four MIBs and four MIPs, encoded by coding sequences (CDS) located in adjacent loci and as part of a large operon predicted to encode 15 putative proteins (Fig. 5A). The multiple MIBs and MIPs of Mmc are diverse, with amino acid sequence identities comprised between 63 and 70% and between 59 and 64%, respectively. To assess whether all variants are functional, we expressed recombinant versions of all the MIBs and MIPs and tested their capacity to cleave IgG using in vitro assays (fig. S9). Our results showed that IgGs are cleaved by all the combinations of MIB and MIP. We then performed the same assay using either secretory IgAs (sIgAs) or IgMs as the substrate. sIgAs are the most abundant immunoglobulins found in the lung secretions (14) and IgMs are the first antibodies produced during the adaptive immune response and play an important role in complement activation (2). All the MIB-MIP pairs were able to process IgAs and IgMs, as indicated by the generation of fragments of 49 and 66 kDa, respectively. These fragment sizes are coherent with the loss of the ~11-kDa VH domain, as the molecular mass of the native IgA heavy chain is ~62 kDa and that of the IgM is ~79 kDa. These data indicate that the MIBs and MIPs of Mmc are immunoglobulin-class agnostic, cross-compatible, and functionally redundant.
Fig. 5. MIB and MIP are active in vivo and protect the cells from immunoglobulins targeting surface antigens.
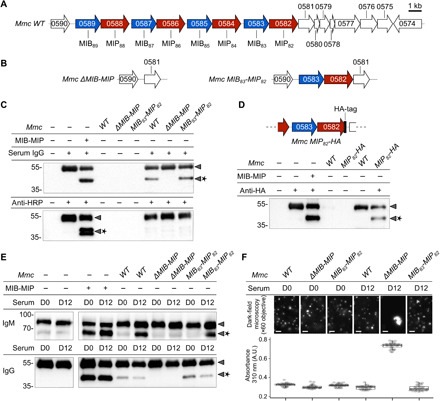
(A) Schematic representation of the Mmc genomic locus encoding MIBs (blue) and MIPs (red) homologs. (B) Genomic loci encoding MIBs and MIPs in the Mmc mutant strains ΔMIB-MIP and MIB83-MIP82. (C) Western blot analysis of immunoglobulin cleavage by the wild-type and mutant Mmc cells. The assays were performed with nonspecific polyclonal IgG from normal goat serum or anti-HRP polyclonal IgG affinity-purified from immunized goat. Arrowheads indicate the location of the intact or cleaved (star) immunoglobulin heavy chain. (D) Top: Schematic representation of the MIB-MIP locus in the mutant Mmc MIP82-HA. Bottom: Western blot analysis of anti-HA goat IgG cleavage by wild-type and mutant Mmc cells. (E) Analysis of immunoglobulin cleavage performed using sera collected from goats infected by Mmc (“D0”: before infection; “D12”: 12 days after infection). Each sample was split into two and analyzed by Western blot against goat IgM or goat IgM. (F) Agglutination of wild-type and mutant Mmc cells by the sera of infected goats. Cells were cultivated in the presence of 2% goat serum and agglutination was observed by dark-field microscopy or quantified in microplates by measuring the absorbance at 310 nm.
Proteomics analysis of Mmc grown under axenic conditions showed that all the MIBs and all the MIPs are expressed (fig. S10), suggesting that the system might be active at the cell surface. To test this hypothesis, we produced two mutants of Mmc: the ΔMIB-MIP strain in which all the MIBs and MIPs encoding loci are removed and the MIB83-MIP82 strain, which only expresses MIB83 and MIP82 (Fig. 5B and figs. S11 and S12). We tested whether these two strains were able to cleave IgG and compared them to the WT strain. Cells were exposed to media containing nonspecific polyclonal IgG purified from goat serum. The presence of cleaved immunoglobulins in the culture media was assessed by Western blot. Fragmentation of IgG heavy chain was clearly visible in both WT and MIB83-MIP82 cells (Fig. 5C) but was abolished in the ΔMIB-MIP mutant, confirming that the cleavage of polyclonal IgGs is linked to the expression of MIB and MIP and that the multiple MIBs and MIPs of Mmc are redundant.
Antibody recruitment at the mycoplasma cell surface promotes antibody cleavage by MIB and MIP in vivo
Antigen-specific IgGs (anti-HRP and anti-GST) were not cleaved by the WT cells, or by the MIB83-MIP82 mutant cells (Fig. 5D and fig. S13), suggesting that IgG may need to bind Mmc cell surface to be cleaved by MIB and MIP. This hypothesis was reinforced by the fact that goat serum was shown to contain substantial amounts of IgG recognizing antigens from bacteria that the animals had never been exposed to, owing to cross-reactivity or similar antigenic determinants (15). To test this hypothesis, we used Mmc cells that express a specific epitope at their surface and assessed the cleavage of the corresponding goat IgG. We leveraged a previously designed mutant expressing a HA-tagged variant of MIP82 and a commercial goat IgG anti-HA tag (Fig. 5E and fig. S14). The HA-tagged Mmc cells were able to process the anti-HA IgG unlike the WT cells, suggesting a preferential cleavage of immunoglobulins bound to the mycoplasma cell surface. To confirm this finding, we then used sera taken from goats experimentally infected with Mmc (16). Samples were collected before infection (D0) and 12 days after inoculation (D12). At this time point, the sera should predominantly contain anti-Mmc IgM. Wild-type, MIB83-MIP82, and ΔMIB-MIP Mmc cells were exposed to these sera, and immunoglobulin cleavage was assessed (Fig. 5F). While MIB and MIP were able to cleave IgM contained in both D0 and D12 sera in vitro, WT and MIB83-MIP82 Mmc cells were only able to cleave the IgM contained in D12 sera. IgMs contained in D0 were not degraded. IgG cleavage was also evaluated and happened very poorly in both D0 and D12 sera. This can be explained by the low amount of antimycoplasma-directed IgG present in the goat sera after this short period of infection.
Agglutination assays were performed to investigate the presence of polyclonal immunoglobulins recognizing Mmc cell surface in the DO and D12 sera (Fig. 5, G and H, and fig. S15). Dark-field microscopy revealed the presence of large clumps in ΔMIB-MIP cells exposed to D12 serum, which was confirmed by the high absorbance measured in the same sample. ΔMIB-MIP cells could agglutinate because immunoglobulins, and especially IgM, found in the D12 serum could bind their cell surface and form pentameric structures bridging multiple cells together. This agglutination was not observed in WT or MIB83-MIP82 Mmc cells because MIB and MIP are expressed and can cleave the immunoglobulins.
DISCUSSION
On the basis of the data available in the literature and presented in this study, we propose the following mechanism of action for MIB and MIP in vivo (Fig. 6). First, an immunoglobulin bound to a mycoplasma surface antigen is recognized by MIB and displaced from this antigen. The VH domain of the immunoglobulin is shifted away from its initial position freeing the linker between the CH and VH domains of the Fab. Subsequently, the protease MIP is recruited, the VH domain is cleaved off, and lastly the cleaved antibody is released from the cell surface.
Fig. 6. Model of the MIB-MIP mechanism.
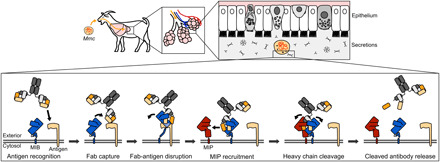
Mycoplasma enters the airways of the host through airborne droplets or nose-to-nose contacts and will migrate to the lower portions of the lungs to establish its infection. The lung epithelium is lined with secretions, including the pulmonary surfactant, that are rich in secretory IgA and also contain small amounts of IgG and IgM. MIB (blue) is located at the mycoplasma cell surface and is able to target antibodies that are specifically bound to a surface antigen (beige). MIB binds to the light chain of the antibody and displaces the antibody from its cognate antigen. The antigen binding site conformation of the antibody is disrupted as the VH domain of the immunoglobulin is shifted away from its initial position. MIP (red) is subsequently recruited and activated, resulting in the cleavage of the VH domain. The broken immunoglobulin is then released from the MIB-MIP complex.
In our model (Fig. 6), we hypothesize that MIB’s role is to “fetch” immunoglobulins and to place the Fab domain in a favorable conformation to allow the recruitment of the protease MIP. This hypothesis is bolstered by the disordered nature and observed flexibility of the MIB N-terminal extremity, which could act as a tether and would allow the conformational flexibility necessary to reach antibodies planted on top of large surface antigens.
Our high-resolution structural data show that MIB and MIP use an unprecedented “hug of death” mechanism to capture and cleave the Fab. MIB and MIP hold the Fab firmly in their arm domains, putting the linker between the CH and VH domains in a favorable orientation to be cleaved by MIP. Even if the VH-CH1 linker appears to be highly flexible, it is not possible to bring the cleavage site close to the active Ser759 in the observed conformation. Upon binding of the VH-CH1 linker in the MIP active site pocket, a second conformational change at the level of MIP and/or the heavy chain of the Fab is required to bring them together and allow the catalysis. This conformation might be transient and could not be captured by cryo-EM.
The peculiar conformation of the Fab appears to be necessary to accommodate the recruitment of MIP, as the VH domain cannot fit inside the MIB-MIP-Fab complex in its native conformation (fig. S16). The changes in VH and VL relative orientation caused by MIB are probably facilitated by the relatively low stability of the VH-VL interaction, which is based predominantly on a small number of conserved hydrophobic residues (17–21).
Our data reveal that the MIB-MIP system and MIB alone are able to promote the dissociation of the antigen-antibody complex, resulting in the release of a completely free antigen. This is an unprecedented observation, and the exact mechanism of this dissociation remains elusive. One hypothesis builds on mass action and is based on the competition between the antigen and MIB to bind to the antibody. At equilibrium, a fraction of the antibody is free from the antigen and can be captured by MIB. Following the disruption of the antigen binding site, the antibody remains tightly bound to MIB and is no longer able to bind to the antigen, reducing the pool of antibodies bound to the antigen. Protein M should have a similar mode of action. It also binds tightly to antibodies and prevents binding to the antigen by partially masking the antigen binding site. However, it was shown that Protein M has no effect on the dissociation of the antibody-antigen complex (11). We propose that MIB could bind to the antibody-antigen complex and directly displace the antigen from the Fab. In the future, detailed analyses of the binding and activity of the MIB and MIP proteins on monoclonal immunoglobulins in the presence or the absence of their cognate antigen will provide insights into the mechanism involved.
Following the proteolytic cleavage of the heavy chain, the immunoglobulins are deprived of their VH domain. This loss is highly detrimental to their function, as this domain bears three of the six CDR loops forming the antigen binding site, including CDR-H3, which is central for the antigen recognition (22, 23). As shown in our in cellulo experiments (Fig. 5, C to E), these proteolysed antibodies are released from the cell surface and accumulate in the culture media supernatant. The mechanism that allows MIB and MIP to be reset to their unbound states, and the immunoglobulin to be released, remains to be discovered. However, given the extreme stability of the MIB-MIP-IgG complex, we hypothesize that another partner, a mycoplasma-specific atypical F-type adenosine triphosphatase (ATPase) (24), might be involved. This ATPase is systematically found in the genomes of MIB-MIP–expressing mycoplasmas and is predominantly found in operons with the MIB-MIP encoding genes (as is the case for Mmc). So far, it is unclear whether this ATPase acts on MIB and/or MIP upon direct interaction or whether it would have an indirect role. This ATPase is closely related to the one shown to energize the motility process of Mycoplasma mobile, through a conformational shift of a surface protein (25).
While the activity of MIB-MIP on antibodies is now well established, the exact role of this system during infection remains unclear. During early stages, it could be involved in countering the sIgA-mediated immune exclusion, a mechanism by which pathogens are prevented from reaching the epithelium surface through trapping and agglutination in the mucous layer (26–28). Given the ability of the MIB-MIP system to process IgM and IgG, they could also be involved in countering the adaptive immune response at later stages (29, 30). In particular, by degrading the immunoglobulins that bind to the bacterial surface, the MIB-MIP system could inhibit the activation of the C1q complement component and therefore the engulfment by phagocytes (31, 32).
Some mammalian species appear to have evolved a dedicated counter strategy. In human myeloid cells, for example, the leukocyte immunoglobulin-like receptor A2 (LILRA2) is able to specifically detect immunoglobulins that have lost their VH domain (33, 34). Activation of LILRA2 results in the activation of monocytes and neutrophils and leads to the production of antimicrobial products such as reactive oxygen species and cytokines to help contain and clear the infection. Although LILRA2 has only been characterized in primate species, extended sets of LILR encoding genes have been identified in bovine, caprine, and swine (35–37), suggesting that these species could also be able to detect VH cleavage.
Currently, MIB and MIP have only been detected in species belonging to the Mollicutes class. However, it was shown that Legionella pneumophila, Haemophilus influenzae, and Streptococcus pneumoniae also have the ability to remove the VH domain of immunoglobulins and to activate LILRA2 (33). The proteins involved in this cleavage activity remain cryptic, but distant homologs of MIB and MIP could be involved.
Last, in addition to their relevance to the field of host-pathogen interaction, MIB and MIP could also become important biotechnology tools. As immunoglobulins are cornerstones of multiple techniques (38), the ability to promote the dissociation of the antibody-antigen complex might be used in applications such as native elution of immunoprecipitated targets or removal of immune labeling from samples. Through genomic analysis, we have identified a very diverse set of MIB and MIP homologs in multiple Mollicutes, including species infecting mouse, rabbit, and human (figs. S17 and S18 and table S2). Further studies exploring this diversity space could lead to the identification of highly valuable variants adapted to the main classes of antibodies used in biomedical research.
MATERIALS AND METHODS
Unless stated otherwise, all commercial kits were used according to the manufacturer’s instructions.
Microbial strains and growth conditions
All strains and plasmids used in this study are listed and described in tables S2 and S3, respectively. M. mycoides subsp. capri strains were routinely grown at 37°C in SP5 media (39), supplemented with the appropriate antibiotics [tetracycline (5 or 10 μg/ml)] without agitation. For the in cellulo antibody cleavage and immune sera agglutination experiments, Mmc strains were grown in SP5 media, depleted of fetal bovine serum [normally used at 17% (v/v) and supplemented with 4% v/v goat serum taken from infected animals].
Mycoplasma capricolum subsp. capricolum strain CK ΔRE used for transplantation was grown at 37°C in SOB (Super Optimal Broth) media without agitation (40). E. coli strains used for plasmid cloning, maintenance, and propagation were routinely grown at 37°C in LB media, supplemented with the appropriate antibiotics [ampicillin (100 μg/ml), kanamycin (50 μg/ml), and tetracycline (10 μg/ml)] and 0.5% (m/vol) glucose. For recombinant protein expression, E. coli strains were grown at 30°C in Studier’s autoinduction media ZYP5052 (41) supplemented with the appropriate antibiotics [kanamycin (100 μg/ml) and chloramphenicol (34 μg/ml)]. All liquid cultures were performed under agitation (180 to 220 rpm).
Saccharomyces cerevisiae strains were routinely grown at 30°C in YPD (yeast extract, peptone, and dextrose) media or SD (Synthetic Defined) media supplemented with the appropriate dropout solution (-His, -His-Trp, and -His-Ura-Trp). All liquid cultures were performed under agitation (180 to 220 rpm).
Molecular biology
All the oligonucleotides used in this study were provided by a commercial supplier (Eurogentec) and are listed in table S4. Unless stated otherwise, all polymerase chain reactions (PCRs) to amplify DNA cassettes used for cloning or genome editing were performed using the Q5 polymerase (NEB); all PCRs to screen yeast clones and mycoplasma clones were performed using the Advantage2 polymerase mix (Clontech); all PCRs for colony PCR were performed using the Taq polymerase (NEB).
Plasmids for the expression of recombinant MIBs and MIPs in E. coli
The cloning strategy used here is identical to that previously reported to express and produce MIB83 and MIP82 (12). The amino acid sequences of the proteins encoded by the loci MMCAP2_0589–0584 were extracted from the MolliGen 3.0 database (https://services.cbib.u-bordeaux.fr/molligen/) (42), codon-optimized for expression in E. coli using the web-based tool JCat (http://www.jcat.de) (43) with the default parameters for E. coli, and chemically synthesized (Twist Bioscience). The coding sequences, truncated to remove the predicted N-terminal transmembrane domains, were amplified by PCR using the Q5 DNA polymerase (NEB) and cloned in the pET28a(+) vector (Merck) using the In-Fusion Cloning kit (Clontech). The inserts were cloned in-frame with an N-terminal 6-His tag and a thrombin cleavage site. The vectors were then transformed by heat shock in chemically competent E. coli NEB5-alpha. The transformed bacteria were plated on solid LB media and selected for kanamycin resistance. Individual colonies were screened by colony PCR and the plasmids were isolated from positive clones using the NucleoSpin Plasmid kit (Macherey Nagel) and checked by sequencing.
Plasmids for the expression of guide RNA in S. cerevisiae
Target sequences for the Cas9 nuclease were selected by using the “CRISPR Guides” tool available in the Benchling work environment (https://benchling.com). The raw nucleotide sequence of the Mmc genome was used as input. The software parameters were “Design Type: Single Guide,” “Guide Length: 20,” “Genome: R64–1-1 (sacCer3),” and “PAM: NGG.” All other parameters were set to default. Target sequences in the desired region with the highest on-target score and the lowest off-target score were selected. The corresponding plasmids were produced by modifying the protospacer sequence of the plasmid p426-SNR52p-gRNA.Y-SUP4t, using the Q5 Site Directed Mutagenesis kit (NEB). After the cloning reactions, the plasmids were transformed by heat shock in chemically competent E. coli NEB5-alpha (NEB). The transformed bacteria were plated on solid LB media and selected for ampicillin resistance. Individual colonies were subsequently cultivated and used for plasmid isolation using the NucleoSpin Plasmid kit (Macherey Nagel). Plasmids were sequenced to verify the absence of errors.
In-yeast recombination templates
Linear DNA fragments used as recombination templates in yeast are composed of two sequences homologous to the regions flanking the bacterial genome locus to edit. To construct the Mmc ΔMIB-MIP mutant strain, these sequences were 45-bp long each. The corresponding 90-bp fragments were produced by annealing two complementary 90-base oligonucleotides. To do so, both oligonucleotides were mixed in equimolar amounts in CutSmart buffer (NEB), denatured by heating to 95°C and annealed by gradually cooling to 16°C at the rate of 0.1°/s in a thermocycler. To construct the Mmc MIB83-MIP82 and Mmc MIP82-HA mutant strains, the DNA cassette contained two 500-bp sequences. Each of the 500-bp fragment was amplified by PCR using Mmc GM12 genomic DNA as template. The amplicons were purified using the Illustra GFX kit (GE), mixed in equimolar amounts and stitched together by overlapping PCR. The resulting 1000-bp amplicon was purified and 5′ A-tailed using the Taq polymerase (NEB). The resulting fragment was A-T cloned in the pGEMT-easy vector. After the molecular cloning reaction, the plasmids were transformed by heat shock in chemically competent E. coli NEB5-alpha. The transformed bacteria were plated on solid LB media and selected for ampicillin resistance. Individual colonies were subsequently cultivated and used for plasmid isolation using the NucleoSpin Plasmid kit (Macherey Nagel). Plasmids were sequenced to verify the absence of errors. Last, the desired 1000-bp fragment was a PCR-amplified clone using the Q5 DNA polymerase (NEB) and purified using the Illustra GFX kit (GE).
Generation of Mmc mutant strains
Editing of Mmc chromosome cloned in yeast
Mutant strains of Mmc GM12 were generated using the “in-yeast genome edition and back transplantation” method (44). This technique relies on our ability to clone a bacterial chromosome in S. cerevisiae and edit it using tools available in this yeast. The edited bacterial genome can then be extracted and transplanted in a recipient cell, where it will drive the emergence of a new mutant bacterial strain.
The chromosome of Mmc GM12 was previously cloned in the yeast S. cerevisiae W303 (45), through the integration in the bacterial genome of a yeast centromeric plasmid (YCp) between the loci MMCAP2_0016 and MMCAP2_0017. This YCp bears a yeast centromere and origin of replication, the His6 auxotrophic marker, and the TetM selection marker. The centromere and origin of replication drive the correct replication of the bacterial chromosome, while the His6 marker ensures its maintenance. This YCp-marked bacterial genome can be transplanted to generate the strain Mmc 1.1, which is resistant to tetracycline. S. cerevisiae W303–Mmc 1.1 was used to generate all the Mmc mutant strains used in this study.
Editing of the Mmc 1.1 genome in yeast was carried out using the CRISPR-Cas9 system (44, 46). First, the yeast W303–Mmc 1.1 was transformed with 300 ng of the plasmid pCas9, using the lithium acetate method (47). This plasmid allows the constitutive expression of the Streptococcus pyogenes Cas9 nuclease. Yeast transformants were selected and maintained on solid SD-His-Trp media. The yeast W303–Mmc 1.1–pCas9 was then transformed again, using the same lithium acetate protocol, with 300 ng of the appropriate plasmid pgRNA and 500 ng of the appropriate DNA recombination template. After transformation, the yeasts were maintained 48 hours in liquid SD-His-Trp-Ura media at 30°C under shaking and then plated on solid SD-His-Trp-Ura media. Individual yeast clones were screened to isolate the ones that carried the properly edited bacterial genome. To do so, three steps were performed.
First, yeast total DNA was extracted using the method described by Kouprina and Larionov (48) and used as a template for a PCR analysis with primers flanking the targeted locus. If an amplicon of correct size was generated, it was subsequently sequenced to confirm that the edited locus matched the expected design. Subsequently, the total yeast DNA extract was used as a template for a multiplex PCR analysis, using 10 pairs of primers targeting 10 loci of various sizes (ranging from 377 to 1010 bp) spread evenly on the bacterial genome. This multiplex PCR was used to rapidly assess the integrity of the bacterial genome, to screen out clones in which large genomic regions have been deleted. Last, the size of the bacterial chromosome carried in the yeast was checked using pulsed-field gel electrophoresis (PFGE) to check for potential genomic rearrangements or deletions between two adjacent multiplex PCR loci. To do so, agarose plugs containing the bacterial genomes were prepared using the protocol described by Tsarmpopoulos et al. (44) and the CHEF Mammalian Genomic DNA Plug Kit (Bio-Rad). Briefly, each yeast clone was cultured in 100 ml of SD-His-Trp-Ura media. The cells were harvested by centrifugation, washed, and counted on a Malassez counting chamber. Cells (3 × 10⁸) were then embedded in 100 μl of 1% low melt agarose and cast in a mold to form cuboid-shaped plugs. After hardening and removal from the molds, the plugs were incubated in a cell lysis solution containing detergents and Proteinase K (Bio-Rad). After a washing step [20 mM tris and 50 mM EDTA (pH 8)] to remove the lysed components, the plugs contained only DNA molecules. Before the PFGE, the yeast DNA has to be removed from the plugs. To do so, the plugs were incubated overnight with a cocktail of restriction enzymes [30 U of Fse I, Rsr II, and Asi SI (NEB)] that do not target the bacterial genome. After restriction, the yeast chromosome fragments were removed from the plugs by standard gel electrophoresis. Under these conditions, the large, circular bacterial chromosomes are not mobile and therefore stayed in the plugs. After washing, the plugs were incubated overnight with 30 U of Xho I (NEB) to generate three large DNA fragments. The size of these fragments was analyzed by PFGE and compared to that of the expected design (590, 269, and 226 kbp).
Genome transplantation and transplant screening
To generate mutant bacterial strains, the edited genomes carried in yeast were back-transplanted in the recipient cell Mcap ΔRE, as described by Lartigue et al. (45). Briefly, agarose plugs containing the bacterial chromosomes were digested by incubation with β-agarase. The resulting chromosomal DNA solution was transformed in Mcap ΔRE cells using a polyethylene glycol–based transformation method. The transformants were selected by plating on solid SP5 media, supplemented with tetracycline (5 μg/ml). After 5 days of incubation at 37°C, individual colonies were collected using a small core drill, inoculated in liquid SP5 media supplemented with tetracycline (5 μg/ml) and incubated 24 hours at 37°C. The resulting culture was used to inoculate at 1% (v/v) fresh SP5 media supplemented with tetracycline (5 μg/ml). This new culture was incubated 24 hours at 37°C. The same passaging process was repeated thrice. At the end of the third passage, a 200-μl sample of the culture was collected and used for transplant screening. The cells were harvested by centrifugation [6800 relative centrifugal force (rcf) for 10 min], suspended in tris-EDTA buffer, and lysed by heating at 95°C for 10 min. The DNA extracted in the resulting solution was used as template for PCR analysis using the same primer pairs as for the yeast transformant screening process (see above). Validated transplants were stored as cell suspensions in fetal bovine serum at −80°C.
Proteomics
Sample preparation and protein digestion
Mmc cells grown in SP5 media were harvested by centrifugation (6800 rcf for 10 min), washed in SP5 depleted of fetal bovine serum, and suspended in 1× Laemmli sample buffer with β-mercaptoethanol. After heat denaturation (95°C for 10 min), the samples were separated by SDS-PAGE on a 10% acrylamide gel. After colloidal Coomassie staining, each sample lane was cut into four equal bands and each band was subsequently cut again into 1-mm × 1-mm gel pieces. Gel pieces were destained in 25 mM ammonium bicarbonate and 50% acetonitrile, rinsed twice in ultrapure water, and shrunk in acetonitrile for 10 min. After acetonitrile removal, gel pieces were dried at room temperature, covered with the trypsin solution (10 ng/μl in 50 mM NH4HCO3), rehydrated at 4°C for 10 min, and lastly incubated overnight at 37°C. Spots were then incubated for 15 min in 50 mM NH4HCO3 at room temperature with rotary shaking. The supernatant was collected, and an H2O/acetonitrile/HCOOH (47.5:47.5:5) extraction solution was added onto gel slices for 15 min. The extraction step was repeated twice. Supernatants were pooled and dried in a vacuum centrifuge. Digests were lastly solubilized in 0.1% HCOOH.
nLC-MS/MS analysis
Peptide mixture was analyzed on an Ultimate 3000 nanoLC system (Dionex) coupled to an Electrospray Orbitrap Fusion Lumos Tribrid Mass Spectrometer (Thermo Fisher Scientific). Ten microliters of peptide digests was loaded onto a 300-μm (inner diameter) × 5-mm C18 PepMap trap column (LC Packings) at a flow rate of 10 μl/min. The peptides were eluted from the trap column onto an analytical 75-mm (inner diameter) × 50-cm C18 Pep-Map column (LC Packings) with a 4 to 40% linear gradient of solvent B in 45 min (solvent A was 0.1% formic acid and solvent B was 0.1% formic acid in 80% acetonitrile). The separation flow rate was set at 300 nl/min. The mass spectrometer was operated in positive ion mode at a 1.8-kV needle voltage. Data were acquired using Xcalibur 4.1 software in a data-dependent mode. Mass spectrometry (MS) scans [375 to 1500 mass/charge ratio (m/z)] were recorded at a resolution of R = 120,000 (at m/z 200) and an AGC target of 4 × 10⁵ ions collected within 50 ms. Dynamic exclusion was set to 60 s and top speed fragmentation in HCD mode was performed over a 3-s cycle. MS/MS scans with a target value of 3 × 10³ ions were collected in orbitrap [with a resolution of R = 30,000 (at m/z 200)] with a maximum fill time of 54 ms. In addition, only +2 to +7 charged ions were selected for fragmentation. Other settings were as follows: no sheath or auxiliary gas flow, heated capillary temperature, 275°C; normalized HCD collision energy of 30% and an isolation width of 1.6 m/z. Monoisotopic precursor selection was set to peptide, and an intensity threshold was set to 2.5 × 10⁴.
Database search and results processing
Data were searched by SEQUEST through Proteome Discoverer 1.4 (Thermo Fisher Scientific) against a custom Mmc protein database containing 822 entries based on the CDS data available in MolliGen (42). Spectra from peptides higher than 5000 Da or lower than 350 Da were rejected. The search parameters were as follows: Mass accuracy of the monoisotopic peptide precursor and peptide fragments was set to 10 parts per million and 0.02 Da, respectively. Only b and y ions were considered for mass calculation. Oxidation of methionines (+16 Da) was considered as variable modification and carbamidomethylation of cysteines (+57 Da) was considered as fixed modification. Two missed trypsin cleavages were allowed. Peptide validation was performed using percolator algorithm, and only “high confidence” peptides were retained, corresponding to a 1% false-positive rate at the peptide level.
Label-free quantitative data analysis
Raw liquid chromatography (LC)–MS/MS data were imported in Progenesis QI for Proteomics 2.0 (Nonlinear Dynamics Ltd., Newcastle, UK). Data processing includes the following steps: (i) features detection, (ii) features alignment across the nine samples, (iii) volume integration for two to six charge-state ions, (iv) normalization on features ratio median, (v) import of sequence information, (vi) calculation of protein abundance (sum of the volume of corresponding peptides), and (vii) a statistical test (ANOVA, analysis of variance) was carried out for each group comparison and proteins were filtered based on P < 0.05. Noticeably, only nonconflicting features and unique peptides were considered for calculation at the protein level. Quantitative data were considered for proteins quantified by a minimum of two peptides.
Animal samples
Goat sera
Normal goat sera were purchased from commercial suppliers (Sigma-Aldrich or Merck). These sera are indicated as “collected from USDA inspected facilities. All animals had received ante and post mortem inspections and were found to be free of contagious diseases.”
Sera from goats infected by M. mycoides subsp. capri strain #13235 were provided by an academic research laboratory. Samples were collected before inoculation and 12 days after inoculation in previous studies (16). Upon reception, all sera were sterilized by passing through a 0.45-μm filter, aliquoted, and stored at −20°C until use.
For some assays, it was necessary to lower the albumin content of the sera, as this protein is present in very large amount and can mask or distort the signal of other proteins in SDS-PAGE or Western blot analysis. Albumin depletion was performed using the Pierce Albumin Depletion Kit (Thermo Fisher Scientific) following the manufacturer’s specific protocol for caprine serum. Briefly, 130 μl of sera was first buffer-exchanged using Zeba Spin Desalting columns (Thermo Fisher Scientific) preequilibrated in 25 mM tris (pH 7.5) and 25 mM NaCl. Subsequently, 75 μl of buffer-exchanged serum was passed through a bed of 200 μl of Cibacron Blue agarose, preequilibrated in 25 mM tris (pH 7.5) and 25 mM NaCl. The flow through was collected and is considered to be albumin-depleted.
Goat colostrum
Goat colostrum samples were collected in the 48 hours postpartum, from a herd of does raised in an academic research laboratory experimental farm. All animals were monitored during husbandry and were found to be free of diseases. Colostrum samples were pooled from six animals, aliquoted, and stored at −20°C until use.
Protein purification
Recombinant MIBs and MIPs
The plasmids encoding the recombinant MIBs and MIPs were individually transformed by heat shock in competent E. coli Rosetta 2 (DE3) (Merck). Transformed bacteria were plated on LB solid media supplemented with kanamycin (50 μg/ml), chloramphenicol (34 μg/ml), and glucose (0.5% m/v) and incubated at 37°C. The colonies from one plate were scrapped in 1 ml of LB media using a cell spreader. The resulting cell suspension was used to inoculate 1 liter of Studier ZYP5052 autoinduction media, supplemented with kanamycin (100 μg/ml) and chloramphenicol (34 μg/ml), in 2-liter baffled flasks closed by a porous membrane for gas exchange. After 2 hours of incubation at 37°C, the culture was placed at 30°C for 19 to 22 hours. Cells were subsequently harvested by centrifugation (4500 rcf for 15 min), weighed, flash-frozen in liquid N2, and stored at −20°C until use. Cell lysis was performed by suspending the cell pellet in lysis buffer [50 mM tris-Cl (pH 8), 150 mM NaCl, 10 mM imidazole, and 2% (w/v) glycerol] supplemented with lysozyme (0.1 mg/ml) (Sigma-Aldrich), deoxyribonuclease I (2 μg/ml) (Sigma-Aldrich), and complete EDTA-free antiprotease (Roche). Five milliliters of buffer was used for each gram of cell pellet to lyse. The cell suspension was incubated at room temperature for 30 min and then sonicated using a Vibra-Cell 75115 VC 505 (Bioblock Scientific) for 15 cycles of 10 s on at 40 W and 59 s off while keeping the sample on ice at all time. The lysate was then clarified by centrifugation (45,000 rcf for 45 min at 4°C), and the resulting supernatant was filtered on 0.45 μm. The clarified lysate was then loaded on a 5-ml HisTrap FF column (GE), preequilibrated in lysis buffer, using an AKTA Start fast protein LC (FPLC) system (GE). After binding of the 6His-tagged recombinant proteins to the resin, an extensive washing step with 30 column volumes of lysis buffer was performed to remove unbound proteins. Bound proteins were eluted with 10 column volumes of elution buffer [50 mM tris-Cl (pH 8), 150 mM NaCl, 83.5 mM imidazole, and 2% (w/v) glycerol]. Elution fractions were collected and kept at 4°C and analyzed by SDS-PAGE to assess their purity. Appropriate fractions were pooled and concentrated on Vivaspin 30-kDa MWCO (molecular weight cut-off) ultrafiltration units (Merck), down to a volume of 2 ml. This concentrated protein solution was further polished by size exclusion chromatography using a HiPrep 16/60 Superdex 200 column (GE), preequilibrated in 20 mM Hepes (pH 7.5) and 150 mM NaCl, driven by an AKTA Purifier FPLC system (GE). The main elution peak was collected and a sample was analyzed by SDS-PAGE to assess purity. Protein concentration was determined spectrophotometrically by measuring the OD280nm (optical density at 280 nm) of the protein solution, using a Take3 Micro-Volume Plate and an Epoch plate reader (BioTek). The molar extinction coefficient of the recombinant protein was calculated using Protparam (https://web.expasy.org/protparam/). The purest and most concentrated fractions were pooled, aliquoted, and flash-frozen in liquid N2. Purified proteins were stored at −80°C until use.
Goat sIgA
Goat sIgA was purified from goat colostrum, using a protocol derived from Azwai et al. (49). First, the frozen colostrum was thawed and defatted by centrifugation (4500 rcf for 30 min at 20°C). Casein was then acid-precipitated by reducing the colostrum pH to 4, through the addition of 0.1 N HCl. After centrifugation (45,000 rcf for 30 min at 20°C), the supernatant was collected and neutralized by the addition of 2 M tris until the pH reached 8. This whey solution was then filtered on 0.45 μm and kept at 4°C.
sIgA was isolated from the whey solution using serial steps of size exclusion and affinity chromatography. First, the whey proteins were fractionated by size exclusion chromatography using a Sephacryl S300 column (GE) preequilibrated in 50 mM tris-Cl (pH 8) and 150 mM NaCl. sIgA content of the different elution fractions was analyzed by Western blot using a rabbit anti-goat sIgA primary antibody (Bethyl) and an HRP-coupled goat anti-rabbit IgG secondary antibody (Sigma-Aldrich). The sIgA-rich fractions were pooled and passed over a HiTrap Protein-G HP column (GE), preequilibrated in 20 mM phosphate buffer (pH 4), to selectively remove the contaminating goat IgG. The sIgA flowing through the protein G column was collected and polished by a second size exclusion chromatography on the Sephacryl S300 column. The main elution peak was collected and analyzed by Western blot to confirm the absence of goat IgG, using a mouse anti-goat IgG primary antibody (Jackson ImmunoResearch) and an HRP-coupled goat anti-mouse IgG secondary antibody (Sigma-Aldrich). sIgA concentration was determined spectrophotometrically by measuring the OD280nm of the protein solution, using a Take3 Micro-Volume Plate and an Epoch plate reader (BioTek). The molar extinction coefficient used for this protein is identical to the one used in Kanamaru et al. (50) for bovine sIgA. The purified protein was aliquoted, flash-frozen in liquid N2, and stored at −80°C until use.
Cryo–electron microscopy
Sample preparation
For the MIB83-Fab-S759AMIP82 complex, freshly purified MIB83 and S759AMIP82 and commercial goat IgG Fab fragment (Jackson ImmunoResearch) were used for cryo-EM sample preparation. Proteins were mixed and incubated at 4°C for 4 hours at final concentrations of 1 mg/ml each. The mixture was loaded on a Superdex 200 Increase 10/300 (GE Healthcare) size exclusion chromatography column and eluted with 20 mM Hepes and 150 mM NaCl (pH 7.5). Fractions containing the complex were collected and applied to C-Flat R2/1-2Cu-50 grids (QUANTIFOIL), previously glow-discharged for 45 s at 2 mA (ELMO Cordouan). The sample was vitrified with a Vitrobot Mark IV (Thermo Fisher Scientific) at 4°C at 100% humidity. Four microliters of sample was applied onto the glow-discharged grids. The excess of sample was immediately blotted away with 4-s blot time and 0 blot force with Whatman paper (⌀ 55/20 mm) and the grid was plunged into liquid ethane. For the MIB83-Fab complex, MIB83 and Fab fragment were mixed and incubated at room temperature for 20 min at final concentrations of 1 mg/ml each. The complex was isolated by gel filtration using the same column and buffer as above. QUANTIFOIL R2/2-Cu-200 grids were glow-discharged for 30 s at 2 mA. Four microliters of sample was vitrified under similar conditions to previous ones with 2-s blot time and 0 blot force.
Data acquisition
For the MIB83-Fab-S759AMIP82 complex, movies were recorded on Titan Krios (Thermo Fisher Scientific) operated at 300 kV equipped with Gatan K2 Summit direct electron-counting camera at ×165,000 magnification and a pixel size of 0.83 Å per pixel using SerialEM (51). Micrographs were collected in a defocus range of −0.7 to −2.7 μm and with a dose of 1.45 electrons per Å2 per frame.
For the MIB83-Fab complex, movies were recorded on Talos Arctica (Thermo Fisher Scientific) operated at 200 kV equipped with a Gatan K2 Summit direct electron-counting camera at ×36,000 magnification and a pixel size of 1.13 Å per pixel using SerialEM (51). Micrographs were collected in a defocus range of −0.5 to −2.1 μm and with a dose of 0.78 electrons per Å2 per frame.
Image processing
For the MIB83-Fab-S759AMIP82 complex, movies were aligned for beam-induced motion using MotionCor2 (52) and CTF (contrast transfer function) parameters were assessed using the computer program GCTF. The following steps were performed using RELION (v3.0.7) (53). Details and statistics about each dataset are provided in table S1. MIB83-Fab-S759AMIP82 complexes were manually picked and particles were extracted using a box size of 256 pixels, and then these particles were 2D classified. The 2D classes corresponding to distinct orientations of the complex were selected and used as references to automatically pick particles in all the micrographs. After extraction, 2,587,740 particles were processed using cryoSPARC (v2.13.2) (54) and several rounds of 2D classification were performed. Using 925,964 particles, an initial 3D map was reconstructed without imposing symmetry. This initial map was refined using nonuniform refinement. This refined 3D map and the particles were further processed in RELION to perform 3D classification. One class with 255,991 particles was selected, a Bayesian polishing was applied on this particle dataset, and a final 3D refinement was performed. The final resolution was calculated with two masked half-maps, using 0.143 Fourier shell correlation (FSC) cutoff criterion. Local resolution was estimated using RELION (53) (fig. S2).
For the MIB83-Fab fragment complex, movies were aligned using full-frame motion correction on cryoSPARC (v2.13.2) (54) and CTF parameters were assessed using CTFFIND4 (55). The particles were automatically picked using blob picker and 6,980,198 particles were extracted using a box size of 160 pixels. Several rounds of 2D classification were performed and 3,517,059 were saved. A smaller subset of 635,925 particles was used for an initial 3D map, which was reconstructed without imposing symmetry. The 3,517,059 particles and the initial 3D map were used to perform a nonuniform refinement. The final resolution was calculated with two-masked half-maps, using a 0.143 FSC cutoff criterion. Local resolution was estimated using cryoSPARC (fig. S7).
Model building and refinement of atomic models
For the model of MIB83 in the MIB83-Fab-S759AMIP82 complex, a homology model of Protein M TD [Protein Data Bank (PDB): 4NZR] was fitted in the refined cryo-EM map. Using this model as starting point, an initial 3D model of MIB83 was manually built in Coot (v0.8.9.2) (56). The map was sharpened in PHENIX (v1.16-3546-000) (57). The final model was refined by several rounds of manual refinement in Coot software and real-space refinement using phenix.real_spacerefine with secondary structure restraints. The model was validated using MolProbity (58) and phenix.validation_cryoem implemented in PHENIX software.
For the model of S759AMIP82, similar processes were performed using protease domains as starting point. The densities corresponding to the N-terminal domain (residues 41 to 157) of MIP were poorly resolved. A homology model of this domain was generated using the available crystal structure of this domain from Ureaplasma parvum as a template (PDB: 3JVC). Rigid-body docking followed by molecular dynamics flexible fitting [using MDFF (59) in VMD molecular visualization software (60) using 200 minimization steps and 50,000 time steps] was performed to place this domain in the corresponding densities.
A homology model for a goat Fab was generated in SWISS-MODEL (61) using a consensus sequence for the light and heavy chains. Rigid-body docking followed by molecular dynamics flexible fitting (using MDFF in VMD using 200 minimization steps and 50,000 time steps) was performed to fit the Fab model into the corresponding densities.
For the model of MIB83 in the MIB83-Fab complex, the previous refined MIB83 model was fitted in the refined cryo-EM map. The map was sharpened in PHENIX. Several rounds of manual refinement in Coot software were used to refine the final model and real-space refinement using phenix.real_spacerefine with noncrystallographic symmetry restraints. The model was validated using MolProbity and phenix.validation_cryoem implemented in PHENIX software.
Immunoglobulin cleavage assay
In vitro cleavage
Purified IgG from goat serum (Sigma-Aldrich), IgM from goat serum (Rockland), IgG anti-HRP from goat (Jackson ImmunoResearch), IgG anti-hAlbumin from goat (Bethyl), IgG anti-hTransferrin from goat (Bethyl), and IgG anti-HA tag (Bethyl) were purchased from commercial vendors. Goat sIgA and recombinant MIBs and MIPs were prepared in-house (see above). Antibody cleavage assays were performed by mixing the purified proteins at final concentrations of 4 μM MIB, 4 μM MIP, 2 μM IgG, 1 μM sIgA, and 0.4 μM IgM. These concentrations correspond to the following molar ratios: IgG:MIB:MIP, 1:2:2; sIgA:MIB:MIP, 1:4:4; and IgM:MIB:MIP, 1:10:10. These ratios correspond to one MIB and one MIP molecule per Fab fragment. The reactions were assembled in a final volume of 15 μl of PBS. The immunoglobulins were systematically added first, followed by the MIBs and lastly the MIPs. The reactions were incubated at room temperature for 10 min, before addition of 5 μl of 4× Laemmli buffer containing β-mercaptoethanol and denaturation at 95°C for 10 min. Samples were subsequently separated by SDS-PAGE on a 10% acrylamide gel and stained using colloidal Coomassie staining to assess immunoglobulins integrity. Alternatively, Western blot was used to specifically detect the immunoglobulin chains in the samples. Goat IgG was detected using a mouse anti-goat IgG primary antibody (Jackson ImmunoResearch) and an HRP-coupled goat anti-mouse IgG secondary antibody (Sigma-Aldrich). Goat IgM was detected using a rabbit anti-goat IgM primary antibody (Sigma-Aldrich) and an HRP-coupled goat anti-rabbit IgG secondary antibody. Goat sIgA was detected as described above.
Antigen-bound immunoglobulin cleavage
HRP isolated from horseradish roots (Sigma-Aldrich), human albumin (Jackson ImmunoResearch), and human transferrin (Jackson ImmunoResearch) were purchased from commercial vendors. Immunoglobulin cleavage assays were performed by mixing the purified proteins at final concentrations of 2 μM IgG, 10 μM antigen, 5 μM MIB, and 5 μM MIP, in a final volume of 15 μl of PBS. The antibody and the antigen were incubated for 20 min at room temperature before sequential addition of MIB and MIP. The reaction was further incubated for 10 min at room temperature before addition of 5 μl of 4× Laemmli buffer containing β-mercaptoethanol and denaturation at 95°C for 10 min. Samples were subsequently separated by SDS-PAGE on a 10% acrylamide gel and stained using colloidal Coomassie staining to assess immunoglobulin integrity. Alternatively, Western blot was used to specifically detect the immunoglobulin chains in the samples, as described above.
A similar cleavage assay was performed by mixing the purified proteins at final concentrations of 3 μM IgG anti-antigen, 10 μM antigen, 6 μM MIB, and 6 μM MIP, in a final volume of 200 μl of PBS. After incubation of the protein mixture, the samples were analyzed by size exclusion chromatography using a Superdex 200 column (GE), preequilibrated in PBS, and driven by an AKTA Purifier FPLC system (GE). Elution fractions of 0.5 ml were collected and subsequently concentrated twofold using a Savant SpeedVac concentrator (Thermo Fisher Scientific) at room temperature. To 15 μl of the concentrated fractions, 5 μl of 4× Laemmli buffer containing β-mercaptoethanol was added. Samples were denatured at 95°C for 10 min and subsequently separated by SDS-PAGE on a 10% acrylamide gel and stained using colloidal Coomassie.
In cellulo immunoglobulin cleavage
Mmc cells were first inoculated in SP5 media from frozen stock and grown overnight. Approximately 1 × 10⁹ cells from cultures in late exponential phase (pH ~6.8) were collected by centrifugation at 6800 rcf for 10 min. The pellet was washed by resuspending the cells in 500 μl of fresh SP5 media without fetal bovine serum (SP5ΔFBS) and then harvested again by centrifugation at 6800 rcf for 10 min. The pellet was then resuspended in 15 μl of SP5ΔFBS containing either purified immunoglobulin (100 ng/μl) or 2% (v/v) of albumin-depleted goat serum. After 30 min of incubation at 37°C, the cells were pelleted by centrifugation at 6800 rcf for 10 min. The supernatant was collected and mixed with 5 μl of 4× Laemmli buffer containing β-mercaptoethanol and denatured at 95°C for 10 min. Immunoglobulin integrity was checked by Western blot using the protocols described above.
Agglutination assays
Mmc cells were first inoculated in SP5 media from frozen stock and grown overnight. The next day, the cultures in late exponential phase (pH ~6.8) were used to inoculate fresh SP5ΔSerum containing 4% goat serum (v/v). One-milliliter cultures were performed in 1.5-ml tubes, while 200-μl cultures were performed in flat-bottomed 96-well Costar cell culture plates (Corning). Cultures were incubated overnight at 37°C without agitation. Agglutination in tubes was assessed by placing the tubes in a hollowed rack and letting them stand undisturbed for 30 min before imaging with a Samsung Galaxy S8 SM-G950. Agglutination in microplates was assessed by observing and imaging individual wells with either a Nikon SMZ1270 stereomicroscope coupled to a Nikon DS-Fi2 camera and a Nikon DS-U3 controller, or a Nikon Eclipse TS100 inverted microscope coupled to a DS-Fi2 camera and a DS-L3 standalone camera controller. To image the aggregate, the tubes were mixed by inversion and the culture was collected using a wide-bore pipette tip. Samples were mounted between a glass slide and a coverslip and imaged using a Nikon Eclipse Ti microscope equipped with a Nikon C-DO dark field condenser coupled to a Nikon DS-Qi1Mc camera and a Nikon DS-U3 controller.
To quantify the agglutination, the microplate wells were emptied by gentle pipetting to not disturb the settled aggregates. Optical density in each well was measured at 310 nm using an Epoch 3 spectrophotometer.
Acknowledgments
Goat colostrum samples were provided by X. Nouvel and H. Caillat (UE1373 Ferlus - INRAE). Infected goat sera were provided by F. Tardy (UMR Mycoplasmoses des ruminants - ANSES). We thank E. Pafiny-Satez for assistance with early experiments on Mmc. Phylogenic trees were provided by V. Baby. We thank A. Bezault and the IECB Cryo-EM facility for assistance in cryo-EM sample optimization and data collection. We acknowledge the European Synchrotron Radiation Facility for provision of beamtime on CM01 and thank E. Kandiah for assistance. We thank S. Claverol and acknowledge the Plateforme Protéome at the Center for Functional Genomics in Bordeaux for performing the proteomics analysis. We thank F. Opazo and H. Remaut for input on improving the original manuscript. Funding: This study was funded by the French National Agency for Research (ANR) grant ANR-17-CE35-0002-01 DACSyMy. Author contributions: E.M., R.F., and Y.A. designed the study. P.N., L.B., G.G., R.A., C.L., P.S.-P., and Y.A. performed experiments. P.N., L.B., E.M., R.F., and Y.A. interpreted results and wrote the manuscript. E.M., R.F., and Y.A. supervised the project and acquired funding. Competing interests: The authors declare that they have no competing interests. Data and materials availability: All data needed to evaluate the conclusions in the paper are present in the paper and/or the Supplementary Materials. The cryo-EM densities of MIB-MIP-Fab and MIB-Fab have been deposited in the Electron Microscopy Data Bank under ID codes EMD-11729 and EMD-11731, respectively. The model for MIB and MIP in the MIB-MIP-Fab complex and for MIB in the MIB-Fab complex has been deposited in the PDB under ID codes PDB 7ADK and 7ADM, respectively. Raw cryo-EM data are available upon reasonable request to the corresponding authors.
SUPPLEMENTARY MATERIALS
Supplementary material for this article is available at http://advances.sciencemag.org/cgi/content/full/7/10/eabf2403/DC1
REFERENCES AND NOTES
- 1.Kuijl C., Neefjes J., New insight into the everlasting host-pathogen arms race. Nat. Immunol. 10, 808–809 (2009). [DOI] [PubMed] [Google Scholar]
- 2.Chaplin D. D., Overview of the immune response. J. Allergy Clin. Immunol. 125, S3–S23 (2010). [DOI] [PMC free article] [PubMed] [Google Scholar]
- 3.Schroeder H. W. J. Jr., Cavacini L., Structure and function of immunoglobulins. J. Allergy Clin. Immunol. 125, S41–S52 (2010). [DOI] [PMC free article] [PubMed] [Google Scholar]
- 4.Finlay B. B., McFadden G., Anti-immunology: Evasion of the host immune system by bacterial and viral pathogens. Cell 124, 767–782 (2006). [DOI] [PubMed] [Google Scholar]
- 5.Sidorin E. V., Solov’eva T. F., IgG-binding proteins of bacteria. Biochemistry (Mosc.) 76, 295–308 (2011). [DOI] [PubMed] [Google Scholar]
- 6.Choe W., Durgannavar T. A., Chung S. J., Fc-binding ligands of immunoglobulin G: An overview of high affinity proteins and peptides. Mater. (Basel) 9, 994 (2016). [DOI] [PMC free article] [PubMed] [Google Scholar]
- 7.Brezski R. J., Jordan R. E., Cleavage of IgGs by proteases associated with invasive diseases: An evasion tactic against host immunity? MAbs 2, 212–220 (2010). [DOI] [PMC free article] [PubMed] [Google Scholar]
- 8.M. May, M. F. Balish, A. Blanchard, The Order Mycoplasmatales, E. Rosenberg, E. F. DeLong, S. Lory, E. Stackebrandt, F. Thompson, Eds. (Springer Berlin Heidelberg, 2014), pp. 515–550. [Google Scholar]
- 9.Citti C., Blanchard A., Mycoplasmas and their host: Emerging and re-emerging minimal pathogens. Trends Microbiol. 21, 196–203 (2013). [DOI] [PubMed] [Google Scholar]
- 10.Cizelj I., Berčič R. L., Dušanić D., Narat M., Kos J., Dovč P., Benčina D., Mycoplasma gallisepticum and Mycoplasma synoviae express a cysteine protease CysP, which can cleave chicken IgG into Fab and Fc. Microbiology 157, 362–372 (2011). [DOI] [PubMed] [Google Scholar]
- 11.Grover R. K., Zhu X., Nieusma T., Jones T., Boero I., Mac Leod A. S., Mark A., Niessen S., Kim H. J., Kong L., Assad-Garcia N., Kwon K., Chesi M., Smider V. V., Salomon D. R., Jelinek D. F., Kyle R. A., Pyles R. B., Glass J. I., Ward A. B., Wilson I. A., Lerner R. A., A structurally distinct human mycoplasma protein that generically blocks antigen-antibody union. Science 343, 656–661 (2014). [DOI] [PMC free article] [PubMed] [Google Scholar]
- 12.Arfi Y., Minder L., Primo C. D., Roy A. L., Ebel C., Coquet L., Claverol S., Vashee S., Jores J., Blanchard A., Sirand-Pugnet P., MIB–MIP is a mycoplasma system that captures and cleaves immunoglobulin G. Proc. Natl. Acad. Sci. U.S.A. 113, 5406–5411 (2016). [DOI] [PMC free article] [PubMed] [Google Scholar]
- 13.Bujotzek A., Dunbar J., Lipsmeier F., Schäfer W., Antes I., Deane C. M., Georges G., Prediction of VH-VL domain orientation for antibody variable domain modeling. Proteins 83, 681–695 (2015). [DOI] [PubMed] [Google Scholar]
- 14.Brandtzaeg P., Secretory IgA: Designed for anti-microbial defense. Front. Immunol. 4, 222 (2013). [DOI] [PMC free article] [PubMed] [Google Scholar]
- 15.Yi J., Simpanya M. F., Settles E. W., Shannon A. B., Hernandez K., Pristo L., Keener M. E., Hornstra H., Busch J. D., Soffler C., Brett P. J., Currie B. J., Bowen R. A., Tuanyok A., Keim P., Caprine humoral response to Burkholderia pseudomallei antigens during acute melioidosis from aerosol exposure. PLOS Negl. Trop. Dis. 13, e0006851 (2019). [DOI] [PMC free article] [PubMed] [Google Scholar]
- 16.Tardy F., Maigre L., Tricot A., Poumarat F., Nguyen L., Le Grand D., Comparison of isolates of Mycoplasma mycoides subspecies capri from asymptomatic and septicaemic Goats. J. Comp. Pathol. 144, 70–77 (2011). [DOI] [PubMed] [Google Scholar]
- 17.Herold E. M., John C., Weber B., Kremser S., Eras J., Berner C., Deubler S., Zacharias M., Buchner J., Determinants of the assembly and function of antibody variable domains. Sci. Rep. 7, 12276 (2017). [DOI] [PMC free article] [PubMed] [Google Scholar]
- 18.Röthlisberger D., Honegger A., Plückthun A., Domain Interactions in the Fab Fragment: A comparative evaluation of the single-chain Fv and Fab format engineered with variable domains of different stability. J. Mol. Biol. 347, 773–789 (2005). [DOI] [PubMed] [Google Scholar]
- 19.Horne C., Klein M., Polidoulis I., Dorrington K. J., Noncovalent association of heavy and light chains of human immunoglobulins. III. Specific interactions between VH and VL. J. Immunol. 129, 660–664 (1982). [PubMed] [Google Scholar]
- 20.Chailyan A., Marcatili P., Tramontano A., The association of heavy and light chain variable domains in antibodies: Implications for antigen specificity. FEBS J. 278, 2858–2866 (2011). [DOI] [PMC free article] [PubMed] [Google Scholar]
- 21.Manivel V., Sahoo N. C., Salunke D. M., Rao K. V., Maturation of an antibody response is governed by modulations in flexibility of the antigen-combining site. Immunity 13, 611–620 (2000). [DOI] [PubMed] [Google Scholar]
- 22.Ohno S., Mori N., Matsunaga T., Antigen-binding specificities of antibodies are primarily determined by seven residues of VH. Proc. Natl. Acad. Sci. U.S.A. 82, 2945–2949 (1985). [DOI] [PMC free article] [PubMed] [Google Scholar]
- 23.Shirai H., Kidera A., Nakamura H., H3-rules: Identification of CDR-H3 structures in antibodies. FEBS Lett. 455, 188–197 (1999). [DOI] [PubMed] [Google Scholar]
- 24.Béven L., Charenton C., Dautant A., Bouyssou G., Labroussaa F., Sköllermo A., Persson A., Blanchard A., Sirand-Pugnet P., Specific evolution of F1-like ATPases in mycoplasmas. PLOS ONE 7, e38793 (2012). [DOI] [PMC free article] [PubMed] [Google Scholar]
- 25.Tulum I., Kimura K., Miyata M., Identification and sequence analyses of the gliding machinery proteins from Mycoplasma mobile. Sci. Rep. 10, 3792 (2020). [DOI] [PMC free article] [PubMed] [Google Scholar]
- 26.Stokes C. R., Soothill J. F., Turner M. W., Immune exclusion is a function of IgA. Nature 255, 745–746 (1975). [DOI] [PubMed] [Google Scholar]
- 27.Corthésy B., Role of secretory immunoglobulin A and secretory component in the protection of mucosal surfaces. Future Microbiol. 5, 817–829 (2010). [DOI] [PubMed] [Google Scholar]
- 28.Corthësy B., Secretory immunoglobulin A: Well beyond immune exclusion at mucosal surfaces. Immunopharmacol. Immunotoxicol. 31, 174–179 (2009). [DOI] [PubMed] [Google Scholar]
- 29.Hodge L. M., Simecka J. W., Role of upper and lower respiratory tract immunity in resistance to mycoplasma respiratory disease. J. Infect. Dis. 186, 290–294 (2002). [DOI] [PubMed] [Google Scholar]
- 30.Niang M., Diallo M., Cisse O., Kone M., Doucoure M., Roth J. A., Balcer-Rodrigues V., Dedieu L., Pulmonary and serum antibody responses elicited in zebu cattle experimentally infected with Mycoplasma mycoides subsp. mycoides SC by contact exposure. Vet. Res. 37, 733–744 (2006). [DOI] [PubMed] [Google Scholar]
- 31.Dunkelberger J. R., Song W.-C., Complement and its role in innate and adaptive immune responses. Cell Res. 20, 34–50 (2010). [DOI] [PubMed] [Google Scholar]
- 32.Lambris J. D., Ricklin D., Geisbrecht B. V., Complement evasion by human pathogens. Nat. Rev. Microbiol. 6, 132–142 (2008). [DOI] [PMC free article] [PubMed] [Google Scholar]
- 33.Hirayasu K., Saito F., Suenaga T., Shida K., Arase N., Oikawa K., Yamaoka T., Murota H., Chibana H., Nakagawa I., Kubori T., Nagai H., Nakamaru Y., Katayama I., Colonna M., Arase H., Microbially cleaved immunoglobulins are sensed by the innate immune receptor LILRA2. Nat. Microbiol. 1, 16054 (2016). [DOI] [PubMed] [Google Scholar]
- 34.Yamazaki R., Furukawa A., Hirayasu K., Yumoto K., Fukuhara H., Arase H., Maenaka K., Molecular mechanism of the recognition of bacterially cleaved immunoglobulin by the immune regulatory receptor LILRA2. J. Biol. Chem. 295, 9531–9541 (2020). [DOI] [PMC free article] [PubMed] [Google Scholar]
- 35.Hogan L., Bhuju S., Jones D. C., Laing K., Trowsdale J., Butcher P., Singh M., Vordermeier M., Allen R. L., Characterisation of bovine leukocyte Ig-like receptors. PLOS ONE 7, e34291 (2012). [DOI] [PMC free article] [PubMed] [Google Scholar]
- 36.Schwartz J. C., Hammond J. A., The unique evolution of the pig LRC, a single KIR but expansion of LILR and a novel Ig receptor family. Immunogenetics 70, 661–669 (2018). [DOI] [PMC free article] [PubMed] [Google Scholar]
- 37.Schwartz J. C., Sanderson N. D., Bickhart D. M., Smith T. P. L., Hammond J. A., The structure, evolution, and gene expression within the caprine leukocyte receptor complex. Front. Immunol. 10, 2302 (2019). [DOI] [PMC free article] [PubMed] [Google Scholar]
- 38.Goldman R. D., Antibodies: Indispensable tools for biomedical research. Trends Biochem. Sci. 25, 593–595 (2000). [DOI] [PubMed] [Google Scholar]
- 39.Labroussaa F., Lebaudy A., Baby V., Gourgues G., Matteau D., Vashee S., Sirand-Pugnet P., Rodrigue S., Lartigue C., Impact of donor–recipient phylogenetic distance on bacterial genome transplantation. Nucleic Acids Res. 44, 8501–8511 (2016). [DOI] [PMC free article] [PubMed] [Google Scholar]
- 40.Lartigue C., Glass J. I., Alperovich N., Pieper R., Parmar P. P., Hutchison C. A. III, Smith H. O., Venter J. C., Genome transplantation in bacteria: Changing one species to another. Science 317, 632–638 (2007). [DOI] [PubMed] [Google Scholar]
- 41.Studier F. W., Protein production by auto-induction in high-density shaking cultures. Protein Expr. Purif. 41, 207–234 (2005). [DOI] [PubMed] [Google Scholar]
- 42.Barré A., de Daruvar A., Blanchard A., MolliGen, a database dedicated to the comparative genomics of Mollicutes. Nucleic Acids Res. 32, D307–D310 (2004). [DOI] [PMC free article] [PubMed] [Google Scholar]
- 43.Grote A., Hiller K., Scheer M., Münch R., Nörtemann B., Hempel D. C., Jahn D., JCat: A novel tool to adapt codon usage of a target gene to its potential expression host. Nucleic Acids Res. 33, W526–W531 (2005). [DOI] [PMC free article] [PubMed] [Google Scholar]
- 44.Tsarmpopoulos I., Gourgues G., Blanchard A., Vashee S., Jores J., Lartigue C., Sirand-Pugnet P., In-yeast engineering of a bacterial genome using CRISPR/Cas9. ACS Synth Biol. 5, 104–109 (2016). [DOI] [PubMed] [Google Scholar]
- 45.Lartigue C., Vashee S., Algire M. A., Chuang R.-Y., Benders G. A., Ma L., Noskov V. N., Denisova E. A., Gibson D. G., Assad-Garcia N., Alperovich N., Thomas D. W., Merryman C., Hutchison C. A. III, Smith H. O., Venter J. C., Glass J. I., Creating bacterial strains from genomes that have been cloned and engineered in yeast. Science 325, 1693–1696 (2009). [DOI] [PubMed] [Google Scholar]
- 46.DiCarlo J. E., Norville J. E., Mali P., Rios X., Aach J., Church G. M., Genome engineering in Saccharomyces cerevisiae using CRISPR-Cas systems. Nucleic Acids Res. 41, 4336–4343 (2013). [DOI] [PMC free article] [PubMed] [Google Scholar]
- 47.Gietz R. D., Schiestl R. H., Willems A. R., Woods R. A., Studies on the transformation of intact yeast cells by the LiAc/SS-DNA/PEG procedure. Yeast 11, 355–360 (1995). [DOI] [PubMed] [Google Scholar]
- 48.Kouprina N., Larionov V., Selective isolation of genomic loci from complex genomes by transformation-associated recombination cloning in the yeast Saccharomyces cerevisiae. Nat. Protoc. 3, 371–377 (2008). [DOI] [PubMed] [Google Scholar]
- 49.Azwai S. M., Carter S. D., Woldehiwet Z., Immunoglobulins of camel (Camelus dromedarius) colostrum. J. Comp. Pathol. 114, 273–282 (1996). [DOI] [PubMed] [Google Scholar]
- 50.Kanamaru Y., Kuzuya Y., Tanahashi T., Purification of secretory IgA from bovine colostrum. Agric. Biol. Chem. 46, 1531–1537 (1982). [Google Scholar]
- 51.Mastronarde D. N., Automated electron microscope tomography using robust prediction of specimen movements. J. Struct. Biol. 152, 36–51 (2005). [DOI] [PubMed] [Google Scholar]
- 52.Rubinstein J. L., Brubaker M. A., Alignment of cryo-EM movies of individual particles by optimization of image translations. J. Struct. Biol. 192, 188–195 (2015). [DOI] [PubMed] [Google Scholar]
- 53.Scheres S. H. W., RELION: Implementation of a Bayesian approach to cryo-EM structure determination. J. Struct. Biol. 180, 519–530 (2012). [DOI] [PMC free article] [PubMed] [Google Scholar]
- 54.Punjani A., Rubinstein J. L., Fleet D. J., Brubaker M. A., cryoSPARC: Algorithms for rapid unsupervised cryo-EM structure determination. Nat. Methods 14, 290–296 (2017). [DOI] [PubMed] [Google Scholar]
- 55.Rohou A., Grigorieff N., CTFFIND4: Fast and accurate defocus estimation from electron micrographs. J. Struct. Biol. 192, 216–221 (2015). [DOI] [PMC free article] [PubMed] [Google Scholar]
- 56.Emsley P., Lohkamp B., Scott W. G., Cowtan K., Features and development of Coot. Acta Crystallogr. D Biol. Crystallogr. 66, 486–501 (2010). [DOI] [PMC free article] [PubMed] [Google Scholar]
- 57.Liebschner D., Afonine P. V., Baker M. L., Bunkóczi G., Chen V. B., Croll T. I., Hintze B., Hung L. W., Jain S., McCoy A. J., Moriarty N. W., Oeffner R. D., Poon B. K., Prisant M. G., Read R. J., Richardson J. S., Richardson D. C., Sammito M. D., Sobolev O. V., Stockwell D. H., Terwilliger T. C., Urzhumtsev A. G., Videau L. L., Williams C. J., Adams P. D., Macromolecular structure determination using X-rays, neutrons and electrons: Recent developments in Phenix. Acta Crystallogr. Sect. D, Struct. Biol. 75, 861–877 (2019). [DOI] [PMC free article] [PubMed] [Google Scholar]
- 58.Williams C. J., Headd J. J., Moriarty N. W., Prisant M. G., Videau L. L., Deis L. N., Verma V., Keedy D. A., Hintze B. J., Chen V. B., Jain S., Lewis S. M., Arendall W. B., Snoeyink J., Adams P. D., Lovell S. C., Richardson J. S., Richardson D. C., MolProbity: More and better reference data for improved all-atom structure validation. Protein Sci. 27, 293–315 (2018). [DOI] [PMC free article] [PubMed] [Google Scholar]
- 59.Trabuco L. G., Villa E., Mitra K., Frank J., Schulten K., Flexible fitting of atomic structures into electron microscopy maps using molecular dynamics. Structure 16, 673–683 (2008). [DOI] [PMC free article] [PubMed] [Google Scholar]
- 60.Humphrey W., Dalke A., Schulten K., VMD: Visual molecular dynamics. J. Mol. Graph. 14, 33–38 (1996). [DOI] [PubMed] [Google Scholar]
- 61.Waterhouse A., Bertoni M., Bienert S., Studer G., Tauriello G., Gumienny R., Heer F. T., de Beer T. A. P., Rempfer C., Bordoli L., Lepore R., Schwede T., SWISS-MODEL: Homology modelling of protein structures and complexes. Nucleic Acids Res. 46, W296–W303 (2018). [DOI] [PMC free article] [PubMed] [Google Scholar]
Associated Data
This section collects any data citations, data availability statements, or supplementary materials included in this article.
Supplementary Materials
Supplementary material for this article is available at http://advances.sciencemag.org/cgi/content/full/7/10/eabf2403/DC1