

Changes in tidal range due to anthropogenic impacts exacerbate nuisance flooding in estuaries along the U.S. coastline.
Abstract
Nuisance flooding (NF) is defined as minor, nondestructive flooding that causes substantial, accumulating socioeconomic impacts to coastal communities. While sea-level rise is the main driver for the observed increase in NF events in the United States, we show here that secular changes in tides also contribute. An analysis of 40 tidal gauge records from U.S. coasts finds that, at 18 locations, NF increased due to tidal amplification, while decreases in tidal range suppressed NF at 11 locations. Estuaries show the largest changes in NF attributable to tide changes, and these can often be traced to anthropogenic alterations. Limited long-term measurements from estuaries suggest that the effects of evolving tides are more widespread than the locations considered here. The total number of NF days caused by tidal changes has increased at an exponential rate since 1950, adding ~27% to the total number of NF events observed in 2019 across locations with tidal amplification.
INTRODUCTION
Nuisance flooding (NF), also known as minor, high-tide, sunny-day, or recurrent tidal flooding (1, 2), has become an important issue for many low-lying coastal cities in the United States and elsewhere (3–8) due to the substantial disruptions and damage that it can cause to transportation systems, buildings and other civil infrastructures, and businesses (9). Along most coasts, NF events occur seasonally due to the semiannual and annual mean sea-level cycles and seasonal variations in tides. During some years, NF frequency increases due not only to the 4.4-year perigean and 18.6-year nodal cycles in tidal amplitudes (10) but also to interannual mean sea-level variations (associated with natural climate variability, such as strong El Niño or La Niña events) (11, 12). Seasonal changes to bathymetry and wind forcing alter wind and wave setup and wave run-up (13, 14). Despite this considerable variability, the frequency, duration, and severity of NF events have increased at accelerating rates over the last few decades along the U.S. coast, especially the East and Gulf coasts (2, 11, 12, 15–18). Although the impacts of individual NF events are relatively minor, their future cumulative effects are projected to surpass those of rare extreme events in many locations (2, 16).
The primary cause of increased NF events is usually attributed to the secular increase and acceleration in sea level. Global mean sea level rose at an average rate of 3.3 ± 0.3 mm/year between 1993 and 2014 with an acceleration of 0.084 ± 0.025 mm/year2 (19, 20), thereby reducing the gap between high water levels and flood thresholds (3, 11, 15, 17, 21). Strong regional and local variability in sea-level rise and therefore NF trends are due to the global redistribution of water, large variability in vertical land motion, and other factors (22). Even within an individual estuary, subsidence rates can differ by up to 1 m/century (23, 24), and accelerating sea-level rise will likely bring a precipitous increase in the number and duration of NF events (2, 3, 15, 25). For example, increases of 380 to 810% in NF are projected for an assumed uniform rise in sea level of 150 mm (15). Because of higher rates of relative mean sea-level (RMSL) rise, gently sloped topography, and geological features (such as porous limestone in Florida), the U.S. East and Gulf coasts are more susceptible to NF than other U.S. coasts (2).
Evolution of coastal and estuary tides is another, often overlooked, driver for changes in NF frequencies (and durations). Trends in tidal amplitudes, phases, and other constituent properties are found in many places around the world, including the coasts of the United States, Europe, Japan, and Equatorial Pacific Ocean (26–32). Tidal evolution occurs at different spatial and temporal scales (26–32), due to both local factors (e.g., channel dredging, land reclamation, infrastructure development, and changed river flow) and regional/global factors (i.e., sea-level rise and ocean stratification) (33, 34). At open coastal stations in the United States, secular trends in tidal range are generally less than ±2% per century (26, 34), with the exception of the 2.2 to 4.4% per century increases noted in the Gulf of Maine (35). Within estuaries, however, much larger and spatially variable trends can occur due to engineered changes and reduction in inflow, morphodynamic changes, and other factors (36, 37). For example, secular changes in tidal amplitudes in New York Harbor varied from 0 to 10% since the mid-19th century (38–40), but tidal ranges have more than doubled in portions of the tidal Hudson River (38). In addition to secular trends, tides also exhibit pronounced interannual variations along the U.S. coast and elsewhere (35). All these observations lead to a basic question: Are trends in tidal properties affecting recent changes in NF, and how significant are these trends relative to the role of RMSL rise?
Therefore, our objective is to quantify how changes in tides have contributed to changes in the frequency and duration of NF events along the U.S. coastline. We exclude Alaska here because relative sea level is decreasing due to land uplift. Hawaii is excluded as an island station atypical of the rest of the United States. We analyze hourly records from 40 tide gauges that have record lengths >70 years. Modern-day minor flood thresholds defined by the National Weather Service (NWS) are used where available and inferred from the tidal characteristics elsewhere (see Materials and Methods) (2). We define two sets of tidal data for each location: one that accounts for the observed changes in tides (by conducting a year-by-year tidal analysis) termed “measured” and one that represents historical tidal conditions (tides derived from early parts of the tide gauge records) termed “synthetic.” Long-term trends due to RMSL rise are retained in both datasets. Where possible, we use extended tide gauge records based on recently digitized historic water-level information (41), which allows us to infer tidal conditions from the 19th or early 20th century (table S1). Tidal constituents are obtained using the MATLAB UTide package (42), and we perform a comprehensive sensitivity analysis to assure robustness of our results (see Materials and Methods). We then synthesize time series of water levels with historic tides by replacing the observed tides with unchanged historic tides. Last, we compare NF frequencies and durations derived with synthesized and observed time series using modern-day flood thresholds.
RESULTS
Secular changes in past NF frequencies due to tidal changes
Wilmington (NC) provides an extreme (but illustrative) example of a secular change in tides at an estuarine station; the tidal range has increased at a rate of 542 mm/century since 1935 (27, 43) due, in large part, to channel deepening (36). Both sea-level rise and tidal changes have altered water levels relative to a fixed datum [see also (34)]. Differences between annual mean high water from the measured and synthetic time series increased over time and reached 0.18 m at the end of the record in 2019 (Fig. 1). The trend in the mean higher high water (MHHW) datum is 1.99 ± 0.47 mm/year above the RMSL trend and is comparable in magnitude to the RMSL trend (2.47 ± 0.35 mm/year). Because of the amplified tides and associated increase in high water levels, Wilmington experienced an increase of NF events due to tidal changes in the second half of the 20th century (see Fig. 2 and first row of Fig. 3). Tidal changes since the 1908–1911 reference period led to additional 123 ± 2 NF days (first row of Fig. 3) in 2019 alone and an additional 1203 events (equivalent to 39% of all events) (Fig. 2) over the entire period since 1949 (when the first additional NF day occurred); those NF events would not have occurred if tidal conditions had remained stable. Along with the number of NF days, the duration of NF events (total hours above the flood threshold over the year) also changed markedly in recent decades due to tidal changes (first row of fig. S1).
Fig. 1. Tide changes at tide gauge Wilmington (NC) from 1908 to 2019.
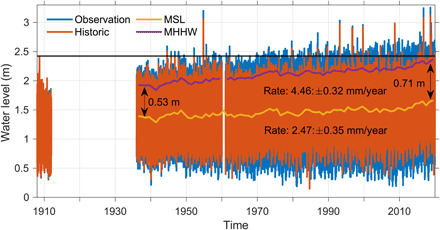
The black line represents the minor flood threshold (2.424 m above station datum). Yearly MHHW and RMSL are shown in purple and yellow, respectively. Observed hourly water levels are shown in blue, and the reconstruction that includes the historic tidal situation (i.e., removing observed tides and adding back historic stationary tides) is shown in orange.
Fig. 2. Effect of tidal changes on cumulative NF days at 40 tide gauge locations.
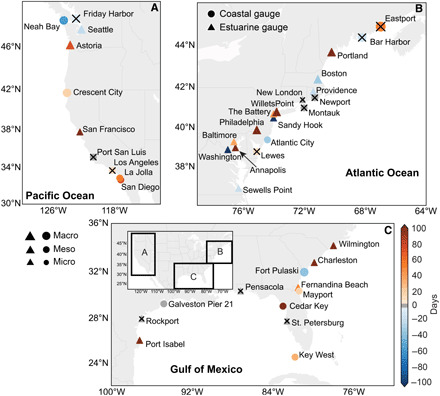
The total numbers of additional/reduced NF days (color bar) at each location over the time periods covered by the respective tide gauges are shown. Black crosses indicate that the one-sigma confidence levels around the changes in NF due to tidal changes include zero (data from these stations are still used in the aggregated results discussed below). Triangles represent estuary locations (here, typically 5 miles or more upstream of a river mouth), while circles represent coastal locations; marker sizes indicate tidal regimes (microtidal: tidal ranges smaller than 2 m; mesotidal: tidal range between 2 and 4 m; macrotidal: tidal range larger than 4 m).
Fig. 3. Changes in NF days per year from 1950 to 2019 due to evolving tides.
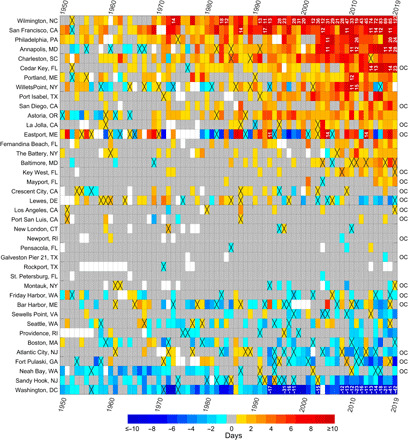
Positive changes are shown in red (i.e., tidal changes led to additional NF days), and negative changes are shown in blue (i.e., tidal changes prevented NF days). Locations are organized from top to bottom according to their total changes in NF days (positive to negative). White squares indicate insufficient data (i.e., either no data or less than 75% of hourly values) to implement tidal harmonic analysis; gray squares indicate that data are available but changes in NF days per year are zero; and squares with crosses denote that NF changes in these years were not significantly different from zero at the one-sigma confidence level (values are still used for the aggregation across locations shown in Fig. 4). We only show results from 1950 onward for better clarity, and because changes are very small before then; the color bar is cut off at ±10 for presentation purposes, but numbers in the boxes denote higher/smaller values. OC on the right indicates open-coast gauges; all others are classified here as estuarine gauges.
Secular changes in MHHW at Wilmington are among the largest in the United States (34). Other locations show smaller positive trends, insignificant changes, or even negative trends (fig. S2A). However, even smaller positive or negative changes in tidal amplitudes can alter the count of NF days. Approximately half the tide gauges analyzed here (18 in total) show positive trends in tidal amplitudes and hence an increase in NF days attributable to tidal changes, although the trends in tides themselves are not always statistically significant (Wilmington to Mayport; Fig. 2 and top part of Fig. 3). At most of these 18 locations, the number of additional NF days due to tidal changes increased over time, leading to an average of ~13 additional NF days per year (10th and 90th percentiles are 1 and 26, respectively) toward the end of the record in 2019. Approximately one-quarter of the considered tide gauges (11 in total) show negligible tidal changes, leading to no or insignificant changes in NF days (Crescent City to Montauk; middle part of Fig. 3). At the remaining locations (11 in total), tidal range decreased over time, leading to a reduced number of NF days (Friday Harbor to Washington, DC; bottom part of Fig. 3). At these locations, tidal changes have offset some of the negative impacts of sea-level rise that would have otherwise occurred in terms of NF. Washington, DC, experienced the strongest observed reduction of NF days, with an estimated 41 ± 7 reduction in NF days that did not occur in 2019 due to tidal range reduction (Fig. 3).
We also calculate the total numbers of positive and negative NF days due to tidal changes over time across all tide gauges (Fig. 4A). The total number of positive NF days starts rising in the 1950s at an exponential rate (with a doubling time of 11 years) until the end of the record. The ratio of the percentage of NF days that can be attributed to tidal changes fluctuates over time (gray background in Fig. 4A), ranging from 0 to 37% (18% on average). In 2019, an additional 236 ± 27 NF days occurred in the 18 gauges with positive tidal trends, accounting for 27% of the total number of NF days. The total number of negative NF days across tide gauges (i.e., NF days that have been avoided because of tidal changes) is much smaller but shows a sharp decrease after 2015 (Fig. 4A), reaching −66 days in 2019. This decrease reflects sea-level rise effects (combined with historic tide changes), rather than a sudden change in tidal constituents over the last 5 years. Overall, the impacts of tidal changes on NF events (both positive and negative) are much more pronounced at estuarine tide gauges (here, typically 5 miles or more from a river mouth; see Fig. 2) as compared to tide gauges at the open coast (Fig. 4B); changes in NF are also much stronger along the East Coast compared to the West Coast (Fig. 4C).
Fig. 4. Aggregated number of additional/reduced NF days per year across tide gauges.
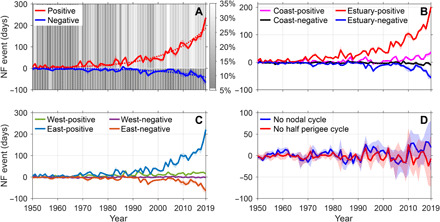
(A) Total positive (top 18 tide gauges in Fig. 2) and negative (bottom 11 tide gauge in Fig. 2) NF days due to tidal changes; gray shading represents the ratio between NF days attributable to changes in tides and total number of NF days in the respective years, and dashed lines are fitted exponential trends. (B) Total number of additional/reduced NF days per year separately for coastal and estuarine locations. (C) Total number of additional/reduced NF days per year separately for West and East Coast locations. (D) Number of total NF days across all tide gauges caused by nodal (18.6 years; blue) and half perigee (4.4 years; red) cycles. Shaded color bands represent one-sigma confidence levels.
The role of long-period tides in modulating NF frequency
In addition to secular changes in NF frequencies due to tidal changes, we also detect a ~4.5-year cycle in the time series of additional/reduced NF days (fig. S3), which is close to the half perigee cycle that modulates tides at a period of 4.4 years. The perigean (4.4 years) and nodal (18.6 years) modulations of tides affect high water levels (10). We quantify the impacts of these cycles on NF events by removing them from the tidal prediction and recalculating the number of NF days (assuming that these cycles would not exist); this is only done for the dataset with the observed tides, not the one with historic tides, as we assume that changes in the amplitudes of the 4.4- and 18.6-year cycles were negligible. The oscillations in NF days due to the low-frequency tidal modulations are evident, and their influence increases over time (Fig. 4D). The 4.4-year cycle adds up to 20 NF days across all locations (Fig. 4D) when it peaks under present-day sea level, whereas the 18.6-year cycle causes an additional 30 NF days during its peak compared to average conditions (Fig. 4D). Similarly, when both cycles are at their minimum, they reduce the incidence and duration of NF. The effects are largest along the northeast U.S. coast, where tidal ranges and amplitudes of the 18.6- and 4.4-year cycles are large. At coastal stations, the nodal and perigean cycles dominate the tidally induced variability in NF; by contrast, the effects of secular trends in tides outweigh the effects of the 4.4- and 18.6-year cycles at 21 and 19 of 22 estuary stations, respectively. This is not only because secular trends are larger in estuary stations but also because friction reduces the nodal cycle amplitude in estuaries (35).
Changes in NF durations due to tidal changes
In addition to changes in the frequency of NF, the cumulative duration of NF events is also an important indicator of impact, as longer flooding leads to more disruptions. Hence, we next determine the increased or decreased NF hours associated with tidal changes, using the methods outlined above for NF incidences. We find similar trends and temporal patterns for individual tide gauges (figs. S1 and S4). The magnitude of changes is larger, as individual NF events often add several NF hours. Aggregated across all 40 tide gauges, 351 additional NF hours occurred in 2019 (fig. S5A) due to tidal evolution. Again, the largest changes occur in estuaries, with 309 additional NF hours in 2019 at estuary locations and 43 hours at coastal locations (fig. S5B). Effects are also predominately along the East Coast (e.g., 331 additional NF hours in 2019 at East Coast locations versus 21 hours at West Coast locations; fig. S5C). The 4.4- and 18.6-year tidal cycles cause up to 49 and 39 additional NF hours per year, respectively, during their peak periods under present-day sea level (fig. S5D).
A time scale perspective on the effects of tidal changes on NF under sea-level rise
From a planning perspective, it is essential to know when critical thresholds of NF frequencies will likely be surpassed, therefore requiring adaptation or other measures to mitigate negative impacts. Here, we assess how much earlier (or later) critical thresholds of NF frequencies could be exceeded because of the effects of tidal changes, under intermediate-low, intermediate-high, and high sea-level rise scenarios (44). We use empirical exceedance curves of daily high waters for the 2001–2019 period, derived with historic and modern tides (Fig. 5A), and identify, for both distributions, the years when 100 NF events per year are expected to occur (see Materials and Methods). Under the intermediate-low sea-level rise scenario, the 100 events per year threshold is exceeded earlier (between 1 and 47 years) at 23 locations due to observed secular trends in tides (Fig. 5B). At 11 locations, the 100 events per year threshold is exceeded later (between 1 and 8 years); at six locations, the threshold is exceeded in the same year. If sea level rises more quickly, the time when 100 NF events per year occur depends less on the observed tidal evolution (Fig. 5, C and D). Effectively, the differences between the daily exceedance distributions derived with historic and modern tides become less relevant, because the larger sea-level rise rates mean that the distributions “pass through” critical NF thresholds much faster (i.e., are shifted faster to the right in Fig. 5A).
Fig. 5. A time scale perspective on the effects of tidal changes on the crossing of NF frequency thresholds.
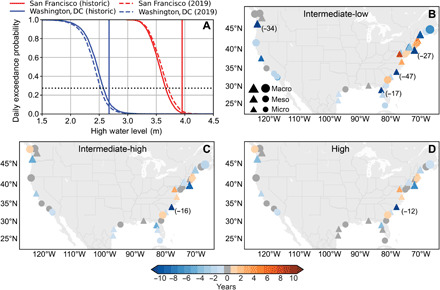
(A) Daily high water-level exceedance probability curves for San Francisco (red) and Washington, DC (blue) for the 2001–2019 period; distributions are derived from datasets that include historic tides (solid lines; tides derived from the first year of available data; see table S1) and modern tides (blue; tides derived from the year 2019); the dashed horizontal line represents the exceedance probability of 0.274, which is equivalent to ~100 NF days per year; vertical lines indicate the present-day minor flood thresholds. (B) Time difference between the years when the 100 NF events per year threshold is exceeded under the intermediate-low sea-level rise scenario based on distributions with historic and modern tides; blue color indicates that the threshold is exceeded earlier because of historic tide changes (due to tidal range amplification), red indicates that the threshold is exceeded later (due to tidal range reduction), and gray indicates that the threshold is exceeded in the same year with both distributions; triangles and circles indicate estuarine and open-coast gauges, respectively; the color bar is cut off at ±10 years for better clarity, but smaller/larger values are indicated in brackets in the figure panel (no values exceed +10 years); marker sizes indicate tidal regimes, as described in the caption for Fig. 2. (C) The same as (B) but for the intermediate-high sea-level rise scenario. (D) The same as (B) and (C) but for the high sea-level rise scenario.
Sensitivity analysis
A detailed sensitivity analysis was conducted with respect to the choices made in the design of the analysis. This included the threshold of required data availability in each year to perform the tidal analysis, the definition of the period from which the historic tidal situations are derived, the signal-to-noise ratio (SNR) considered in the tidal analysis, and the representation of the nodal cycle in the tidal prediction (see Materials and Methods for details on the design of the sensitivity analysis). The results highlight that the effects are small or negligible, indicating that our results and overall conclusions are robust (fig. S6).
DISCUSSION
Our results show that changes in tides play an important role in changing NF in the United States over and above the effects of long-term RMSL rise, particularly along the U.S. East Coast and in estuaries. The exponential increase (decrease) in the number of additional (reduced) NF events and durations is not a result of exponential changes in the tidal range but reflects the acceleration in RMSL rise and the corresponding reduction in the vertical gaps between MHHW and the flooding thresholds. Early in the records, the vertical gaps between the two were so large that no NF occurred, and any tidal evolution did not add or remove additional NF events. As sea level rises and more overall NF events occur, the effects of tidal changes are compounded by RMSL rise and become more important. We illustrate this by repeating our analysis assuming stable RMSL, representing recent conditions (fig. S7). There is still a trend (but less pronounced and not exponential) in the number of additional NF events; this reflects the actual effect of trends in tidal changes, decoupled from RMSL rise. The same mechanism causes an increase over time in the effects of the 4.4- and 18.6-year tidal cycles on adding/reducing NF events during their peak periods (Fig. 4D). RMSL continues to rise, and the rate is projected to accelerate throughout the century and beyond. Given this rise, the effects of both long-period tidal modulations and secular tidal changes will become less important (similar to what is shown in fig. S7) once RMSL levels exceed certain tipping points where NF becomes chronic (45).
Secular increases in tidal range, primarily in estuaries, are making NF occur earlier than sea-level rise alone, therefore decreasing the amount of time available to implement adaptation measures. Our analysis suggests that this acceleration in NF effects is determined by three variables: (i) the magnitude of tide changes at a given location; (ii) the shape of the high water distribution, reflecting the local tidal characteristics; and (iii) the local rate of RMSL rise.
The marked differences between changes found in estuarine versus coastal locations are largely driven by direct anthropogenic alterations of estuaries. Wilmington, for example, experienced the strongest effects from changes in tides on NF (both number of NF days and duration) among all tide gauges considered here. The tide gauge is located upstream in the Cape Fear River, 47 km from the mouth of the estuary. The tidal range has increased by approximately 0.38 m since 1936 (0.57 m since 1887), mainly due to extensive dredging, channel deepening, and associated reduction of hydraulic drag (36).
Similarly, large-scale dredging in the Delaware River leads to doubling of the depth (from 6.1 to 12.2 m) since the 1910s and a considerable increase in tidal range in Philadelphia (46). Tidal range (and NF) at the mouth of the Delaware (Lewes) decreased over time, which shows that tidal effects on NF are spatially variable within individual estuaries.
Dredging at the mouth of the Hudson River beginning in the late 19th century also increased the tidal range (38), resulting in a moderate increase in NF days (and duration) at The Battery in Manhattan. This increase occurs despite a background decrease in mid-Atlantic seaboard tidal constituents such as S2 (29), which results, for example, in a decrease in NF days in nearby Atlantic City and Sandy Hook (at the mouth of New York Harbor), where M2 has decreased since the 1880s (Fig. 3). The New York Harbor case also highlights the importance of the periods used to define historic tidal characteristics (see table S1), which can lead to different results at nearby stations when tidal changes are not linear over time, but take place more rapidly in certain periods (as can occur when changes are caused by anthropogenic interventions) or even change in the opposite direction in different periods. Complex geometry also plays a role—at Willets Point (also in the New York region), an amplification in semidiurnal tides of ~3% per century is likely caused by sea-level rise–induced changes to resonance (34, 47).
The tide gauge at San Francisco shows the second largest changes in NF days caused by changing tides (Fig. 3). Tidal changes are likely influenced by the morphological evolution of the ebb-tidal delta, including the dredging of a 55-ft (16.7 m) channel (48).
These results suggest that altered NF probabilities are most likely observable in regions where the bathymetry is strongly influenced by anthropogenic activity such as dredging or land reclamation. Despite a roughly 50/50 split between estuarine and coastal tide gauges considered here, estuarine locations account for 83% of the changes in NF days due to tidal changes (when both positive and negative changes are combined). Furthermore, tidal trends are usually larger further from the coast (Fig. 2), where dredging has a stronger effect on topography and resonance/reflection effects may be more pronounced (34). Far upstream, the effect of dredging on reducing the river slope may dominate over increases to tides; for example, although tidal range in Albany (NY) (~250 km from the coast) has roughly doubled over the past century, flooding frequency has actually decreased (38). Qualitatively similar results are found in the Columbia River (37). For this reason, our study specifically excludes stations within the tidal river domain [as defined by (49)]. Our approach focuses only on the effect of tidal change on NF frequency, and any river discharge effects are effectively included in the nontidal (sea level–induced) increase in NF. Nonetheless, the compound effects of altered river hydraulics, tidal changes, and sea-level rise on NF should also be considered in future research. For example, secular changes to the seasonality of river flow influenced the seasonal variation of water levels and tides in the Columbia River Estuary, with a much smaller annual effect (50). Changes to sediment supply caused by river regulation are a further compounding effect on bathymetric change, in both estuaries and the coast (51, 52). However, quantifying the role of river flow in modulating tides, water levels, bathymetry, and NF trends for both coastal and inland gauges on a continental scale is beyond the scope of our analysis.
Data constraints (i.e., short modern records and/or no historic data) prevent the analysis of many locations and types of secular change in NF. A notable example is Jacksonville, FL, which is an important population and economic center situated on the St. Johns River Estuary. This highly frictional estuary has experienced a spatially variable, 0- to ~0.4-m increase in tidal range (between the river mouth and 50 km upstream) since the late 19th century (34). While insufficient historic and modern tide gauge data are available to assess trends in NF, the results presented for Wilmington and other estuaries suggest that the duration and frequency of NF have also likely increased here. Similarly, lagoonal or “back-bay” estuaries are not represented in the long NOAA (National Oceanic and Atmospheric Administration) tide gauge datasets, but large changes to tides have been shown to occur where inlets have been opened or closed (53) or have been deepened and widened (54, 55). Long-term increases in tides have been observed for Jamaica Bay, New York City, for example, with a tide range in 1899 of 1.16 m increasing to 1.64 m in 2007 (55). These sites typically only have a few decades or less of recent data collected by the U.S. Geological Survey, as well as historical data collected for short periods associated with bathymetric surveys. NF occurring along the open coast due to changed beach and subtidal bathymetry, and hence altered wave setup and run-up, can also not be studied using our approach. These considerations motivate future research to further quantify the effects of anthropogenic and geomorphic change on NF, possibly using models alongside these limited tide gauge datasets.
To conclude, the frequency of NF events has increased and the rate of occurrences has accelerated over the last few decades along the U.S. coasts, leading to changes in NF ranging from 300 to 900% (15). While long-term RMSL rise is the main driver for this increase in NF, we show here that secular changes in tides account for almost one-quarter of the NF events observed in 2019 (27%), and the impact of these tidal changes becomes more important as RMSL rises, further closing the gap between high tide levels and NF thresholds. Changes are more pronounced along the U.S. East Coast, where RMSL rose faster over the last few decades compared to the West Coast, and also in many of the major estuaries, which have undergone significant changes in the tidal characteristics due to anthropogenic alterations of system geometry and river inflow. Here, we include only locations where long hourly sea-level observations are available, but similar changes are known to have occurred in many other places (Jacksonville, FL and Jamaica Bay, NY are discussed above as representative examples). We note that our analysis uses fixed flooding thresholds, which are not always tied to actual impacts; i.e., in some places, the NF events we identify may actually cause significant disruptions but may not do so in other places. Nevertheless, it is important that coastal planning efforts, especially in concert with the expected RMSL rise and required adaptation, acknowledge and are cognizant of the important role that tidal changes can play in further aggravating the growing impacts of NF.
MATERIALS AND METHODS
Tide gauge data and NF thresholds
We use hourly water-level records from 40 tide gauges derived from NOAA’s Tides and Currents website (https://tidesandcurrents.noaa.gov/map/index.shtml). For several locations (see table S1), we extended the records available in the NOAA database with recently digitized historic data (41), going back to the early 20th and, in several cases, mid-19th century. Official NF thresholds defined by the National Weather Service were derived from (2) where available (29 of the 40 locations considered here). For locations without official NF thresholds, they were directly inferred from the hourly data using the following regression function (2) (see table S1 for the NF thresholds that were used): y = 0.04x + 0.5, where x is the great diurnal range (i.e., the difference between MHHW and mean lower low water) and y is the NF threshold above MHHW (in meters).
Official and inferred NF thresholds can differ by more than 0.1 m, which could increase or decrease the number of additional NF days identified here, and hence is a source of uncertainty. Alternative ways to define NF thresholds include using the concept of remarkability of flood events, which is tied to social media posts (9), or fixed values above MHHW [e.g., 0.3 m in (11)].
Tidal analysis
For the tidal analysis, we use MATLAB’s UTide package (42) and apply it on a year-by-year basis. We exclude the annual and semiannual cycles (i.e., SA and SSA constituents) in the tidal analysis, as those are mainly driven by climatic factors, with negligible astronomic components (56). We also exclude the weekly tides Mm and Mf due to their large SEs in tidal harmonic analysis (10). To weaken the influence of extreme water levels on the results of the harmonic analysis, we choose the “HUBER” robust function
where r is a weight factor. Usually, extreme values are associated with large values of “r” during the adjustment process. For those values, smaller weights are assigned to weaken their influence on the estimated amplitudes and phases of the tidal constituents. Tides are only derived for years where at least 75% of the hourly data are available (see also the “Sensitivity analysis” section below).
By conducting the year-by-year analysis, we derive a dataset of observed tides, which are allowed to change through time. The changing tides are subtracted from the observed water-level time series and replaced by a tidal prediction that reflects the historic tidal conditions (assuming tides remained constant through time). Whenever possible, we derive the historic tidal conditions from the first 18 years of water-level records. However, in some instances, we were able to add additional historic water-level data to the records, and those do not always directly extend to the existing records (leading to gaps in the datasets) and also do not always cover a full 18-year period. In those instances, we used the longest possible period to define the historic tidal characteristics (see table S1 and the “Sensitivity analysis” section below). Because the UTide package estimates the SE of each tidal constituent, we estimate the error bars of the predicted historic tides based on the error propagation law (57)
Applying the error propagation law to the predicted tides , we obtain
where is the standard error of predicted tides and k represents the tidal constituents used in the prediction (i.e., those with SNR > 2); σAand σφ represent the SEs of amplitude and phase, respectively; θk = ωkt + uk + vk, where ωk is the angular speed of tidal constituents, t is the time, and uk and vk are the astronomical arguments. The units of σφ are expressed in radians. We then add the positive and negative SEs to the predicted tides and calculate the associated uncertainties surrounding our estimates of changes in NF days (and durations) due to tidal changes.
In addition to quantifying the effects of secular changes in high-frequency (i.e., subseasonal) tidal constituents, we also assess how low-frequency (i.e., multiyear) tidal cycles modulate NF events, but, in this case, assuming that the amplitudes are stationary over time; hence, the analysis is only carried out on the basis of the dataset that includes the observed tides. The nodal and half perigee cycles in tidal constituents were removed according to their Doodson numbers (58), and the changes in NF days and hours were quantified.
Time scale analysis
For the time scale analysis, we first select the observed hourly sea levels for the period 2001–2019 at each location. We then perform a year-by-year tidal analysis (as outlined above) to remove the tidal influence. Next, we perform a tidal analysis for the first year of data that we have available at each site (see table S1), predict 19 years of (stationary) hourly tides using the derived constituents, combine the predicted tides with the residuals for the 2001–2019 period, and derive the empirical cumulative distribution function from the daily high water levels representing the historic tide situation. The same procedure is repeated but using the year 2019 for the tidal analysis, deriving a second distribution representing the modern tide situation. Annual values of sea-level rise from 2019 to 2100 are derived by interpolating (with a quadratic fit) three different NOAA sea-level rise scenarios (which are provided at a decadal resolution). The U.S. Army Corps of Engineer’s Sea Level Calculator (http://corpsmapu.usace.army.mil/rccinfo/slc/slcc_calc.html) was used to derive local RMSL rise projections for each tide gauge location. Last, the 2001–2019 daily high water-level distributions with historic and present-day tide characteristics are shifted, and the years are recorded when the minor flood threshold intersects with a probability of 0.274, equivalent to ~100 NF events per year; other thresholds could be selected if more relevant locally. The years when the threshold is exceeded under the assumption of the two distributions are compared to quantify how much earlier or later it happens due to tidal evolution.
Sensitivity analysis
In our analysis, we made a number of choices. The effects of these choices were investigated using a comprehensive sensitivity analysis. First, we assessed the effect of data completeness on harmonic analysis results. References (27), (29), and (32) suggested thresholds of 75%, 7000 hours (~80%), and 85% completeness, respectively. We repeat our analysis using the 80 and 85% thresholds and compare the numbers of additional NF days due to tidal changes against those derived with the 75% threshold (fig. S6A). Using different thresholds leads to mostly small differences in the year-to-year variability of additional NF days but does not affect the overall conclusions of our analysis.
Second, we investigated the influence of the reference historical period on results, because data availability precluded the use of a full 18.6-year nodal cycle at some locations. Overall changes are found to differ negligibly when variable reference periods of 1 to 18 years are used (fig. S6B). As results are likely to be more robust when using longer periods to define the historic tides, we chose the 18-year window wherever possible. For locations where we add additional historic records shorter than 18 years (often leading to gaps between the extended data and the beginning of the NOAA records), we use the longest possible time span.
Third, we assessed the effect of using different SNR, which controls the number of constituents used in the tidal prediction. The default SNR in the UTide package is 2. We compare results for SNR = 1.5, 2, and 3. The number of additional NF days is relatively stable (the largest difference is 4 days per year) among the different SNR thresholds (fig. S6C). Thus, we used the default value of SNR = 2 for our analysis.
Last, it is known that estimated nodal amplitude corrections for tides are different from the theoretical ones (10, 35), especially in M2 and N2 constituents. Thus, we calculated nodal amplitude corrections through regression models at two locations (table S2). The nodal amplitude corrections are similar to those reported in (35). Comparing the number of additional NF events from using nodal corrections directly inferred from the data and theoretical nodal corrections reveals small differences in most years, but occasionally as large as 15 days (fig. S6D). To facilitate easy transferability of our experiment design to other regions/locations, we use the theoretical nodal corrections for the analysis.
Acknowledgments
We thank R. Pawlowicz and D. Codiga for participating in technical discussions on aspects of the tidal analysis implemented in our study. We thank editors and two anonymous reviewers for their comments on improving this manuscript. Funding: This material is based on work supported by the National Science Foundation under grant numbers 1854896 (T.W.), 1855037 (P.M.O.), 2013280, and 1455350 (S.A.T.). S.L. acknowledges support by the China Scholarship Council (no. 201904910413), the Ministry of Science and Technology of the People’s Republic of China (grant no. 2011YQ120045), the Natural Science Foundation of Hubei Province (grant no. 2019CFB795), and the National Natural Science Foundation of China (grant nos. 42074011, 41904010, and 41704084). Author contributions: T.W. and S.L. conceived the study. S.L. carried out the analysis and wrote the first draft of the paper. T.W., S.A.T., and D.A.J. guided the research. P.M.O., X.L., G.W., and L.L. participated in technical discussions. All authors cowrote the paper. Competing interests: The authors declare that they have no competing interests. Data and materials availability: All data needed to evaluate the conclusions in the paper are present in the paper and/or the Supplementary Materials. NOAA sea-level data used for the analysis are available from their Tides and Currents website: https://tidesandcurrents.noaa.gov/map/index.shtml. Tide gauge–specific RMSL rise scenarios were derived with the U.S. Army Corps of Engineer’s Sea Level Calculator (https://cwbi-app.sec.usace.army.mil/rccslc/slcc_calc.html). The historic sea-level data listed in table S1 are available from S.A.T. upon reasonable request. MATLAB code used for the analysis can be requested from S.L.
SUPPLEMENTARY MATERIALS
Supplementary material for this article is available at http://advances.sciencemag.org/cgi/content/full/7/10/eabe2412/DC1
REFERENCES AND NOTES
- 1.Moftakhari H. R., AghaKouchak A., Sanders B. F., Allaire M., Matthew R. A., What is nuisance flooding? Defining and monitoring an emerging challenge. Water Resour. Res. 54, 4218–4227 (2018). [Google Scholar]
- 2.W. V. Sweet, G. Dusek, J. Obeysekera, J. J. Marra, “Patterns and projections of high tide flooding along the U.S. coastline using a common impact threshold” (Technical Report, NOAA NOS CO-OPS 086, 2018).
- 3.Vitousek S., Barnard P. L., Fletcher C. H., Frazer N., Erikson L., Storlazzi C. D., Doubling of coastal flooding frequency within decades due to sea-level rise. Sci. Rep. 7, 1399 (2017). [DOI] [PMC free article] [PubMed] [Google Scholar]
- 4.Wahl T., Haigh I. D., Nicholls R. J., Arns A., Dangendorf S., Hinkel J., Slangen A. B. A., Understanding extreme sea levels for broad-scale coastal impact and adaptation analysis. Nat. Commun. 8, 16075 (2017). [DOI] [PMC free article] [PubMed] [Google Scholar]
- 5.Aerts J. C. J. H., Botzen W. J. W., Emanuel K., Lin N., de Moel H., Michel-Kerjan E. O., Evaluating flood resilience strategies for coastal megacities. Science 344, 473–475 (2014). [DOI] [PubMed] [Google Scholar]
- 6.Woodruff J. D., Irish J. L., Camargo S. J., Coastal flooding by tropical cyclones and sea-level rise. Nature 504, 44–52 (2013). [DOI] [PubMed] [Google Scholar]
- 7.Jongman B., Ward P. J., Aerts J. C. J. H., Global exposure to river and coastal flooding: Long term trends and changes. Glob. Environ. Change 22, 823–835 (2012). [Google Scholar]
- 8.Neumann B., Vafeidis A. T., Zimmermann J., Nicholls R. J., Future coastal population growth and exposure to sea-level rise and coastal flooding—A global assessment. PLOS ONE 10, e0118571 (2015). [DOI] [PMC free article] [PubMed] [Google Scholar]
- 9.Moore F. C., Obradovich N., Using remarkability to define coastal flooding thresholds. Nat. Commun. 11, 530 (2020). [DOI] [PMC free article] [PubMed] [Google Scholar]
- 10.Ray R. D., Foster G., Future nuisance flooding at Boston caused by astronomical tides alone. Earth Future 4, 578–587 (2016). [Google Scholar]
- 11.Ezer T., Atkinson L. P., Accelerated flooding along the U.S. East Coast: On the impact of sea-level rise, tides, storms, the Gulf Stream, and the North Atlantic Oscillations. Earth Future 2, 362–382 (2014). [Google Scholar]
- 12.Sweet W. V., Park J., From the extreme to the mean: Acceleration and tipping points of coastal inundation from sea level rise. Earth Future 2, 579–600 (2014). [Google Scholar]
- 13.Wahl T., Plant N. G., Changes in erosion and flooding risk due to long-term and cyclic oceanographic trends. Geophys. Res. Lett. 42, 2943–2950 (2015). [Google Scholar]
- 14.Ruggiero P., Is the intensifying wave climate of the U.S. Pacific Northwest increasing flooding and erosion risk faster than sea-level rise? J. Waterw. Port Coast. Ocean Eng. 139, 88–97 (2013). [Google Scholar]
- 15.Moftakhari H. R., AghaKouchak A., Sanders B. F., Feldman D. L., Sweet W., Matthew R. A., Luke A., Increased nuisance flooding along the coasts of the United States due to sea level rise: Past and future. Geophys. Res. Lett. 42, 9846–9852 (2015). [Google Scholar]
- 16.Moftakhari H. R., AghaKouchak A., Sanders B. F., Matthew R. A., Cumulative hazard: The case of nuisance flooding. Earth Future 5, 214–223 (2017). [Google Scholar]
- 17.Taherkhani M., Vitousek S., Barnard P. L., Frazer N., Anderson T. R., Fletcher C. H., Sea-level rise exponentially increases coastal flood frequency. Sci. Rep. 10, 6466 (2020). [DOI] [PMC free article] [PubMed] [Google Scholar]
- 18.W. Sweet, G. Dusek, G. Carbin, J. Marra, D. Marcy, S. Simon, “2019 state of U.S. high tide flooding with a 2020 outlook” (Technical Report, NOAA NOS CO-OPS 092, 2020).
- 19.Chen X., Zhang X., Church J. A., Watson C. S., King M. A., Monselesan D., Legresy B., Harig C., The increasing rate of global mean sea-level rise during 1993–2014. Nat. Clim. Chang. 7, 492–495 (2017). [Google Scholar]
- 20.Nerem R. S., Beckley B. D., Fasullo J. T., Hamlington B. D., Masters D., Mitchum G. T., Climate-change–driven accelerated sea-level rise detected in the altimeter era. Proc. Natl. Acad. Sci. U.S.A. 115, 2022–2025 (2018). [DOI] [PMC free article] [PubMed] [Google Scholar]
- 21.Hino M., Belanger S. T., Field C. B., Davies A. R., Mach K. J., High-tide flooding disrupts local economic activity. Sci. Adv. 5, eaau2736 (2019). [DOI] [PMC free article] [PubMed] [Google Scholar]
- 22.Hamlington B. D., Gardner A. S., Ivins E., Lenaerts J. T. M., Reager J. T., Trossman D. S., Zaron E. D., Adhikari S., Arendt A., Aschwanden A., Beckley B. D., Bekaert D. P. S., Blewitt G., Caron L., Chambers D. P., Chandanpurkar H. A., Christianson K., Csatho B., Cullather R. I., DeConto R. M., Fasullo J. T., Frederikse T., Freymueller J. T., Gilford D. M., Girotto M., Hammond W. C., Hock R., Holschuh N., Kopp R. E., Landerer F., Larour E., Menemenlis D., Merrifield M., Mitrovica J. X., Nerem R. S., Nias I. J., Nieves V., Nowicki S., Pangaluru K., Piecuch C. G., Ray R. D., Rounce D. R., Schlegel N. J., Seroussi H., Shirzaei M., Sweet W. V., Velicogna I., Vinogradova N., Wahl T., Wiese D. N., Willis M. J., Understanding of contemporary regional sea-level change and the implications for the future. Rev. Geophys. 58, e2019RG000672 (2020). [DOI] [PMC free article] [PubMed] [Google Scholar]
- 23.Shirzaei M., Bürgmann R., Global climate change and local land subsidence exacerbate inundation risk to the San Francisco Bay Area. Sci. Adv. 4, eaap9234 (2018). [DOI] [PMC free article] [PubMed] [Google Scholar]
- 24.Bekaert D. P. S., Hamlington B. D., Buzzanga B., Jones C. E., Spaceborne synthetic aperture radar survey of subsidence in Hampton Roads, Virginia (USA). Sci. Rep. 7, 14752 (2017). [DOI] [PMC free article] [PubMed] [Google Scholar]
- 25.Dahl K. A., Fitzpatrick M. F., Spanger-Siegfried E., Sea level rise drives increased tidal flooding frequency at tide gauges along the U.S. East and Gulf Coasts: Projections for 2030 and 2045. PLOS ONE 12, e0170949 (2017). [DOI] [PMC free article] [PubMed] [Google Scholar]
- 26.Jay D. A., Evolution of tidal amplitudes in the eastern Pacific Ocean. Geophys. Res. Lett. 36, L04603 (2009). [Google Scholar]
- 27.Woodworth P. L., A survey of recent changes in the main components of the ocean tide. Cont. Shelf Res. 30, 1680–1691 (2010). [Google Scholar]
- 28.Mawdsley R. J., Haigh I. D., Wells N. C., Global secular changes in different tidal high water, low water and range levels. Earth Future 3, 66–81 (2015). [Google Scholar]
- 29.Ray R. D., Secular changes in the solar semidiurnal tide of the western North Atlantic Ocean. Geophys. Res. Lett. 36, L19601 (2009). [Google Scholar]
- 30.Rasheed A. S., Chua V. P., Secular trends in tidal parameters along the coast of Japan. Atmos. Ocean 52, 155–168 (2014). [Google Scholar]
- 31.Devlin A. T., Jay D. A., Talke S. A., Zaron E. D., Pan J., Lin H., Coupling of sea level and tidal range changes, with implications for future water levels. Sci. Rep. 7, 17021 (2017). [DOI] [PMC free article] [PubMed] [Google Scholar]
- 32.Zaron E. D., Jay D. A., An analysis of secular change in tides at open-ocean sites in the Pacific. J. Phys. Oceanogr. 44, 1704–1726 (2014). [Google Scholar]
- 33.Haigh I. D., Pickering M. D., Green J. A. M., Arbic B. K., Arns A., Dangendorf S., Hill D. F., Horsburgh K., Howard T., Idier D., Jay D. A., Jänicke L., Lee S. B., Müller M., Schindelegger M., Talke S. A., Wilmes S.-B., Woodworth P. L., The tides they are a-changin’: A comprehensive review of past and future nonastronomical changes in tides, their driving mechanisms, and future implications. Rev. Geophys. 58, e2018RG000636 (2020). [Google Scholar]
- 34.Talke S. A., Jay D. A., Changing tides: The role of natural and anthropogenic factors. Annu. Rev. Mar. Sci. 12, 121–151 (2020). [DOI] [PubMed] [Google Scholar]
- 35.Ray R. D., Talke S. A., Nineteenth-century tides in the gulf of maine and implications for secular trends. J. Geophys. Res. Oceans 124, 7046–7067 (2019). [Google Scholar]
- 36.Familkhalili R., Talke S. A., The effect of channel deepening on tides and storm surge: A case study of Wilmington, NC. Geophys. Res. Lett. 43, 9138–9147 (2016). [Google Scholar]
- 37.Helaire L. T., Talke S. A., Jay D. A., Mahedy D., Historical changes in lower Columbia River and Estuary floods: A numerical study. J. Geophys. Res. Oceans 124, 7926–7946 (2019). [Google Scholar]
- 38.Ralston D. K., Talke S., Geyer W. R., Al-Zubaidi H. A. M., Sommerfield C. K., Bigger tides, less flooding: Effects of dredging on barotropic dynamics in a highly modified estuary. J. Geophys. Res. Oceans 124, 196–211 (2019). [Google Scholar]
- 39.Talke S. A., Orton P., Jay D. A., Increasing storm tides in New York Harbor, 1844–2013. Geophys. Res. Lett. 41, 3149–3155 (2014). [Google Scholar]
- 40.Chant R. J., Sommerfield C. K., Talke S. A., Impact of channel deepening on tidal and gravitational circulation in a highly engineered estuarine basin. Estuaries Coasts 41, 1587–1600 (2018). [Google Scholar]
- 41.S. A. Talke, D. A. Jay, “Archival water-level measurements: Recovering historical data to help design for the future” (Technical Report, U.S. Army Corps of Engineers: Civil Works Technical Series, Report CWTS-02, 2017).
- 42.D. L. Codiga, “Unified tidal analysis and prediction using the UTide Matlab functions” (Technical Report, URI/GSO 2011-2001, 2011).
- 43.Flick R. E., Murray J. F., Ewing L. C., Trends in United States tidal datum statistics and tide range. J. Waterw. Port Coast. Ocean Eng. 129, 155–164 (2003). [Google Scholar]
- 44.W. Sweet, R. Kopp, C. Weaver, J. Obeysekera, R. Horton, E. Thieler, C. Zervas, “Global and regional sea level rise scenarios for the United States” (Technical Report, NOAA NOS CO-OPS 083, 2017).
- 45.Thompson P. R., Widlansky M. J., Merrifield M. A., Becker J. M., Marra J. J., A statistical model for frequency of coastal flooding in Honolulu, Hawaii, during the 21st century. J. Geophys. Res. Oceans 124, 2787–2802 (2019). [Google Scholar]
- 46.Pareja-Roman L. F., Chant R. J., Sommerfield C. K., Impact of historical channel deepening on tidal hydraulics in the Delaware Estuary. J. Geophys. Res. Oceans 125, e2020JC016256 (2021). [Google Scholar]
- 47.Kemp A. C., Hill T. D., Vane C. H., Cahill N., Orton P. M., Talke S. A., Parnell A. C., Sanborn K., Hartig E. K., Relative sea-level trends in New York City during the past 1500 years. Holocene 27, 1169–1186 (2017). [Google Scholar]
- 48.Rodríguez-Padilla I., Ortiz M., On the secular changes in the tidal constituents in San Francisco Bay. J. Geophys. Res. Oceans 122, 7395–7406 (2017). [Google Scholar]
- 49.Hoitink A. J. F., Jay D. A., Tidal river dynamics: Implications for deltas. Rev. Geophys. 54, 240–272 (2016). [Google Scholar]
- 50.Talke S. A., Mahedy A., Jay D. A., Lau P., Hilley C., Hudson A., Sea level, tidal, and river flow trends in the lower Columbia River Estuary, 1853–present. J. Geophys. Res. Oceans 125, e2019JC015656 (2020). [Google Scholar]
- 51.Syvitski J. P. M., Vörösmarty C. J., Kettner A. J., Green P., Impact of humans on the flux of terrestrial sediment to the global coastal ocean. Science 308, 376–380 (2005). [DOI] [PubMed] [Google Scholar]
- 52.Templeton W. J., Jay D. A., Lower Columbia River sand supply and removal: Estimates of two sand budget components. J. Waterw. Port Coast. Ocean Eng. 139, 383–392 (2013). [Google Scholar]
- 53.Aretxabaleta A. L., Ganju N. K., Butman B., Signell R. P., Observations and a linear model of water level in an interconnected inlet-bay system. J. Geophys. Res. Oceans 122, 2760–2780 (2017). [Google Scholar]
- 54.Orton P. M., Sanderson E. W., Talke S. A., Giampieri M., MacManus K., Storm tide amplification and habitat changes due to urbanization of a lagoonal estuary. Nat. Hazards Earth Syst. Sci. 20, 2415–2432 (2020). [Google Scholar]
- 55.Swanson R. L., Wilson R. E., Increased tidal ranges coinciding with Jamaica Bay development contribute to marsh flooding. J. Coast. Res. 24, 1565–1569 (2008). [Google Scholar]
- 56.Wahl T., Calafat F. M., Luther M. E., Rapid changes in the seasonal sea level cycle along the U.S. Gulf coast from the late 20th century. Geophys. Res. Lett. 41, 491–498 (2014). [Google Scholar]
- 57.Ku H. H., Notes on the use of propagation of error formulas. J. Res. Natl. Bur. Stand. 70, 263–273 (1966). [Google Scholar]
- 58.Cartwright D. E., Tayler R. J., New computations of the tide-generating potential. Geophys. J. Int. 23, 45–73 (1971). [Google Scholar]
Associated Data
This section collects any data citations, data availability statements, or supplementary materials included in this article.
Supplementary Materials
Supplementary material for this article is available at http://advances.sciencemag.org/cgi/content/full/7/10/eabe2412/DC1