Abstract
Decreased mobility of the human eardrum, the tympanic membrane (TM), is an essential indicator of a prevalent middle ear infection. The current diagnostic method to assess TM mobility is via pneumatic otoscopy, which provides subjective and qualitative information of subtle motion. In this study, a handheld spectral-domain pneumatic optical coherence tomography system was developed to simultaneously measure the displacement of the TM, air pressure inputs applied to a sealed ear canal, and to perform digital pneumatic otoscopy. A novel approach based on quantitative parameters is presented to characterize spatial and temporal variations of the dynamic TM motion. Furthermore, the TM motions of normal middle ears are compared with those of ears with middle ear infections. The capability of non-invasively measuring the rapid motion of the TM is beneficial to understand the complex dynamics of the human TM, and can ultimately lead to improved diagnosis and management of middle ear infections.
Keywords: biomechanics, optical coherence tomography, otitis media, tympanic membrane, viscoelasticity
Graphical Abstract
1 ∣. INTRODUCTION
The tympanic membrane (TM), also known as the eardrum, is a 30 to 120 μm thin membrane responsible for converting acoustic energy into mechanical energy [1]. Assessing its biomechanical properties is important to understand the fundamental mechanisms of the middle ear system. From a medical perspective, changes in TM mobility can be early signs of middle ear diseases. For example, decreased TM mobility may indicate the presence of a middle ear effusion (MEE), fluid that has accumulated in a normally air-filled middle ear cavity during otitis media (OM) [2]. OM, commonly known as a middle ear infection, is associated with bacterial and/or viral inflammation in the middle ear. Despite its high prevalence, the accurate diagnosis of OM is challenging due to the limited diagnostic capability to objectively assess the middle ear, located behind the TM.
The examination of TM mobility via pneumatic otoscopy is recommended by physician guidelines to establish a diagnosis of OM [2, 3]. When done correctly, an otoscope generates a magnified surficial view of the TM, while a gently squeezed insufflation bulb attached to the otoscope modulates air pressure delivered to a sealed ear canal. Decreased movement of the TM is observed when a MEE is present due to the added fluid and mass to the middle ear system and/or the changes in the middle ear pressure. Although pneumatic otoscopy may provide improved diagnostic accuracy over standard otoscopy, it is highly subjective and difficult to perform, particularly on irritable pediatric patients, limiting its widespread practical use [4-6]. In addition, since the TM motion consists of both in- and out-of-plane (axial) movement, an otoscope-based method is not sufficient to provide in-depth visualization, quantification and assessment of the rapid dynamics of the TM.
There are several imaging techniques that can precisely measure the axial motion of the TM in research settings. In general, TM mobility has been measured using acoustic waves, pressure modulations, or mechanical forces. In these scenarios, holography- or interferometry-based microscopy, or vibrometry techniques, are employed to evaluate the axial displacement of the TM [7, 8]. However, a direct measurement of the human TM displacement often requires measurements ex vivo. Nonetheless, like other biological tissues, the TM is viscoelastic and exhibits temporally- and spatially-dependent mechanical behaviors [9, 10]. In the case of ex vivo tissues, the time after death and storage conditions can also affect the mechanical behaviors. Furthermore, the thin TM can easily become desiccated and/or torn apart during ex vivo measurement. Thus, characterizing TM dynamics in vivo is necessary not only to enhance the diagnostic capabilities for OM, but also to more accurately understand TM biomechanics.
Optical coherence tomography (OCT) is a non-invasive, depth-resolved imaging technique based on low-coherence interferometry (LCI) of the backscattered light [11]. OCT provides an imaging depth of a few millimeters with an axial resolution of 2 to 10 μm. The development of portable, handheld probe-based OCT systems has enabled middle ear imaging in vivo [12, 13]. Recent studies and review papers have discussed the great potential of OCT in otology [14-16], such as for identifying bacterial biofilms in the middle ear [17, 18], characterizing different middle ear conditions [19, 20], mapping the entire TM thickness [21-23], and measuring TM displacement in hearing [24-26].
Recently, pneumatic-induced motion of the human TM has been investigated in vivo using LCI and a custom-developed pressure generator [27, 28]. Studies have shown that the presence of a MEE significantly decreases the pneumatically driven TM displacement. However, the LCI measurements from the previous studies contained limited spatial information on the TM, along with potential motion artifacts due to the relatively low acquisition rate (1 kHz A-scan rate) [27, 28]. More importantly, as the mechanical response of the TM is spatially dependent on its varying thickness, conical shape and attachment to the ossicle [10], understanding the overall TM dynamics was limited.
In this article, we report the development and demonstration of a high-speed, handheld and portable spectral-domain OCT system to assess TM dynamics in response to quasi-static pressure modulations at 2 Hz. The system acquires multidimensional datasets, including OCT B-scans at 169 Hz, measurements of air pressure variations in a sealed ear canal, and digital pneumatic otoscopy images. The orthogonal displacement of the TM was calculated, and custom-developed biomechanical metrics, such as the pneumatic stiffness and the phase lag, were developed. Furthermore, the spatial and temporal distributions, as well as a hysteresis (loading-unloading) loop of the TM movements, were quantified. Finally, the responses of different pathological conditions exhibited during OM were compared with those of healthy middle ear conditions. This study provides a novel comprehensive method to examine TM mobility in vivo, which could facilitate our improved understanding of TM dynamics during OM.
2 ∣. METHODS AND MATERIALS
2.1 ∣. Pneumatic OCT system
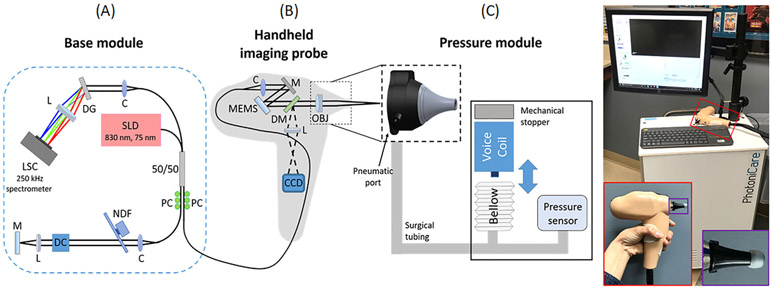
The custom-built pneumatic OCT system consisted of three modules: base module, handheld probe, and pressure module. A schematic diagram of the pneumatic OCT system is included in Figure 1. The base module contained a superluminescent diode (SLD) centered at 830 nm with a bandwidth of 75 nm (SLD-37-HP3; Superlum, Carrigtwohill, Ireland), a 250 kHz A-scan rate spectrometer (Cobra-S 800; Wasatch Photonics, Morrisville, North Carolina), a 50:50 fiber coupler, and a reference arm. MEMS-based (MTI-MZ; Mirrorcle Technologies, Richmond, California) scanning was utilized to generate B-scans (1024 A-scans per B-scan) at 169 Hz. An axial resolution of 15 μm in air and a transverse resolution of 30 μm were experimentally determined. A scanning range of 7 mm with an imaging depth of around 4 mm was obtained. The output power on the sample was approximately 7 mW.
FIGURE 1.
Schematic diagram and photo of the pneumatic OCT system. The system consisted of three parts: A, base module; B, handheld imaging probe; and C, pressure module. Photo on right shows the system with an enlarged view of the handheld probe (see red box). An ear speculum (black) with a standard earbud is visualized in the purple box. C, collimator; CCD, charge-coupled device camera; DC, dispersion compensator; DG, diffraction grating; DM, dichroic mirror; L, lens; LSC, line scanning camera; M, mirror; MEMS, microelectromechanical scanner; NDF, neutral density filter; OBJ, objective; OCT, optical coherence tomography; PC, polarization controller; SLD, superluminescent diode
The handheld probe enclosed a sample arm for OCT and a CCD camera (XIMEA, Lakewood, Colorado) to simultaneously acquire surface images of the TM at 15 Hz, as in standard video otoscopy. The raster scanning (1D line) of OCT can be visualized on the surface images of the TM before and during OCT image acquisition. A commercial otoscope head with a pneumatic port (RA Bock Diagnostics, Laramie, Wyoming) was integrated in the 3D-printed probe. Surgical tubing was connected from the pneumatic port in the handheld probe to the pressure module. A previously designed pressure module using a plastic bellow and a voice coil (H2W Technologies, Santa Clarita, California) was utilized to generate cyclic pressure variations that were simultaneous with the measurements [28]. For safety, a mechanical stopper was implemented to prevent the voice coil from generating high pressure. The maximum pressure intensity of around 150 daPa (1 daPa = 10 Pa) was applied at 2 Hz. The frequencies used by physicians when performing pneumatic otoscopy range from 2 to 5 Hz [29]. A standard silicone earbud was used with an ear speculum (see red and purple boxes in Figure 1) to properly seal the ear canal. A pressure sensor (SSC series; Honeywell, Charlotte, North Carolina) measured the pressure in the sealed ear canal at a sampling rate of 1 kHz.
2.2 ∣. Analytical methods
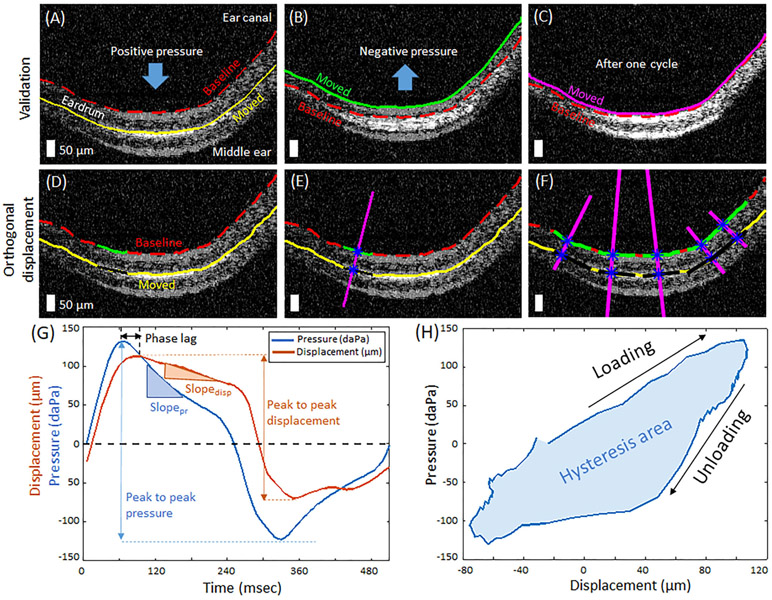
First, OCT B-scans were converted into binary masks after median filtering and thresholding, and the top layer of the TM was segmented (Figure S1). The baseline position of the TM was determined when the applied pressure was zero. The locations of the TM during the cyclic pressure modulations were measured for each frame. In order to validate that the changes in the TM position were induced by the pressure changes in a sealed ear canal, rather than by subject motion, the positions of the TM during one sinusoidal pressure cycle were compared. Figure 2A-C show two overlaid B-scans, the baseline positions (red line), and the moved positions, at three different time points (yellow, green, and magenta lines). Note that the position after one cycle goes back to the baseline position, confirming that there was no interfering motion artifact during the measurements.
FIGURE 2.
Analytical methods of pneumatic optical coherence tomography (OCT) measurements. A-C, Two overlaid OCT images from different time points in cyclic pressure variations validate pneumatic-induced motions of the tympanic membrane (TM). D-F, Method to compute the orthogonal displacement of the TM at various spatial points. Scale bars represent 50 μm. G, Representative cycle of pressure transients and corresponding displacement of the TM. H, Plot of pressure with respect to the TM displacement during one cycle, indicating hysteresis, which is evident in viscoelastic materials. The area enclosed by the hysteresis curve (shaded) is defined as the hysteresis area (HA)
Next, the displacement of the TM was computed. Figure 2D shows a fraction (50 pixels, in green and black lines) of the TM at two different time points. The normal line (magenta line) to the baseline position is shown in Figure 2E. The TM displacement is defined as the orthogonal distance between the baseline and the displaced TM position (distance between two blue asterisks along magenta line in Figure 2E), and thus named as the orthogonal displacement. This method incorporates both lateral and axial directions of the movements, and therefore represents more reliable measurement of the TM displacement. In addition, the orthogonal displacement was calculated at each spatial point along the TM, providing the spatial distribution of the motion (Figure 2F). The thickness of the TM was also computed using a method similar described in previous studies, assuming a refractive index of 1.44 [19, 21].
Based on the orthogonal TM displacement and the synchronized pressure measurements, quantitative metrics were calculated by the following equations:
| (1) |
| (2) |
| (3) |
| (4) |
where pressure and disp are time-dependent measurements of the pressure variations and the orthogonal displacement, respectively. The parameters used in the equations are also illustrated in Figure 2G. The pneumatic stiffness is inversely proportional to the pneumatic compliance and indicates how much the TM resists movement in response to the pressure changes in a sealed ear canal. The phase lag quantifies the temporal response of the TM to the pressure variations. A greater pneumatic stiffness and a longer phase lag are expected for the subjects with MEEs. The slope ratio describes the gradual relaxation response of the TM. The amplitude ratio indicates the ratio of inward and outward movements of the TM and may be used to estimate the middle ear pressure [28].
A hysteresis loop, or a loading-unloading plot, is a characteristic behavior of viscoelastic tissue, such as the TM. The hysteresis loop was generated by plotting the pressure changes against the TM displacement, shown in Figure 2H. The area enclosed by the loop, after the loose ends are connected with a straight line, was computed using the MATLAB ('polyarea'). The hysteresis area (HA) indicates the energy loss from the viscous properties of the TM and other associated contributions in the middle ear, such as the conical shape of the TM, the loading from the ossicle and middle ear pressure.
A one-way analysis of variance (ANOVA) was performed using MATLAB to statistically determine the effect of the presence of a MEE on the user-defined pneumatic metrics. A significance level (α) was set at 0.05. The Tukey's honestly significant difference (HSD) test was performed to further examine which specific group was significantly greater or less from one another, after ANOVA statistics detected a significant effect (p < 0.05). The mean values from the spatial measurements within a B-scan were used.
2.3 ∣. Human subject imaging
Human subject imaging was performed under a protocol approved by the Institutional Review Boards at the University of Illinois at Urbana-Champaign and Carle Foundation Hospital in Urbana, Illinois, with appropriate consent and assent. Adult and pediatric subjects with normal middle ear conditions, suspected OM, or diagnosed OM, participated in this study. Subjects younger than 5 years of age were excluded from the study, since significant subject movement could interfere with the measurements. Pneumatic OCT imaging and tympanometry (AutoTymp TM286, Welch-Allyn) were performed in a standard exam room at Carle Foundation Hospital. The pressure in the sealed ear canal was controlled from tympanometry to sweep between −400 and 200 daPa prior to pneumatic OCT imaging, as per preconditioning of human subjects' ears. Tympanometry is also one of the standard diagnostic tools for the middle ear, and measures the acoustic compliance of the TM. A total of 10 to 15 minutes per subject was spent to capture 3 to 5 pneumatic OCT measurements of each ear in the busy clinical environment.
3 ∣. RESULTS
3.1 ∣. Spatial and temporal dependent motion of the human TM in vivo
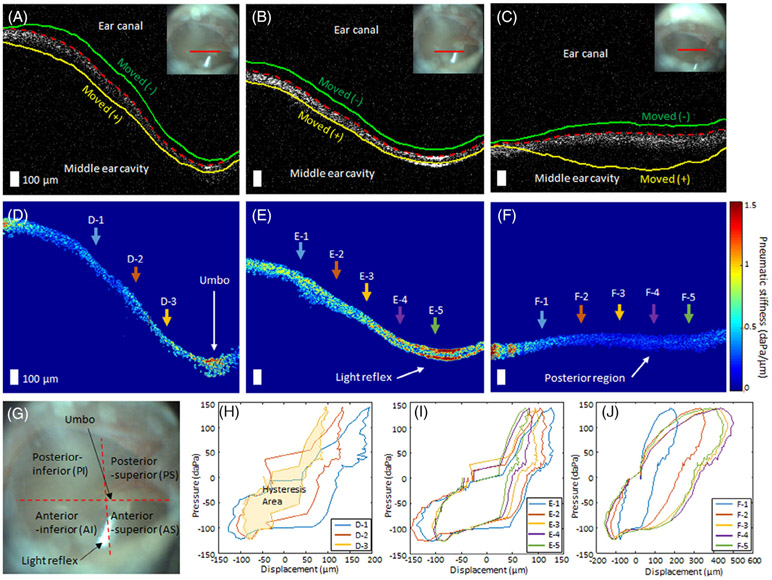
The pneumatic OCT measurements revealed the spatially varying motion of the TM, as hypothesized. The representative results from three different regions on the TM of a healthy volunteer are shown (Figure 3A-C). The dashed red line indicates the baseline position of the TM, whereas the green and yellow lines show the displaced positions of the TM at negative pressure (towards ear canal) and positive pressure (towards middle ear cavity), respectively. The inset otoscope images indicate the OCT scanning location (solid red line).
FIGURE 3.
Representative pneumatic optical coherence tomography (OCT) measurements from a healthy adult volunteer from three different regions on the tympanic membrane (TM). A-C, Representative OCT images from near the umbo, near the light reflex, and from the posterior region on the TM, respectively. The dashed red line indicates the baseline position of the TM, and the green and yellow lines show the displaced positions of the TM when negative and positive pressure were applied to the sealed ear canal, respectively. Inset figures represent the surface view of the TM, where the solid red line indicates OCT scanning location. D-F, Corresponding pseudo-colored pneumatic stiffness maps of the TM (corresponding to the OCT images in, A-C). D-1 to D-3, E-1 to E-5, and F-1 to F-5 denote different spatial points that are used to plot hysteresis curves in, H-J. Scale bars represent 100 μm. G, Surface view of the TM illustrating the TM quadrants, anatomical structures, and features. H-J, Representative hysteresis curves from the different spatial points. Different colors of the arrows in, D-F, correspond to the colors of the curves in, H-J
The pseudo-colored pneumatic stiffness maps based on Equation (1) are shown in Figure 3D-F. It is not surprising to observe a wide range of pneumatic stiffness between various regions on the TM. The TM quadrants, the umbo, and light reflex, commonly used structural features on the TM, are labeled on the surface view of the TM (Figure 3G). The light reflex and the umbo were determined to be the least pneumatically compliant regions, whereas the posterior region was the most compliant, as supported by previous ex vivo studies [7]. This is also consistent with the fact that the umbo generally moves less than the rest of the TM. Furthermore, the hysteresis loops at multiple spatial positions from the three TM regions (denoted in D-1 to D-3, E-1 to E-5, and F-1 to F-5) are plotted in Figure 3H-J. The HA increased with increasing distance from the umbo, suggesting a close relationship between the location of the umbo and the TM mobility. Figure 3J shows the largest hysteresis loop with the largest variance, indicating the greatest compliance in the posterior region. On the other hand, the measurements on the light reflex exhibited the least variation within a field-of-view. The dynamic TM movements captured by the pneumatic OCT system are shown in Video S1.
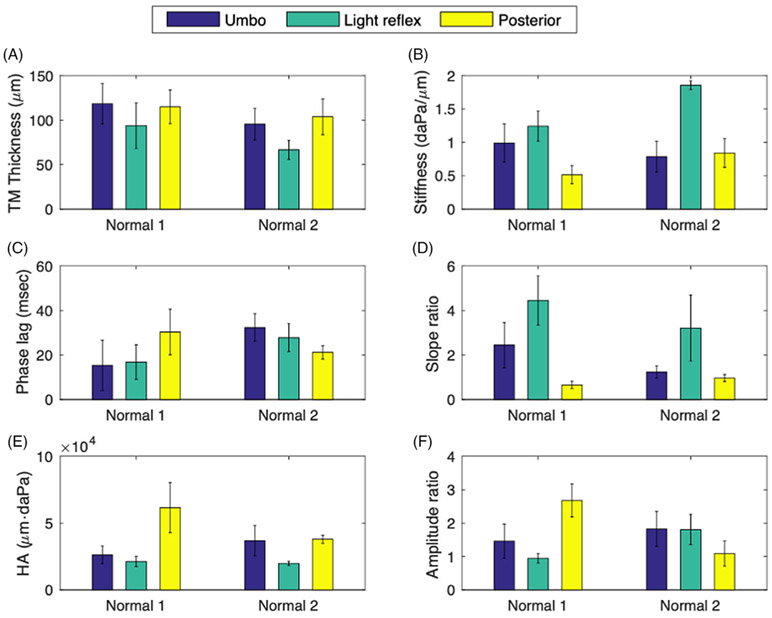
Next, the user-defined metrics at the three different regions from two healthy volunteers are compared. Similar trends between the three TM locations were obtained for both subjects in the TM thickness (Figure 4A), stiffness (Figure 4B), slope ratio (Figure 4D) and HA (Figure 4E). According to Figure 4A,B, the TM at the region of the light reflex is the thinnest, yet exhibits the greatest pneumatic stiffness, suggesting that the pneumatic stiffness is not directly correlated to the TM thickness. The phase lag for the healthy middle ear generally ranged from 20 to 40 msec, yet was less region dependent than the displacement-derived metrics. This difference can be due to the irregular shape of the input pressure, rather than impulse or perfect sinusoidal inputs. The slope ratio shows similar trends as with pneumatic stiffness, whereas the HA and the amplitude ratio were somewhat inversely related to the pneumatic stiffness. The subject “Normal 1” showed the region-dependent amplitude ratio, whereas the subject “Normal 2” had the similar ratio of inward and outward movements in all three regions.
FIGURE 4.
Comparison of the user-defined pneumatic parameters at three different regions (umbo, light reflex, and posterior aspect) on the tympanic membrane (TM). The measurements from each region include around 800 spatially-independent points. Normal 1 and Normal 2 did not have any recent or previous otitis media (OM) history and showed a clear middle ear cavity on optical coherence tomography (OCT)
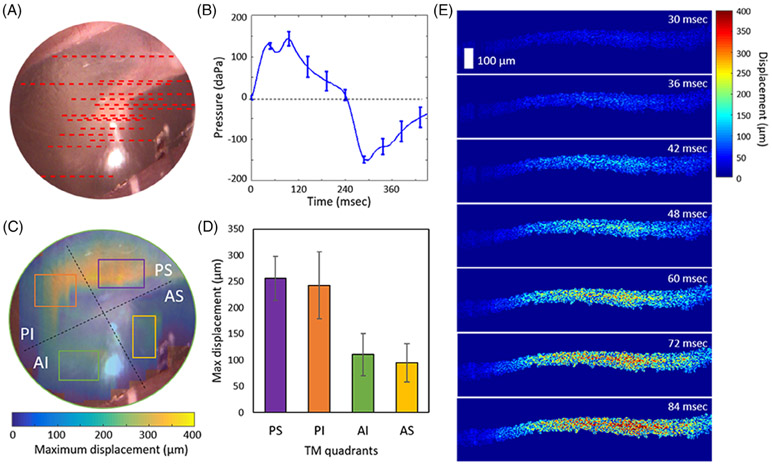
In order to further assess the spatial distribution of the TM motions, a total of 15 measurements were performed on a healthy adult volunteer. The approximate scanning positions and the averaged pressure waveform are visualized in Figure 5A,B, respectively. The measurements were interpolated and filtered to obtain the estimated full-field distribution of the TM displacement, as shown in Figure 5C. The displacement at each TM quadrant is plotted in Figure 5D, which agrees well with a previous simulation study [7]. Furthermore, since the pneumatic OCT system provides a temporal resolution of ~6 msec, the temporal responses of the TM can also be assessed, as in Figure 5E.
FIGURE 5.
Displacement distribution in each TM quadrant determined from pneumatic OCT measurements. A, A total of 15 OCT scanning locations were examined on the TM from one healthy volunteer. B, The averaged pressure transients from the 15 measurements. C, Surface video image of the TM with the overlaid map of the estimated full-field TM displacement. D, Bar chart of the displacement in each TM quadrant marked in (C). E, Time-lapse images showing pseudo-colored regions indicating the measured displacement from the PS region. Scale bar represents 100 μm for all images. AI, anterior inferior; AS, anterior superior; OCT, optical coherence tomography; PI, posterior inferior; PS, posterior superior; TM, tympanic membrane
3.2 ∣. Decreased TM mobility during OM
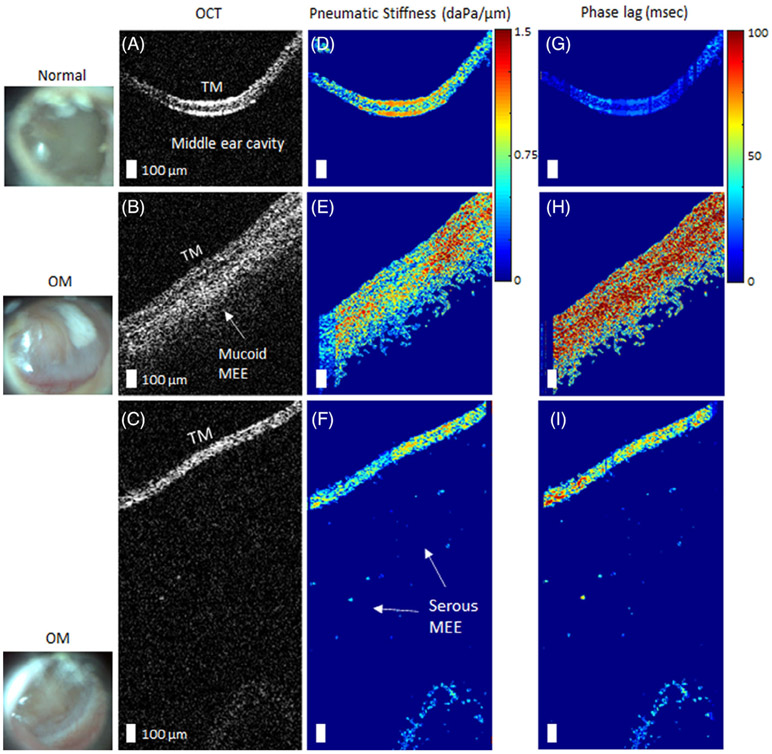
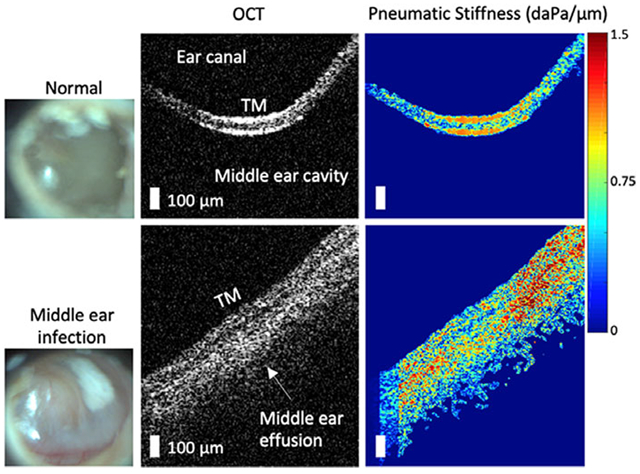
In order to quantitatively examine the decreased TM dynamics, pneumatic OCT measurements were performed on recruited subjects with ear pathology at Carle Foundation Hospital in Urbana, Illinois. To mitigate the large spatial dependence of the movement, the light reflex was selected as a common area to examine between subjects, and was targeted using the simultaneously-acquired surface view of the TM. Figure 6 shows the representative results comparing normal middle ears to ears diagnosed with OM. OCT images indicate the presence of a mucoid (viscous, turbid) MEE (Figure 6B) and a serous (watery) MEE (Figure 6C). A greater pneumatic stiffness was observed for ears with the mucoid MEE (Figure 6E), and a substantial increase in the phase lag was observed for ears with OM, more so for the mucoid MEE than the serous MEE (Figure 6H,I).
FIGURE 6.
Representative pneumatic optical coherence tomography (OCT) measurements of ears with otitis media (OM). A, OCT image of a normal middle ear for comparison, whereas (B) and (C) are from subjects diagnosed with OM. The corresponding surface images of the tympanic membrane (TMs) are shown in the left column. D-F, Corresponding pseudo-colored maps of the pneumatic stiffness and the G-I, phase lags, respectively. The presence of a middle ear effusion (MEE) was surgically confirmed via myringotomy, an incision in the TM, and aspiration. Scale bars represent 100 μm
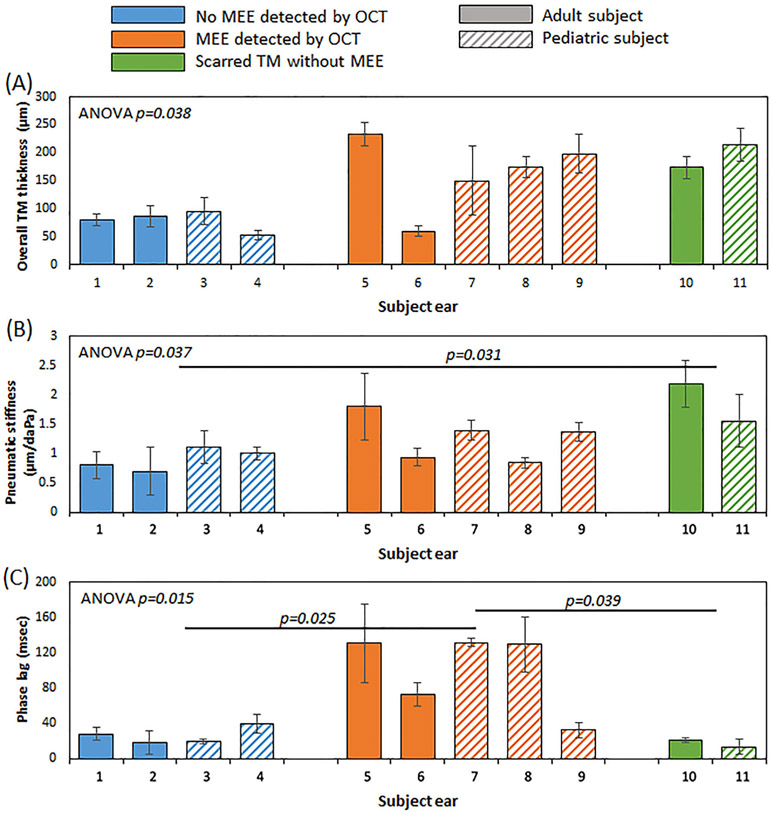
To statistically evaluate the TM mobility between normal middle ears and different pathological conditions, a total of three groups were categorized based on the middle ear structures identified by OCT. The normal group showed a clear middle ear cavity, devoid of OCT signal below the TM. In contrast, the presence of a MEE was visualized via signal below the TM in OCT in the MEE group. The scarred TM without MEE group showed the absence of a MEE, but showed that the TM had an inconsistent thickness indicative of scarring from a previous history of OM. The detailed summary of the subjects is included in Table 1. The overall TM thickness, the pneumatic stiffness, and the phase lag of the three groups are compared in Figure 7. As expected, the normal group had the lowest overall TM thickness. Here, the overall TM thickness includes the mucoid MEE and/or potential biofilm attached to the TM. Although ANOVA (p = 0.038) suggested that the thickness of the groups was statistically different, a posthoc Tukey HSD test revealed a marginal significance between the normal group and the MEE group (p = 0.053), and between the normal group and the scarred TM group (p = 0.065).
TABLE 1.
Subject summary
| Subject Eara | Age | Diagnosisb | Tympanogramc | Note |
|---|---|---|---|---|
| 1 | 26 | Volunteer | A | No previous OM history; Figure 3 |
| 2 | 27 | Volunteer | A | No previous OM history; Figure 6A |
| 3 | 13 | Normal | A | No previous OM history |
| 4 | 10 | URI | A | No effusion visualized from OCT |
| 5 | 44 | OM | B | Effusion confirmedd |
| 6 | 32 | OM | B | Effusion confirmedd; Figure 6C |
| 7 | 7 | OM | B | Effusion confirmedd; Figure 6B |
| 8 | 7 | URI | A | Effusion visualized from OCT |
| 9 | 7 | URI | A | Effusion visualized from OCT |
| 10 | 31 | Volunteer | As | No effusion from OCT; History of OM |
| 11 | 15 | URI | C | No effusion from OCT; History of OM |
Abbreviations: MEE, middle ear effusion; OCT, optical coherence tomography; OM, otitis media; TM, tympanic membrane; URI, upper respiratory infection.
The subject ear number corresponds to the numbers on the x-axis in Figure 7.
Healthy volunteer did not obtain a clinical diagnosis; Upper respiratory infection (URI), commonly known as cold, can precede the development of OM.
Tympanogram 'A' represents normal middle ear, 'As' represents decreased TM mobility, 'B' indicates the presence of a MEE and 'C' represents extreme negative middle ear pressure.
Effusion was surgically confirmed via myringotomy, an incision in the TM, and aspiration.
FIGURE 7.
Comparison of the user-defined pneumatic metrics based on different middle ear conditions. A, The overall tympanic membrane (TM) thickness was generally greater when a middle ear effusion (MEE) or scarring was present. B, The statistically greater pneumatic stiffness was observed when TM scarring was present. C, The phase lag of the MEE group was significantly longer than the other two groups. Detailed information for each subject ear can be found in Table 1
Surprisingly, not all subjects with MEEs showed significantly greater pneumatic stiffness than the normal group, although they exhibited a greater stiffness in general. The scarred TM without MEE group had the greatest pneumatic stiffness and was statistically greater than the normal group (p = 0.031). However, the phase lag of the MEE group was significantly greater than both the normal group (p = 0.025) and the scarred group (p = 0.039), suggesting that the temporal response is more severely impacted than the physical displacement of the TM. This can be explained since the presence of a MEE increases the viscosity (or dampening) of the middle ear system, creating a severe temporal delay. Furthermore, note that the phase lag of the subject ear '9' falls within the normal range, yet with increased TM thickness and slightly increased pneumatic stiffness. This subject was indeed clinically diagnosed as having a normal middle ear, and a very small amount of a MEE was identified from OCT. There was no significant difference between adult and pediatric subjects.
4 ∣. DISCUSSION
In this study, the pneumatic-induced motions of the human TM were quantitatively assessed in vivo using a custom-developed OCT system that resembles a pneumatic otoscope, the guideline recommended diagnostic tool for OM. Previous efforts to quantify the pneumatic movements of the TM involved tracking the positions of the TM structures (the umbo and the handle of malleus) during video pneumatic otoscopy [30, 31] and estimating the movements in pixels during video pneumatic otoscopy combined with a motion magnification algorithm [32]. However, quantification of standard pneumatic otoscopy still suffers from insufficient information about the axial movements and the structural variability of the human TM.
To address this limitation, the pneumatic OCT system offers depth-resolved visualization of the middle ear cavity as well as the motions of the TM, which can be used to quantify intuitive mechanical parameters as well as the thickness of the TM. The simultaneous measurements of the pressure transients allow users to ensure that the system itself does not have a pressure leak, preventing false positive errors of conventional pneumatic otoscopy.
The pneumatic OCT measurements showed the spatial and temporal dependence of the TM mobility. Hysteresis loops exhibited different loading-unloading responses, validating the spatially dependent viscoelastic properties observed on the TM. However, since the hysteresis is a multifactorial behavior from the viscoelastic properties of the TM, the conical shape, and the loading from the ossicle, the HA measured from the study may not purely represent the viscoelastic properties of the TM. It is also worthwhile to highlight that the TM thickness was not directly correlated to the pneumatic stiffness, emphasizing the importance of capturing these dynamic measurements in vivo. The full-field displacement distribution in each TM quadrant was also compared, which cannot be assessed with current diagnostic technologies.
This study also compared the quantified TM mobility of healthy subjects with that of subjects with MEEs in a clinical setting. In general, although the presence of a MEE increases the pneumatic stiffness, its impact on the phase lag was much more significant. This result is slightly different from previous findings where the pneumatic stiffness was significantly greater with the presence of a MEE [27, 28]. This may be due to several factors, such as the averaging of spatially-dependent TM movements, utilizing the orthogonal displacement rather than the axial displacement, including suspected or mild OM in the MEE group, and the small number of subjects. The effect of TM scarring in subjects with a previous history of OM greatly impacted pneumatic stiffness, yet the phase lag was not statistically significant when compared to the normal group. This finding is also potentially beneficial in clinical practices where differentiating a scarred TM from a TM with a MEE is a common diagnostic challenge.
There are several limitations and challenges in this study. Although the pneumatic OCT system operates at a 169 Hz B-scan rate (250 kHz A-scan rate), volumetric scans of the moving TM were not possible with the current setup. Since the clinical measurements were obtained from outpatients recruited on the same day for a short amount of time, acquiring many measurements on slightly different locations on the TM was not practical. Thus, the spatially-dependent movement of the TM was not assessed for clinical measurements. However, we targeted the region near the light reflex in the anterior region, where it had relatively less variations of the displacement compared to the posterior region (shown in Figure 5,D) to minimize the effect from the spatial dependence. The system in this study used the center wavelength of 830 nm for an improved axial resolution and employed a spectrometer-based detection method due to its high phase stability. However, the enhanced speed provided by swept-source OCT can be a potential solution. In addition, a future study will modulate pressure waveforms to examine frequency- and amplitude-dependent responses of the TM. Sealing the ear canal is essential in order to deliver sufficiently large pressure changes and induce detectable movements with OCT. The stability of the probe with respect to the TM during the measurement can be challenging for younger children, as is also the case when performing standard pneumatic otoscopy. Furthermore, additional clinical subjects are needed to characterize statistical differences between patients with different types of OM.
5 ∣. CONCLUSIONS
Assessing TM mobility is important for diagnosing OM, yet the current diagnostic method based on pneumatic otoscopy is highly subjective, and results are difficult to interpret. This study demonstrates in vivo measurement and quantification of pneumatic-driven motions of the TM using a custom-developed, handheld SD-OCT system. The viscoelastic behavior of the TM was observed from the spatially- and temporally-dependent motion. The posterior-superior region on the TM was the most pneumatically compliant, whereas the anterior superior region was the least pneumatically compliant. Furthermore, the presence of a MEE generally exhibited a greater pneumatic stiffness and a significantly longer phase lag (temporal response). The capability of measuring the dynamic properties of the TM in vivo may be used to improve the diagnosis and monitoring of OM, and help develop a more accurate biomechanical model of the human TM.
Supplementary Material
ACKNOWLEDGMENTS
The authors thank Paula Bradley, Ali Moll, MaryEllen Sherwood, Lindsay Stiger and Adam Wright from the Carle Research Office at Carle Foundation Hospital, Urbana, Illinois, for their help with IRB protocol management and subject consenting and assenting. The authors acknowledge Dr. Neena Tripathy, Dr. Anna Ziemer, Dr. Christine M. Chu, Dr. Kathleen K. Buetow and the nursing staff in the Department of Pediatrics, as well as physician assistants Laura A. Browning and Brent Pearman and the nursing staff in the Department of Otolaryngology at Carle Foundation Hospital for their help in subject recruitment and clinical assistance. Finally, the authors thank Pin-Chieh Huang at the Beckman Institute for Advanced Science and Technology for valuable discussions on biomechanics and elastography. This research was funded in part by a Bioengineering Research Partnership grant from the National Institute for Biomedical Imaging and Bioengineering at the National Institutes of Health (NIH/NIBIB R01EB013723 and R01EB028615 S.A.B.), and in part by the McGinnis Medical Innovation Fellowship program. Additional information can be found at http://biophotonics.illinois.edu.
Funding information
McGinnis Medical Innovation Fellowship; National Institute of Biomedical Imaging and Bioengineering, Grant/Award Numbers: R01EB013723, R01EB028615
Abbreviations:
- LCI
low coherence interferometry
- MEE
middle ear effusion
- OCT
optical coherence tomography
- OM
otitis media
- TM
tympanic membrane
Footnotes
CONFLICTS OF INTERESxT
S. A. B., R. L. S. and R. M. N. are co-founders of PhotoniCare, Inc., which is commercializing OCT for imaging the ear. M. A. N. has equity interest in and serves on the clinical advisory board of PhotoniCare, Inc. The remaining authors do not have financial or commercial conflict of interest.
SUPPORTING INFORMATION
Additional supporting information may be found online in the Supporting Information section at the end of this article.
DATA AVAILABILITY STATEMENT
The data that support the findings of this study are available from the corresponding author upon reasonable request and through a collaborative research agreement.
REFERENCES
- [1].Decraemer WF, Funnell WRJ, in Anatomical and mechanical properties of the tympanic membrane, in: Chronic otitis media pathogenesis-oriented therapeutic management (Ed: Ars B), Kugler Publications, The Netherlands: 2008, p. 51. [Google Scholar]
- [2].Lieberthal AS, Carroll AE, Chonmaitree T, Ganiats TG, Hoberman A, Jackson MA, Joffe MD, Miller DT, Rosenfield RM, Sevilla XD, Schwartz RH, Thomas PA, Tunkel DE, Pediatrics 2013, 131(3), e964. [DOI] [PubMed] [Google Scholar]
- [3].Rosenfeld RM, Shin JJ, Schwartz SR, Coggins R, Gagnon L, Hackell JM, Hoelting D, Hunter LL, Kummer AW, Payne SC, Poe DS, Veling M, Vila PM, Walsh SA, Corrigan MD, Otolaryngol. Head Neck Surg 2016, 154(1), S1. [DOI] [PubMed] [Google Scholar]
- [4].Abbott P, Rosenkranz S, Hu W, Gunasekera H, Reath J, BMC Fam. Pract 2014, 15, 181. [DOI] [PMC free article] [PubMed] [Google Scholar]
- [5].Cullas Ilarslan EN, Gunay F, Topcu S, Ciftci E, Int. J. Pediatr. Otorhinolaryngol 2018, 112, 97. [DOI] [PubMed] [Google Scholar]
- [6].Harvey M, Bowe SN, Laury AM, Otolaryngol. Head Neck Surg 2016, 155(3), 373. [DOI] [PubMed] [Google Scholar]
- [7].Gentil F, Parente M, Martins P, Garbe C, Santos C, Areias B, Branco C, Paço J, Jorge RN, J. Biomech 2016, 49, 1518. [DOI] [PubMed] [Google Scholar]
- [8].Ladak HM, Decraemer WF, Dirckx JJJ, Funnell WRJ, J. Acoust. Soc. Am 2004, 116, 3008. [DOI] [PubMed] [Google Scholar]
- [9].De Greef D, Aernouts J, Aerts J, Cheng JT, Horwitz R, Rosowski JJ, Dirckx JJJ, Hear. Res 2014, 312, 69. [DOI] [PMC free article] [PubMed] [Google Scholar]
- [10].Aernouts J, Aerts JRM, Dirckx JJJ, Hear. Res 2012, 290, 45. [DOI] [PubMed] [Google Scholar]
- [11].Huang D, Swanson EA, Lin CP, Schuman JS, Stinson WG, Chang W, Hee MR, Flotte T, Gregory K, Puliafito CA, Fujimoto JG, Science 1991, 254(5035), 1178. [DOI] [PMC free article] [PubMed] [Google Scholar]
- [12].Monroy GL, Won J, Spillman DR, Dsouza R, Boppart SA, J. Biomed. Opt 2017, 22, 1. [DOI] [PMC free article] [PubMed] [Google Scholar]
- [13].Monroy GL, Shelton RL, Nolan RM, Nguyen CT, Novak MA, Hill MC, McCormick DT, Boppart SA, Laryngoscope 2015, 125, E276. [DOI] [PMC free article] [PubMed] [Google Scholar]
- [14].Marom T, Kraus O, Habashi N, Tamir SO, Otolaryngol. Head Neck Surg 2019, 160(3), 447. [DOI] [PubMed] [Google Scholar]
- [15].Ramier A, Rosowski JJ, and Yun S, presented at AIP Conf. Proc. 1965, 1, 020001 (2018). [Google Scholar]
- [16].Preciado D, Nolan RM, Joshi R, Krakovsky GM, Zhang A, Pudik NA, Kumar NK, Shelton RL, Boppart SA, Bauman NM, Otolaryngol. Head Neck Surg 2020, 162 (3), 367. [DOI] [PMC free article] [PubMed] [Google Scholar]
- [17].Monroy GL, Hong W, Khampang P, Porter RG, Novak MA, Spillman DR, Barkalifa R, Chaney EJ, Kerschner JE, Boppart SA, Otolaryngol. Head Neck Surg 2018, 159(1), 117. [DOI] [PMC free article] [PubMed] [Google Scholar]
- [18].Nguyen CT, Jung W, Kim J, Chaney EJ, Novak M, Stewart CN, Boppart SA, Proc. Natl. Acad. Sci 2012, 109(24), 9529. [DOI] [PMC free article] [PubMed] [Google Scholar]
- [19].Monroy GL, Won J, Dsouza R, Pande P, Hill MC, Porter RG, Novak MA, Spillman DR, Boppart SA, NPJ Digit. Med 2019, 2(22), 41746. [DOI] [PMC free article] [PubMed] [Google Scholar]
- [20].Won J, Monroy GL, Huang P-C, Hill MC, Novak MA, Porter RG, Spillman DR, Chaney EJ, Barkalifa R, Boppart SA, Ear Hear. 2020, 41(4), 811. [DOI] [PMC free article] [PubMed] [Google Scholar]
- [21].Hubler Z, Shemonski ND, Shelton RL, Monroy GL, Nolan RM, Boppart SA, Quant. Imaging Med. Surg 2015, 5, 69. [DOI] [PMC free article] [PubMed] [Google Scholar]
- [22].Pande P, Shelton RL, Monroy GL, Nolan RM, Boppart SA, J. Assoc. Res. Otolaryngol 2016, 17, 403. [DOI] [PMC free article] [PubMed] [Google Scholar]
- [23].Van Der Jeught S, Dirckx JJJ, Aerts JRM, Bradu A, Podoleanu AG, Buytaert JAN, J. Assoc. Res. Otolaryngol 2013, 14, 483. [DOI] [PMC free article] [PubMed] [Google Scholar]
- [24].Ramier A, Cheng JT, Ravicz ME, Rosowski JJ, Yun S-H, Biomed. Opt. Express 2018, 9, 5489. [DOI] [PMC free article] [PubMed] [Google Scholar]
- [25].Kim W, Kim S, Oghalai JS, Applegate BE, Opt. Lett 2018, 43, 1966. [DOI] [PMC free article] [PubMed] [Google Scholar]
- [26].MacDougall D, Farrell J, Brown J, Bance M, Adamson R, Biomed. Opt. Express 2016, 7, 4621. [DOI] [PMC free article] [PubMed] [Google Scholar]
- [27].Shelton RL, Nolan RM, Monroy GL, Pande P, Novak MA, Porter RG, Boppart SA, J. Assoc. Res. Otolaryngol 2017, 18, 555. [DOI] [PMC free article] [PubMed] [Google Scholar]
- [28].Won J, Monroy GL, Huang P-C, Dsouza R, HIll MC, Novak MA, Porter RG, Chaney E, Barkalifa R, Boppart SA, Biomed. Opt. Express 2018, 9, 83. [DOI] [PMC free article] [PubMed] [Google Scholar]
- [29].Clarke LR, Wiederhold ML, Gates GA, Otolaryngol. Head Neck Surg 1987, 96, 119. [DOI] [PubMed] [Google Scholar]
- [30].Cho Y-S, Lee D-K, Lee C-K, Ko MH, Lee H-S, Eur. Arch. Otorhinolaryngol 2009, 266, 967. [DOI] [PubMed] [Google Scholar]
- [31].Lee JK, Cho YS, Ko MH, Lee WY, Kim HJ, Kim E, Chung WH, Hong SH, Otolaryngol. Head Neck Surg 2011, 144, 67. [DOI] [PubMed] [Google Scholar]
- [32].Won J, Huang P-C, Boppart SA, J. Phys. Photonics 2020, 2, 034004. [DOI] [PMC free article] [PubMed] [Google Scholar]
Associated Data
This section collects any data citations, data availability statements, or supplementary materials included in this article.
Supplementary Materials
Data Availability Statement
The data that support the findings of this study are available from the corresponding author upon reasonable request and through a collaborative research agreement.


