

Abstract
Fourier transform light scattering (FTLS) is a novel experimental approach that combines optical microscopy, holography, and light scattering for studying inhomogeneous and dynamic media. In FTLS the optical phase and amplitude of a coherent image field are quantified and propagated numerically to the scattering plane. Because it detects all the scattered angles (spatial frequencies) simultaneously in each point of the image, FTLS can be regarded as the spatial equivalent of Fourier transform infrared spectroscopy, where all the temporal frequencies are detected at each moment in time.
Elastic (static) light scattering (ELS) has made a broad impact in understanding inhomogeneous matter, from atmosphere and colloidal suspensions to rough surfaces and biological tissues [1]. In ELS, by measuring the angular distribution of the scattered field, one can infer noninvasively quantitative information about the sample structure (i.e., its spatial distribution of refractive index). Dynamic (quasielastic) light scattering (DLS) is the extension of ELS to dynamic inhomogeneous systems [2]. The temporal fluctuations of the optical field scattered at a particular angle by an ensemble of particles under Brownian motion relates to the diffusion coefficient of the particles. Diffusing wave spectroscopy integrates the principle of DLS in highly scattering media [3]. More recently, dynamic scattering from probe particles was used to study the mechanical properties of the surrounding complex fluid of interest [4]. Thus, microrheology retrieves viscoelastic properties of complex fluids over various temporal and length scales, which is subject to intense current research especially in the context of cell mechanics [5].
Light scattering studies have the benefit of providing information intrinsically averaged over the measurement volume. However, it is often the case that the spatial resolution achieved is insufficient. “Particle tracking” microrheology alleviates this problem by measuring the particle displacements in the imaging (rather than scattering) plane [6,7]. However, the drawback in this case is that relatively large particles are needed such that they can be tracked individually, which also limits the throughput required for significant statistical average. Recently, there has been intense research towards developing new, CCD-based light scattering approaches that extend the spatiotemporal scales of investigation [8–12]. In particular, it has been shown that the density correlation function can be experimentally retrieved via the two point intensity correlation in the near field of the scattered light [13]. This approach was coined near field scattering and its further refinements were successfully combined with Schlerein microscopy [14,15].
We present Fourier transform light scattering (FTLS) as a novel approach to studying static and dynamic light scattering, which combines the high spatial resolution associated with optical microscopy and intrinsic averaging of light scattering techniques. The underlying principle of FTLS is to retrieve the phase and amplitude associated with a coherent microscope image and numerically propagate this field to the scattering plane. This approach requires accurate phase retrieval for ELS measurements and, further, fast acquisition speed for DLS studies. In order to fulfill these requirements, we employed diffraction phase microscopy (DPM), which provides the phase shift associated with transparent structures from a single interferogram measurement [16]. Because of its common path interferometric geometry, DPM is extremely stable in optical path length, to the subnanometer level [17,18]. Our phase measurement is performed in the image plane of a microscope rather than the Fourier plane [19], which offers important advantages in the case of the thin samples of interest here. The signal sampling, phase reconstruction, and unwrapping are more robustly performed in the image plane than in the case of Fourier or Fresnel holography, in which the detection is performed at some distance from the image plane, where high-frequency interference patterns and phase discontinuities may occur. Further, in the image plane of a thin and transparent sample, such as live cells, the intensity is evenly distributed, which efficiently utilizes the limited dynamic range of the CCD.
We applied FTLS to dilute microsphere suspensions in water, sandwiched between two cover slips. The measured complex field associated with such samples can be expressed as
| (1) |
In Eq. (1), UF is the (time-invariant) complex field associated with each particle, δ is the 2D Dirac function describing the position (xi, yi) of each of the N moving particles, and the integral is performed over the microscope field of view A.
Figures 1(a) and 1(b) show the amplitude and phase distributions obtained by imaging 3 μm polystyrene beads at a particular point in time. The scattered far field is obtained by Fourier transforming Eq. (1) in space. This angular field distribution factorizes into a form field ŨF, which is determined by the angular scattering of a single particle, and a structure field ŨS, describing the spatial correlations in particle positions,
| (2) |
where q is the spatial wave vector and . Figure 1(c) shows the resulting intensity distribution for the beads in Figs. 1(a) and 1(b). As expected for such sparse distributions of particles, the form function is dominant over the entire angular range.
FIG: 1.
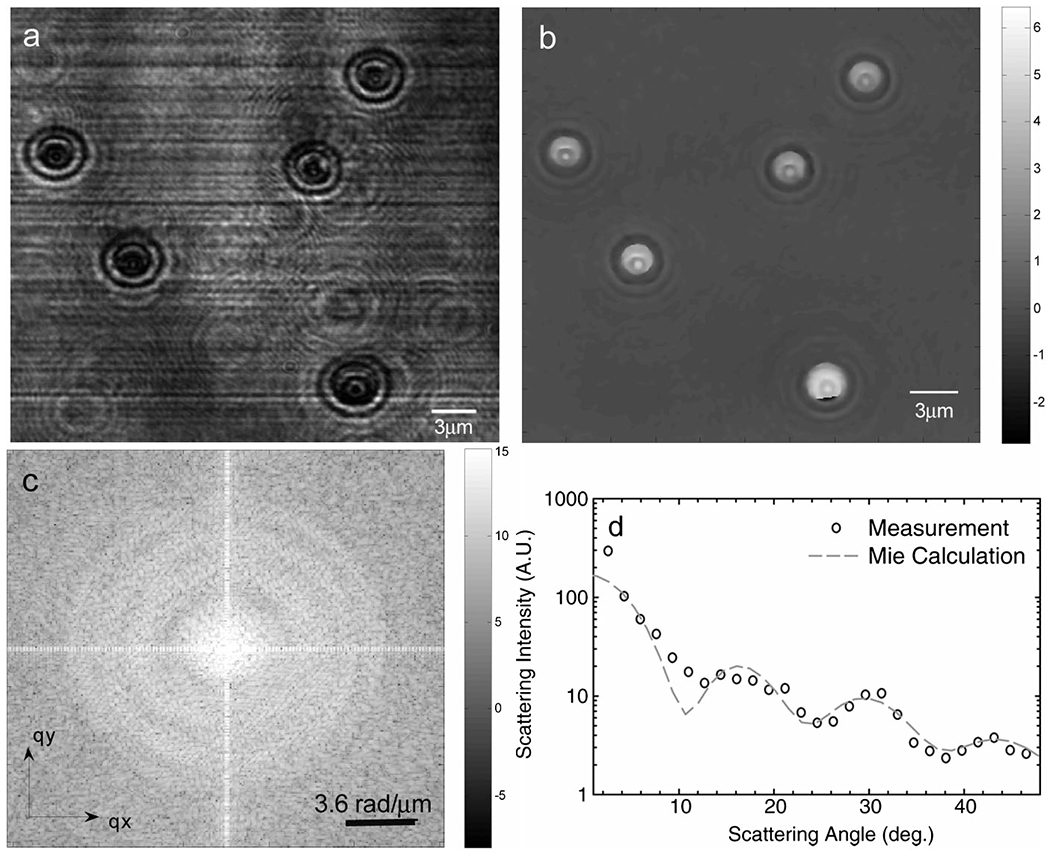
FTLS reconstruction procedure of angular scattering from 3 Δm beads. (a) Amplitude image. (b) Reconstructed phase image. (c) Scattering wave vector map. (d) Retrieved angular scattering and comparison with Mie calculation.
In order to test the ability of FTLS to retrieve quantitatively the form function of the spherical dielectric particles, we used Mie theory for comparison [1]. The scattered intensity [e.g., Fig. 1(c)] is averaged over rings of constant wave vectors, q = (4π/λ) sin(θ/2), with θ the scattering angle, as exemplified in Fig. 1(d). To demonstrate the remarkable sensitivity of FTLS to weakly scattering objects, we performed a systematic comparison between the measured angular scattering and Mie theory for various numbers of beads within the field of view. In order to quantify the background noise in our measurements, we generated the FTLS signal of a region with no particles.
Thus, this signal incorporates contributions from residual inhomogeneities in the light beams, impurities on optics, etc. These results are summarized in Fig. 2(a) and show that the FTLS background noise is below the scattering signal from a single particle. The expected oscillations in the angular scattering become more significant as the number of beads increases, establishing the quantitative agreement between the FTLS measurement and Mie theory. Adding more particles improves the signal to noise, but statistics is not required for the principle of FTLS to work. Thus, FTLS is sensitive to scattering from single micron-sized particles, which contrasts with the common measurements on colloidal suspensions, where the signal is averaged over a large number of scatterers.
FIG: 2.
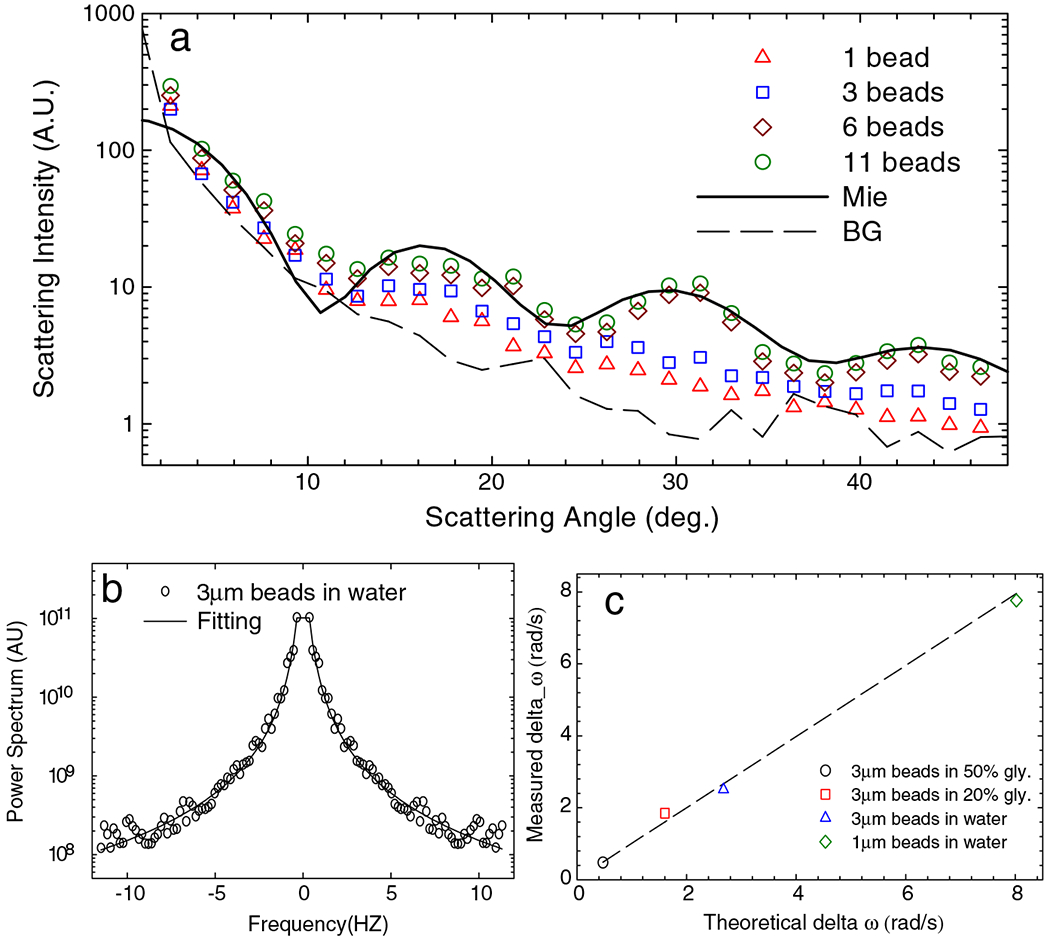
(a) Angular scattering signals associated with 1, 3, 6, and 11 particles, as indicated. The solid line indicates the Mie calculation and the dash line the background signal, measured as described in text. (b) Power spectrum of scattering intensity fluctuations associated with 3 μm particles in water. The solid line indicates the fit with a Lorentzian function. (c) Measured spectral bandwidth vs expected bandwidth for different particles and liquids, as indicated.
Acquiring sets of time-lapse phase and amplitude images, we studied the dynamic light scattering signals from micron-sized particles undergoing Brownian motion in liquids of various viscosities. Thus, the power spectrum of the scattered intensity can be expressed for each wave vector as
| (3) |
Figure 2(b) shows the power spectrum associated with 3 μm beads in water. The experimental data are fitted with a Lorentzian function, which describes the dynamics of purely viscous fluids, P(q, ω) ∝ 1/[1 + (ω/Dq2)2], where D = kBT/4πηa, the 2D diffusion coefficient, kB is the Boltzmann constant, T the absolute temperature, η the viscosity, and a the radius of the bead. The fits describe our data very well and allow for extracting the viscosity of the surrounding liquids as the only fitting parameter. The measured vs expected values of the power spectrum bandwidth are plotted in Fig. 2(c), which show very good agreement over more than a decade in bandwidths (or, equivalently, viscosities).
We employed FTLS to determine experimentally the scattering phase functions of red blood cells (RBCs) and tissue sections, which has important implications in the optical screening of various blood constituents and tissue diagnosis [17,20]. Figure 3(a) shows a quantitative phase image of RBCs prepared between two cover slips, with the identifiable “dimple” shape correctly recovered. The corresponding angular scattering is presented in Fig. 3(b), where we also plot for comparison the results of a finite difference time domain (FDTD) simulation previously published by Karlsson, et al. [21]. Significantly, over the 10 ° range available from the simulation, our FTLS measurement and the simulation overlap very well.
FIG: 3.
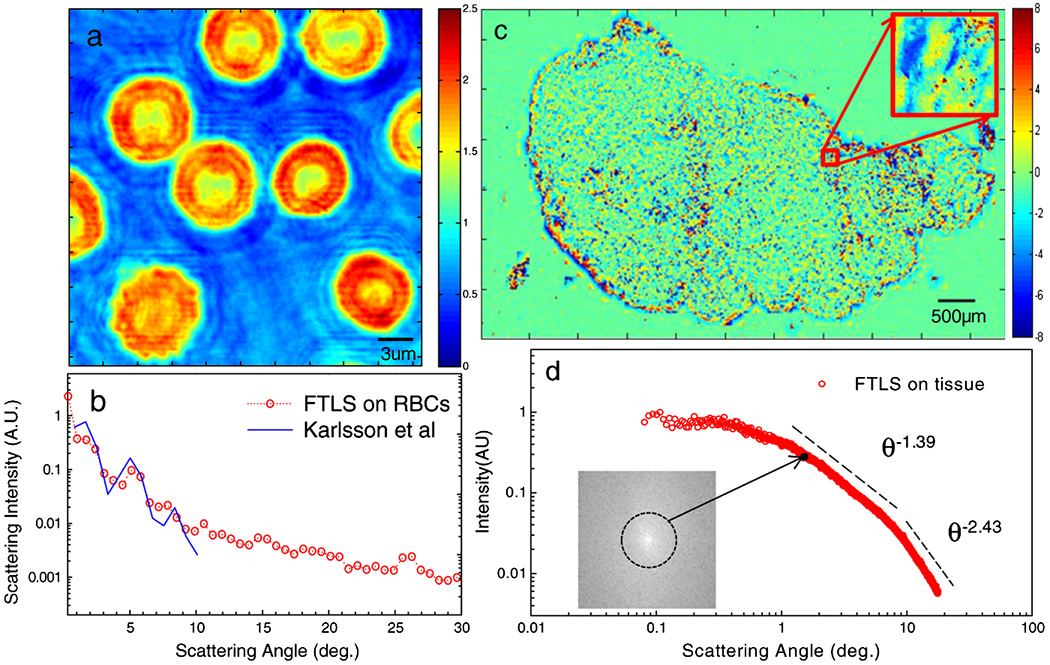
(a) Spatially resolved phase distribution of red blood cells. The color bar indicates phase shift in radians. (b) Scattering phase function associated with the cells in (a). The FDTD simulation by Karlsson et al. is shown for comparison (the x axis of the simulation curve was multiplied by a factor of 532/633, to account for the difference in the calculation wavelength, 633 nm, and that in our experiments, 532 nm). (c) Gigapixel quantitative phase image of a rat mammary tumor tissue slice. Color bar indicates phase shift in radians. (d) Angular scattering from the tissue in (c). The inset shows the 2D scattering map, where the average over each ring corresponds to a point in the angular scattering curve. The dashed lines indicate power laws of different exponents, as indicated.
In order to extend the FTLS measurement towards extremely low scattering angles, we scanned large fields of view by tiling numerous high-resolution microscope images. Figure 3(c) presents a quantitative phase map of a 5 μm thick tissue slice obtained from the mammary tissue of a rat tumor model by tiling ~1, 000 independent images. This 0.3 gigapixel composite image is rendered by scanning the sample with a 20 nm precision computerized translation stage. The scattering phase function associated with this sample is shown in Fig. 3(d). We believe that such a broad angular range, of almost 3 decades, is measured here for the first time and cannot be achieved via any single measurement. Notably, the behavior of the angular scattering follows power laws with different exponents, as indicated by the two dashed lines. This type of measurement over broad spatial scales may bring new light into unanswered questions, such as tissue architectural organization and possible self similar behavior [22].
In Fig. 4 we present dynamic FTLS measurements on the fluctuating membranes of RBCs. The power spectrum follows power laws with different exponents in time for all scattering angles (or, equivalently, wave vectors). As expected, the slower frequency decay at larger q values indicates a more solid behavior; i.e., the cell is more compliant at longer spatial wavelengths. Notably, the exponent of −1.36 of the longer wavelength (5 ° angle), is compatible with the −1.33 value predicted by Brochard et al. for the fluctuations at each point on the cell [23].
FIG: 4.
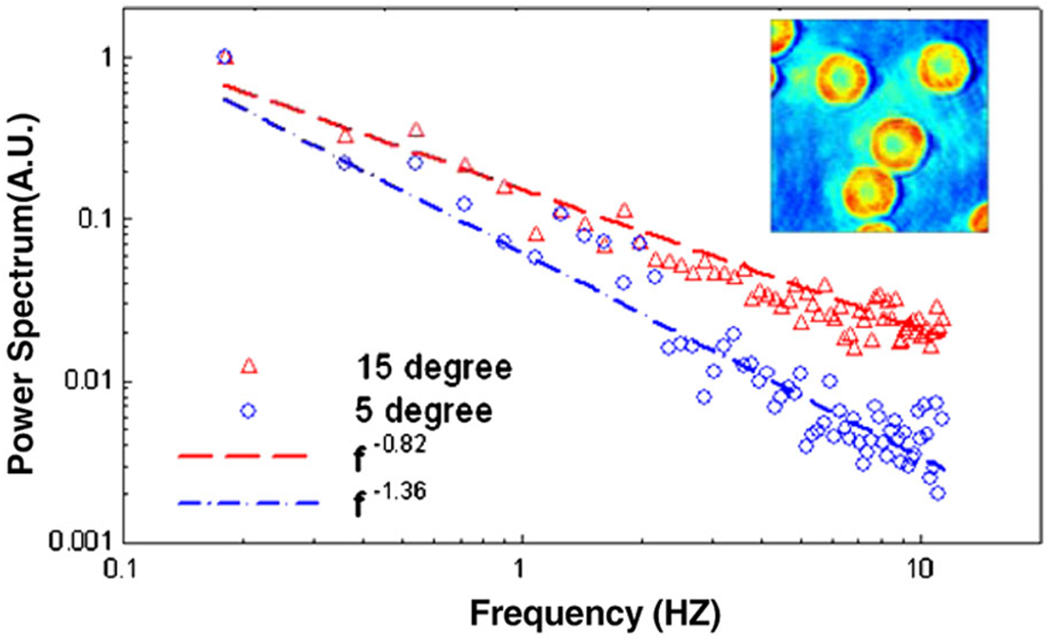
Dynamics FTLS of red blood cells: log-log power spectra at 5 and 15 degrees with the respective power law fits, as indicated. The inset shows one RBC phase image from the time sequence.
In summary, we presented FTLS as a new approach for studying static and dynamic light scattering with enhanced sensitivity, granted by the image-plane measurement of the optical phase and amplitude. In FTLS, spatial resolution of the scatterer positions is well preserved. By contrast, intensity-based measurements such as near field scattering [13] use speckle analysis, which assumes Gaussian statistics for the scattered fields (thus, large number of scatterers). In this type of experiments, the positions of the scattering particles are unknown. Further, FTLS has the benefit of retrieving the angular scattering from single micron-sized particles. These remarkable features are due to the interferometric experimental geometry and the reliable phase retrieval. We anticipate that this type of measurement will enable new advances in life sciences, due to the ability to detect weak scattering signals over broad temporal (milliseconds to hours) and spatial (fraction of microns to centimeters) scales.
References
- [1].van de Hulst HC, Light Scattering by Small Particles (Dover Publications, New York, 1981). [Google Scholar]
- [2].Berne BJ and Pecora R, Dynamic Light Scattering with Applications to Chemistry, Biology and Physics (Wiley, New York, 1976). [Google Scholar]
- [3].Pine DJ et al. , Phys. Rev. Lett 60, 1134 (1988). [DOI] [PubMed] [Google Scholar]
- [4].Mason TG and Weitz DA, Phys. Rev. Lett 74, 1250 (1995). [DOI] [PubMed] [Google Scholar]
- [5].Mizuno D et al. , Science 315, 370 (2007). [DOI] [PubMed] [Google Scholar]
- [6].Mason TG et al. , Phys. Rev. Lett 79, 3282 (1997). [Google Scholar]
- [7].Crocker JC et al. , Phys. Rev. Lett 85, 888 (2000). [DOI] [PubMed] [Google Scholar]
- [8].Wong APY and Wiltzius P, Rev. Sci. Instrum 64, 2547 (1993). [Google Scholar]
- [9].Scheffold F and Cerbino R, Curr. Opin. Colloid Interface Sci 12, 50 (2007). [Google Scholar]
- [10].Dzakpasu R and Axelrod D, Biophys. J 87, 1288 (2004). [DOI] [PMC free article] [PubMed] [Google Scholar]
- [11].Amin MS et al. , Opt. Express 15, 17001 (2007). [DOI] [PubMed] [Google Scholar]
- [12].Neukammer J et al. , Appl. Opt 42, 6388 (2003). [DOI] [PubMed] [Google Scholar]
- [13].Giglio M, Carpineti M, and Vailati A, Phys. Rev. Lett 85, 1416 (2000). [DOI] [PubMed] [Google Scholar]
- [14].Brogioli D, Vailati A, and Giglio M, Europhys. Lett 63, 220 (2003). [Google Scholar]
- [15].Croccolo F et al. , Appl. Opt 45, 2166 (2006). [DOI] [PubMed] [Google Scholar]
- [16].Popescu G et al. , Opt. Lett 31, 775 (2006). [DOI] [PubMed] [Google Scholar]
- [17].Park Y et al. , Proc. Natl. Acad. Sci. U.S.A 105, 13730 (2008). [DOI] [PMC free article] [PubMed] [Google Scholar]
- [18].Lue N et al. , Opt. Lett 33, 2074 (2008). [DOI] [PMC free article] [PubMed] [Google Scholar]
- [19].Alexandrov SA et al. , Phys. Rev. Lett 97, 168102 (2006). [DOI] [PubMed] [Google Scholar]
- [20].Tuchin VV, Tissue Optics (The International Society for Optical Engineering, Bellingham, Washington, 2007). [Google Scholar]
- [21].Karlsson A et al. , IEEE Trans. Biomed. Eng 52, 13 (2005). [DOI] [PubMed] [Google Scholar]
- [22].Hunter M et al. , Phys. Rev. Lett 97, 138102 (2006). [DOI] [PubMed] [Google Scholar]
- [23].Brochard F and Lennon JF, J. Phys. (Paris) 36, 1035 (1975). [Google Scholar]