

Abstract
Psychotic Like Experiences (PLEs) have been reported in several cultures. The 16 item Launay-Slade Hallucination Scale-Extended (LSHS-E) measures hallucination like experiences (HLEs) in the general population. This study investigated the psychometric properties and the factor structure of LSHS-E Hindi among healthy adults of Delhi.
LSHS-E was translated from English to Hindi and then back to English. It was administered as a paper pencil questionnaire to 182 adults from the general population. Reliability of LSHS-E Hindi was measured using Cronbach’s alpha and factor structure was established using confirmatory factor analysis (CFA). It was tested against the Community Assessment of Psychic Experiences (CAPE-42) for convergent and divergent validity. Latent Class Analysis (LCA) was performed to identify subgroups with different endorsement of HLEs.
Among 182, 18 participants reporting mental and neurological disorders were excluded. LSHS-E Hindi had good reliability (0.85; 95% CI: 0.82 to 0.88). CFA of Hindi LSHS-E revealed the a priori four-factor solution to be best, namely: ‘intrusive thoughts’, ‘vivid daydreams’, ‘multisensory HLEs’, ‘auditory and visual HLEs’. LSHS-E Hindi showed stronger correlation with positive domain of CAPE than with negative and depression domains. LCA revealed three classes: low, intermediate and high endorsement of HLEs. Participants with highest endorsement of HLEs were less educated and had highest endorsement on all CAPE dimensions.
LSHS-E Hindi has good psychometric properties and can be used to study HLEs in Indians. The four-factor structure model depicts the multidimensionality of HLEs, with ‘intrusive thoughts’ being the most commonly reported HLE in the sample. LCA supports the continuum hypothesis of HLEs.
Keywords: Hallucination, India, Health, Adult, Hindi LSHS-E
1. Introduction
Hallucinatory experiences may exist on a continuum (Bentall and Slade, 1985; Launay and Slade, 1981) from the general population to schizophrenia, mood disorders, personality disorders, substance abuse disorders, and neurological disorders like dementia, and epilepsy (Beavan et al., 2011). When reported by healthy individuals, these experiences are referred to as ‘hallucination like experiences’ (HLES), experienced at a subclinical level but not reaching the threshold for a diagnosis. HLEs are experiential anomalies that do not necessarily indicate psychopathology (Beavan et al., 2011; Ochoa et al., 2008; Siddi et al., 2019).
Studying HLEs has clinical utility. It helps to distinguish between experiences requiring clinical attention from those that do not (Larøi, 2012). Moreover, with growing evidence of hallucinations preceding delusions in the emergence of psychosis, checking for HLEs in nonclinical samples becomes crucial as they not allow only for early identification of vulnerable individuals, but also for early preventive intervention (Smeets et al., 2012a,b). Hence, such investigations are useful when clinically assessing individuals who transit from nonclinical HLEs to clinical hallucinations (Larøi, 2012).
The prevalence rates for HLEs and other psychotic like experiences (PLEs) are higher in middle and lower income countries, such as Nepal which reported 32% prevalence of HLEs (Nuevo et al., 2012). Moreover, higher HLEs are more likely in young unmarried women, and among the unemployed and the less educated (Johns et al., 2002; McGrath et al., 2015; Nuevo et al., 2012).
Latent class analysis (LCA) helps to identify subgroups in the larger population that have probabilistically similar endorsement profiles for PLEs, and to understand the pattern of their experiences (Gale et al., 2011). Some studies have found a three class solution of PLEs in the general population using LCA (Gale et al., 2011; Mamah et al., 2013; Pionke et al., 2019), while others have found a four class solution (Pignon et al., 2018; Shevlin et al., 2007) with differing degrees of PLEs endorsement ranging from a ‘normative’ class (almost no psychotic symptoms) to a ‘psychosis’ class (very high prevalence of all psychotic symptoms). These studies have clinical relevance as greater the prevalence of PLEs in a subgroup, greater is the prevalence of comorbid psychopathology. They also support the continuum hypothesis of PLEs. Moreover, LCA studies facilitate our understanding of specific socio-demographic correlates of high endorsement classes that carry the maximum risk for conversion into psychopathology.
The Launay-Slade Hallucinations Scale (LSHS) is widely used to measure hallucinatory experiences in clinical and healthy populations (Aleman et al., 2001; Bentall and Slade, 1985; Siddi et al., 2017). It was first developed in 1981 by Launay and Slade as a 12 item scale to test for hallucinatory predisposition, and contained items measuring both pathology and sub-clinical hallucinations. The respondents chose between true/false to rate each item. The scale has been revised several times both in terms of content and response choices. Bentall and Slade (1985) replaced the binary response choices with a 5-point Likert rating. They also changed two negative response items to positive ones (item 9 and 11). The extended version (called LSHS-E) includes 16 items tapping into the multimodality of hallucinatory experiences (Larøi and Van Der Linden, 2005).
Bentall and Slade (1985) carried out a principal component analysis on their 12-item scale and reported a two-factor solution: hallucinatory experience (accounting for maximum variance) and a negative response set. Items of negative response set were changed to positive in subsequent revisions of the scale Various authors attempted to determine the factor structure of LSHS-E on nonclinical samples (e.g. Larøi et al., 2004; Larøi and Van Der Linden, 2005). The latest resolution reported four factors:(a) auditory-visual HLEs; (b) multisensory HLEs; (c) intrusive thoughts; and (d) vivid daydreams (Vellante et al., 2012).
LSHS-E has been translated into several languages. Both the French and the Spanish version reported good internal consistency (Cronbach’s α > 0.80) in the general population (Larøi and Van Der Linden, 2005; Siddi et al., 2018). However, no study has validated the scale on a Hindi-speaking Indian sample. The current study aimed to test the internal reliability and the factor structure of LSHS-E in Hindi-speaking Indians, and to explore the convergent and divergent validity of LSHS-E Hindi.
2. Methods
2.1. Procedure
The study was approved by the Institutional Ethics Committee at ABVIMS-Dr. RML Hospital New Delhi, as well as by the Research Committee and the Sant Joan de Déu Ethics Committee in Spain. The study was initially developed as an anonymous online survey using the “Webropol survey” platform (https://www.webropolsurveys.com/) on the general population. However, since very few Indians (n = 9) participated online, the study was later administered as an offline paper pencil survey in the general population with efforts to maintain variation. Online responses have not been included here.
2.2. Sample
Participants were recruited from the general population of Delhi after due written informed consent. Participants were from 18 to 65 years and were required to exclude any experiences where they might have been under the effect of drugs or alcohol. No two participants from the same family was recruited. The survey was conducted between June 2018 to August 2019.
2.3. Instruments
2.3.1. Launay-Slade Hallucinations Scale – Extended (LSHS-E)
LSHS-E is a 16 items self-report scale for assessing HLEs in the general population (Larøi et al., 2004; Larøi and Van Der Linden, 2005). The 16 items cover hallucinatory experiences of visual, auditory, olfactory and tactile modalities. It also includes items on hypnagogic, hypnopompic hallucinations, vivid daydreams and the experience of sensed presence. Answer to each item is marked on 5-point Likert scale: (0) certainly does not apply to me (1) possibly does not apply to me (2) unsure (3) possibly applies to me (4) certainly applies to me. Higher overall score is indicative of higher likelihood of HLEs.
LSHS-E was first translated into Hindi by DM who is a licensed clinical psychologist and is well versed in both English and Hindi, having studied both the languages up to graduation. The translation was verified by SND, a licensed psychiatrist fluent in both languages who simplified the terms keeping in mind the Hindi-speaking population of Delhi. Her modifications were incorporated. The scale was then back translated into English by an Ayurveda practitioner fluent in Hindi and English. The translation was confirmed in a joint meeting of all translators. The translation yielded equivalent Hindi words for all the items. The words were arranged into sentences such as to reflect the syntax of the Hindi language and tested on a few lay persons who found the tool acceptable. It was then used in the field.
2.3.2. Community Assessment of Psychic Experiences (CAPE)
CAPE is a 42 items scale assessing psychotic like experiences (PLEs) in the general population through three domains of positive symptoms (20 items), negative symptoms (14 items) and depression symptoms (8 items) (Stefanis et al., 2002). It rates the frequency of PLEs on a 4-point rating scale from never (1) to almost always (4). It is a self-report questionnaire and has been validated in the general population (Konings et al., 2006). The scale was translated from English to Hindi and back translated Hindi by expert researchers well versed in both the languages using the same procedure as described above for LSHS-E.
2.4. Statistics
The Statistical Package for Social Sciences (SPSS) version 20 (IBM SPSS Inc., 2016) and dedicated packages running in R (core Team, 2018) were used for the analysis of the data. Tests were two-tailed with a significance threshold set at p < 0.05. Continuous variables were reported as means with standard deviations; categorical variables were reported as counts and percentages. Cronbach’s alpha with a 95% confidence interval (95% CI) was used to assess internal coherence, as a measure of reliability. For group comparisons, reliability values ≥0.70 are considered satisfactory (Kottner et al., 2011).
Confirmatory factor analysis (CFA) was used to test whether the data fit into the most often reported four-factor structure of LSHS-E (Preti et al., 2014; Siddi et al., 2019). CFA was carried out with lavaan R (Rosseel, 2012) and the semTools (Jorgensen et al., 2018) packages running in R. The Mardia test showed violation of the multivariate normality assumption (Mardia test: skew = 1518.78, p < 0.0001; kurtosis = 9.19, p < 0.0001).Therefore, maximum likelihood estimation with robust standard errors and Satorra-Bentler scaled test statistic was used to test CFA models, since it is robust against violation of normality (Curran et al., 1996). Models were compared on the basis of standard parameters (Hu and Bentler, 1999) and information criteria such as the Akaike information criterion (AIC; Akaike, 1987), and the Bayesian information criterion (BIC; Schwarz, 1978).
As in Preti et al. (2014), three models were tested: 1) the unidimensional model, which assumes that all items load on a single factor of propensity to experience hallucinations; 2) two-factor model, assigning items 1 to 7 to a subclinical or non-psychopathological factor and items 8 to 16 to a clinical or psychopathological factor (Serper et al., 2005); 3) a four-factor model that distinguishes among “intrusive thoughts” factor (items 1, 2, 3), “vivid daydreams” factor (items 5,6,7), “multisensory HLEs” factor (items 11, 12, 13, 14, 15), and “auditory and visual HLEs” factor (items 4, 8,9,10,16). A factor loading of 0.32 (10% of the variance) was the minimum requirement for an item to be retained (Comrey and Lee, 1992).
After establishing the factor structure of the Hindi version of LSHS-E, the correlation of LSHS-E with measures of PLEs (CAPE) was assessed to test convergent and divergent validity of the scale and its factors. LSHS-E and its factors are expected to be associated more with items assessing (positive) PLEs, as measured by the positive dimension of CAPE, than with items of the Negative and Depressive dimensions of CAPE. Correlation coefficients were compared according to Steigers’ z test (Steiger, 1990).
Latent class analysis (LCA) was used to test for the existence of discrete groups with similar item endorsement profiles on LSHS-E (McCutcheon, 2011). To maximize performance of LCA, the items of LSHS-E were dichotomized (0/1), assigning the value “1” to the scores indicative of the occurrence of the experience (“possibly applies to me”; “certainly applies to me”); the value “0” was assigned to the scores suggesting the experience was unsure or never occurred (“certainly does not apply to me”; “possibly does not apply to me”; “unsure”). The likelihood ratio (−2*Ln(L)), the consistent AIC (cAIC; Bozdogan, 1987), the BIC, and the sample-size adjusted BIC (ssBIC; Sclove, 1987) were used to assess the fit and model selection, with lower values indicating the best model. The classification of the participants across the classes of the model was assessed with the standardized entropy measure (0 to 1), with higher values indicating better accuracy.
LSHS-E factor mean scores and CAPE dimensions are calculated by adding up item scores and then averaging the sum by the number of items for each factor. This is to compensate for the unequal number of items in the factors and dimensions.
3. Results
3.1. Sample sociodemographic
A total of 182 participants were recruited for the study (females/males:66/116 mean age:35.9 years). Participants reporting any mental or neurological disorder were excluded from the final analysis (n = 18, females = 1, males = 7): 4 participants reported treatment for depression and anxiety, 6 for depression alone, 3 for anxiety alone, 2 for bipolar disorder, 1 for borderline personality disorder, 1 for migraine, and 1 person did not remember the diagnosis.
Our sample was young with the mean age being 34.6 years. Two thirds of the sample were males and married. More than two thirds were employed, males in jobs and females as homemakers. More than half our sample were educated up to high school level or above (Table 1).
Table 1.
Participant Demographics (n = 164; mean age = 34.6, SD = 11.6).
| Variables | Variable Class | Frequency | Percent |
|---|---|---|---|
| Sex | Male | 110 | 67.10 |
| Female | 54 | 32.90 | |
| Marital Status | Married | 114 | 69.51 |
| Single, Widowed or Separated | 50 | 30.49 | |
| Employment Status | Employed, Homemaker | 129 | 78.66 |
| Unemployed, Students or Retired | 35 | 21.34 | |
| Illiterate | 2 | 1.22 | |
| Education Status | Up to Middle School | 25 | 15.24 |
| High School | 73 | 44.51 | |
| Bachelors or above | 64 |
3.2. Reliability
Internal consistency of LSHS-E Hindi and CAPE was calculated using Cronbach’s alpha. Cronbach’s alpha for was 0.85 (95%CI: 0.82 to 0.88) for LSHS-E; it was 0.80 (0.75 to 0.84) for CAPE positive dimension; 0.78 (0.73 to 0.83) for CAPE depressive dimension; and 0.73 (0.66 to 0.79) for CAPE negative dimension.
3.3. Confirmatory factor analysis
Three models were tested but the four-factor model had the best fit with the lowest values of the information criteria among the assessed models (Table 2).
Table 2.
Goodness of fit indexes for the proposed models in the sample (n = 164)
| Model | χ2 | df | p | CFI | RMSEA (95%CI) | SRMR | AIC | BIC |
|---|---|---|---|---|---|---|---|---|
| One-factor | 146.4 | 104 | 0.0028 | 0.911 | 0.051(0.033–0.067) | 0.064 | 9690.7 | 9789.9 |
| Two-factor | 131.4 | 103 | 0.031 | 0.943 | 0.041(0.017–0.059) | 0.059 | 9670.8 | 9773.1 |
| Four-factor | 118.7 | 98 | 0.075 | 0.959 | 0.036(0.000–0.055) | 0.057 | 9666.2 | 9784.0 |
| Threshold for fit | >0.05 | >0.90 | <0.06 | >0.09 | The lower the better | The lower the better |
Note: CFI = comparative fit index; RMSEA = root mean square error of approximation; SRMR = standardized root mean square residual; AIC = Akaike information criterion; BIC = Bayesian information criterion.
In the four-factor model, all items had a factor loading higher than 0.32, except item 13 relating to ‘sensed presence’ (Table 5). The most frequently reported HLEs are those related to intrusive thoughts (Table 5).
Table 5.
Descriptive statistics for the items of LSHS-E with factor loading of confirmatory factor analysis (n = 164).
| Mean (SD) | Possibly/Certainly applies to me | Factor loading | |
|---|---|---|---|
| 1. Sometimes a passing thought will seem so real that it frightens me | 2.30 (1.78) | 59% | 0.661 |
| 2. Sometimes my thoughts seem as real as actual events in my life | 2.19 (1.83) | 57% | 0.563 |
| 3. No matter how hard I try to concentrate on my work unrelated thoughts always creep into my mind | 2.30 (1.75) | 59% | 0.418 |
| 4. In the past I have had the experience of hearing a person’s voice and then found that there was no-one there | 1.24 (1.79) | 31% | 0.635 |
| 5. The sounds I hear in my daydreams are generally clear and distinct | 1.08 (1.63) | 24% | 0.600 |
| 6. The people in my daydreams seem so true to life that I sometimes think that they are | 1.16 (1.76) | 29% | 0.657 |
| 7. In my daydreams I can hear the sound of a tune almost as clearly as if I were actually listening to it | 1.05 (1.66) | 26% | 0.696 |
| 8. I often hear a voice speaking my thoughts aloud | 1.16 (1.73) | 29% | 0.523 |
| 9. I have been troubled by hearing voices in my head | 1.01 (1.64) | 25% | 0.486 |
| 10. On occasions I have seen a person’s face in front of me when no-one was in fact there | 0.73 (1.48) | 18% | 0.647 |
| 11. Sometimes, immediately prior to falling asleep or upon awakening, I have had the experience of having seen, felt or heard something or someone that wasn’t there, or I had the feeling of being touched even though no one was there | 1.13(1.73) | 28% | 0.607 |
| 12. Sometimes, immediately prior to falling asleep or upon awakening, I have felt that I was floating or falling, or that I was leaving my body temporarily | 1.04 (1.72) | 26% | 0.518 |
| 13. On certain occasions I have felt the presence of someone close who had passed away | 1.22 (1.77) | 30% | 0.273 |
| 14. In the past, I have smelt a particular odour even though there was nothing there | 1.29 (1.80) | 32% | 0.597 |
| 15. I have had the feeling of touching something or being touched and then found that nothing or no one was there | 0.86 (1.55) | 21% | 0.597 |
| 16. Sometimes, I have seen objects or animals even though there was nothing there | 0.65 (1.39) | 16% | 0.613 |
3.4. Convergent and divergent validity of the LSHS-E
Factor scores were calculated by summing up the score of each item and then averaging for the number of items in the factor. The same was applied for the calculation of the scores on each CAPE dimension. The correlation of the “intrusive thoughts” factor with CAPE positive dimension was higher than its correlation with CAPE depressive dimension (Steiger’s test: z = 2.49, p = 0.012) or CAPE negative dimension (Steiger’s test: z = 4.65, p < 0.0001). The same was observed for the “vivid daydreams” factor (respectively, Steiger’s test: z = 3.01, p = 0.002; and Steiger’s test: z = 3.48, p = 0.0005); the “multisensory HLEs” factor (respectively, Steiger’s test: z = 2.77, p = 0.005; and Steiger’s test: z = 2.95, p = 0.003); and the “auditory and visual HLEs” factor (respectively, Steiger’s test: z = 3.25, p = 0.001; and Steiger’s test: z = 3.27, p = 0.001).
3.5. Latent class analysis (LCA)
The information criteria indicators suggested that a 3-class repartition of the sample was the best solution. Indeed, although the likelihood ratio decreased progressively from a 1-class solution to the 6-class solution, the cAIC increased after the 2-class solution, the BIC had an increase after the 3-class solution and the ssBIC did not vary relevantly after the 3-class solution (Fig. 1).
Fig. 1.

Fit indices for the latent class analysis of the Hindi. LSHS-E, with values of the information criteria (on the left), the likelihood ratio (center), and the entropy (on the right). BIC = Bayesian information criterion; AIC = Akaike information criterion.
Accuracy of classification was acceptable for the 3-class solution, with entropy = 0.83. In this solution there was a baseline class with very low endorsement of most LSHS-E items, including 78 (48%) participants; an intermediate class, including 72 (44%) participants; and a third class with high endorsement on all LSHS-E items, including 14 (9%) participants (Fig. 2).
Fig. 2.
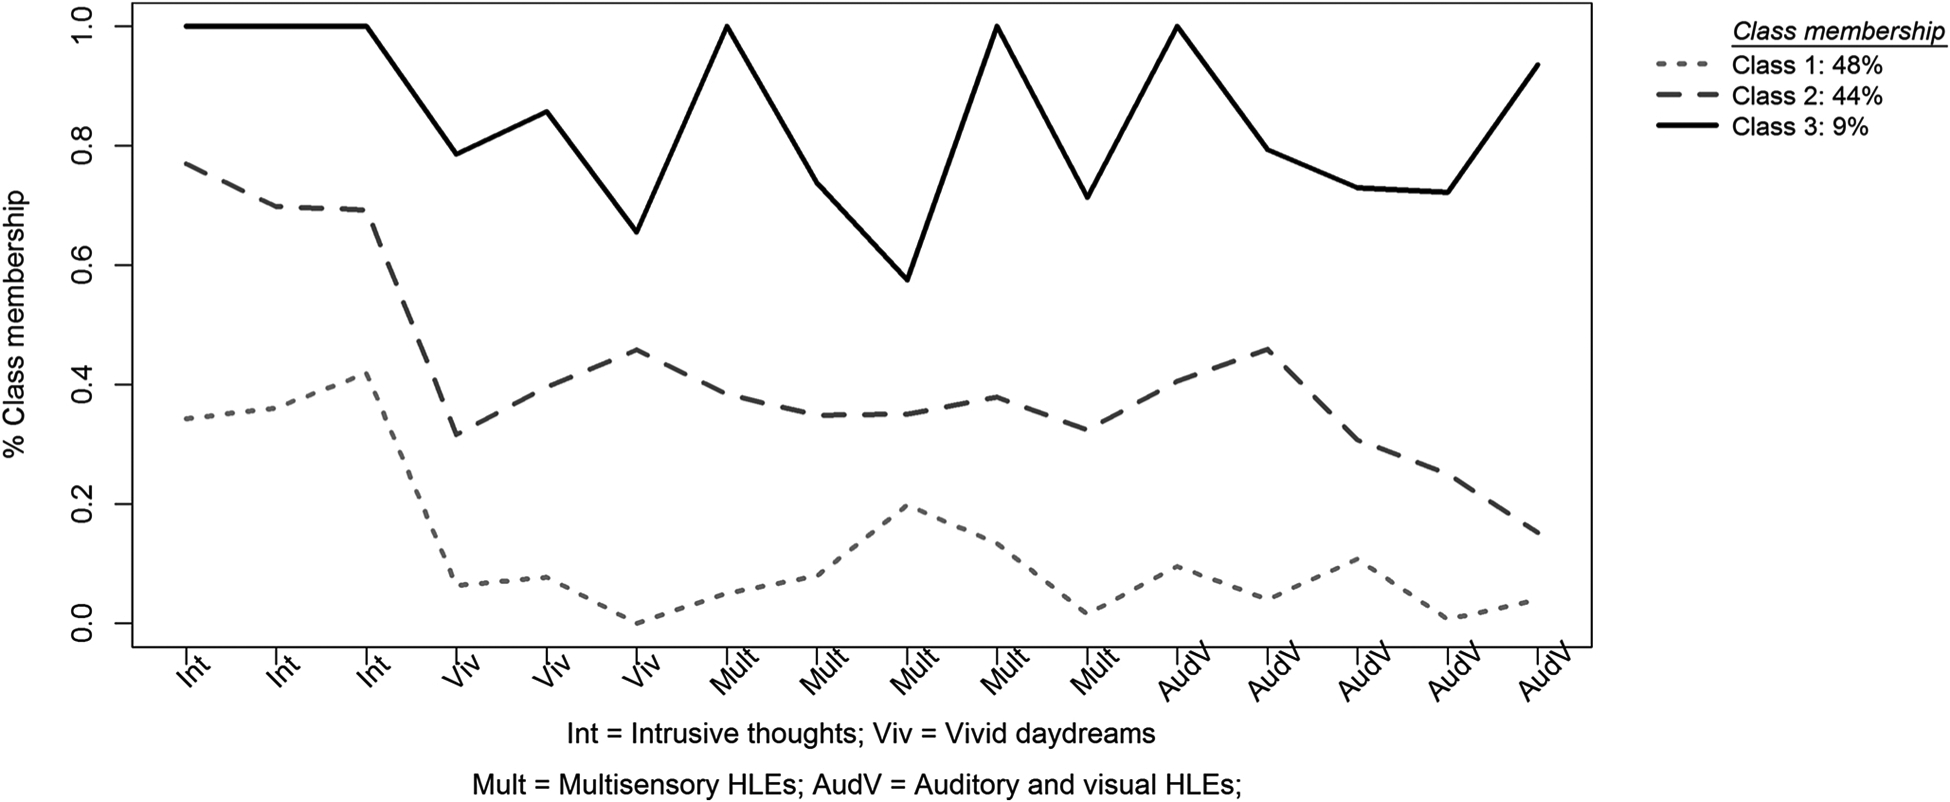
Profile plot for the latent class analysis of the Hindi LSHS-E (16 items). The Y-axis represents the class-specific mean scores as proportions of the maximum score for the indicator. The X-axis contains the 16-item profile of the Hindi LSHS-E. Items are marked according to the factor they belong to.
3.6. Distribution of socio-demographic indicators and scores across the classes
Almost an equal number of participants were in Class 1 and Class 2 (low and intermediate HLEs respectively). As expected, class 3 participants had significantly high endorsement of HLEs in all the domains (highest in the domain of intrusive thoughts) when compared to the other two classes. Class 3 also had significantly higher endorsement of CAPE positive domains than class 1 and 2 (Table 4). Class 3 had lower education level in comparison to the other two classes. Only 14% of class 3 participants held a bachelor’s degree and above when compared to class 1 (44%) and class 2 (39%) (Table 3).
Table 4.
Socio demographic, LSHS-E and CAPE scores’ distribution across 3 classes extracted by LCA
| Variables | Class 1 (Low HLEs) N = 78 |
Class 2 (Intermediate HLEs) N = 72 |
Class 3 (High HLES) N = 14 |
Chi-Square (p-value)/ANOVA(p-value) | |||
|---|---|---|---|---|---|---|---|
| Men | 55 | 71% | 44 | 61% | 11 | 79% | 2.415(.299) |
| Women | 23 | 29% | 28 | 39% | 3 | 21% | |
| Age (mean; SD) | 36.95;10.687 | 31.99;11.369 | 37.29;11.378 | 4.164 (0.017*) | |||
| Illiterate | 2 | 0 | 0 | 17.963 (0.006**) | |||
| Upto middle | 10 | 56% | 8 | 61% | 7 | 86% | |
| High School | 32 | 36 | 5 | ||||
| Bachelors and above | 34 | 44% | 28 | 39% | 2 | 14% | |
| Intrusive thoughts (mean;SD) | 1.45;1.167 | 2.83;0.87 | 3.88;0.211 | 56.523 (0.000**) | |||
| Vivid daydreams (mean;SD) | 0.25;0.502 | 1.65;1.332 | 3.02;0.698 | 69.017 (0.000**) | |||
| Multisensory HLEs(mean; SD) | 0.41;0.616 | 1.46;0.846 | 3.17;0.688 | 99.616 (0.000**) | |||
| Auditory and visual HLEs (mean; SD) | 0.25;0.449 | 1.27;0.865 | 3.3;0.65 | 133.862 (0.000**) | |||
| CAPE positive (mean; SD) | 1.29; 0.24 | 1.57; 0.25 | 1.83; 0.45 | 58.049 (0.000**) | |||
| CAPE depressive (mean; SD) | 1.53; 0.28 | 1.85; 0.50 | 1.91; 0.55 | 25.54 (0.000**) | |||
| CAPE negative (mean; SD) | 1.50; 0.32 | 1.73; 0.38 | 1.78; 0.53 | 18.027 (0.000**) | |||
p < 0.01;
p < 0.05
Table 3.
Correlation between the four factors of LSHS-E and the three dimensions of CAPE (n = 164).
| Intrusive thoughts | Vivid daydreams | Multisensory HLEs | Auditory and visual HLEs | CAPE positive | CAPE depressive | |
|---|---|---|---|---|---|---|
| Intrusive thoughts | – | |||||
| Vivid daydreams” | 0.451** | – | ||||
| Multisensory HLEs | 0.412** | 0.500** | – | |||
| Auditory and visual HLEs | 0.473** | 0.523** | 0.681** | – | ||
| CAPE positive | 0.467** | 0.369** | 0.533** | 0.545** | – | |
| CAPE depressive | 0.307** | 0.165* | 0.362** | 0.345** | 0.588** | – |
| CAPE negative | 0.207* | 0.167* | 0.377** | 0.373** | 0.550** | 0.699** |
p < 0.0001,
p < 0.05
4. Discussion
The current study aimed to establish the psychometric properties of LSHS-E on a Hindi-speaking Indian sample. This is the first study to test the reliability and validity of LSHS-E in Hindi, and to the best of our knowledge, the first study to assess HLEs among Indians. The Hindi version of the scale showed good internal reliability, and thus can be used to investigate HLEs and other PLEs among Hindi-speaking Indians.
Factor analysis of LSHS-E Hindi demonstrated that it best conforms to the four factor solution as reported by Siddi et al. (2018) and Vellante et al. (2012). The study, thus, provides evidence for the multidimensionality of HLEs in Hindi-speaking Indians on LSHS-E as reported in other cultures (e.g. Castiajo and Pinheiro, 2017; Fonseca-Pedrero et al., 2011; Serper et al., 2005; Vellante et al., 2012). Although, other research groups have found a three factor solution (Castiajo and Pinheiro, 2017) and a five factor solution (Larøi et al., 2004) of the extended 16 item scale, our results fitted best into the four factor model, namely; ‘intrusive thoughts’, ‘vivid dreams’, ‘multisensory hallucinations’, ‘auditory and visual hallucinations’.
The most frequently endorsed domain of HLEs was related to ‘intrusive thoughts’, or vivid thoughts (59%). This has also been found in validation studies of the scale in other cultures (Castiajo and Pinheiro, 2017; Siddi et al., 2018). The least frequently reported HLEs was visual HLEs (16%). This is contradictory to previous studies that indicate visual hallucinations to be the most common form in healthy individuals (Ohayon, 2000; Simon et al., 2009; Sommer et al., 2010; Tien, 1991). However, our results confirm those of a recent Portuguese study on a nonclinical sample which found visual HLEs to be less frequent than auditory, olfactory and tactile HLEs (Castiajo and Pinheiro, 2017), suggesting minimal differences in HLEs in sensory modalities among healthy individuals (Johns and Van Os, 2001; Tien, 1991).
Among all the items, only item 13 regarding ‘sensed presence of a close individual who has passed away’ had a lower factor loading suggesting that this item did not adequately capture the experience of HLEs in the sample. No study has explored this HLE in Indians. It is well known that hallucinations are culturally shaped, hence, it is likely that the presence of a deceased individual is not aberrantly experienced by Indians, and sensing their presence may even be comforting and a means of continued communication with the dead (Kurotori and Kato, 2015).Such experiences are also more likely when the individual is alone (Olson et al., 1985). In collectivistic cultures like India, death is mourned by the family and even by the community together, and the communication with the deceased individual continues through mementos, memories and talking openly about them with others (Hussein and Oyebode, 2009). Hence, the deceased individual is unlikely to be experienced as a hallucination. People below 40 years without any psychopathology are less likely to experience hallucinations of a deceased individual (Rees, 1971). Our sample was young (mean age was 36 years), and may not have experienced the death of a close individual in their life yet.
The Hindi LSHS-E was validated against CAPE-42, which is a well validated scale for measuring PLEs in the community. The findings were in the expected direction, with LSHS-E having better correlation with the positive dimension of CAPE than with the negative and the depressive dimension. The auditory-visual HLEs showed the strongest correlation with the positive dimension of CAPE. This was expected since CAPE’s positive dimension mostly included items that overlapped with auditory and visual HLEs.
To the best of our knowledge, this is also the first Indian study to explore the multidimensionality of HLEs in the general population using LCA. Previous studies (e.g. Gale et al., 2011; Mamah et al., 2013; Pignon et al., 2018) have employed LCA to study PLEs but not exclusively to study HLEs. LCA classified the sample into 3 classes: low, intermediate and high endorsement of HLEs, providing evidence for their existence on a continuum (van Os and Reininghaus, 2016). The three classes differed quantitatively with the largest group being the low endorsement group (48%), similar to Pionke et al’s (2019) study. Class 3 or the high endorsement group was the smallest supporting Linscott and Van Os (2013) hypothesis that the most severe class is less frequent in the general population. Class 3 is of clinical importance as it has the highest risk of developing psychopathology This group has the highest endorsement of intrusive thoughts followed by auditory and visual HLEs, which is not a trend seen in the other two classes. This is in line with the contemporary psychiatrist Schroder’s view that intrusive thoughts progress into auditory and visual hallucinations as the thoughts become increasingly louder and more distinct (Kaminski et al., 2019).
Low education has been found to be associated with higher PLEs (Loch et al., 2017). This was confirmed in our sample wherein low and intermediate endorsement groups had higher education (bachelor’s degree and above) when compared to the high endorsement group. Thus, people with less education in the general population represent a vulnerable group for developing psychiatric disorders.
As expected, class 3 had the highest endorsement on CAPE depressive and negative dimensions, providing further evidence of psychiatric comorbidities in symptoms of psychosis and depression (McGrath et al., 2015; Singh et al., 2010). Thus, depressive symptoms are crucial in the symptom profile of psychosis in general, and hallucinations in specific. However, our three classes differed quantitatively in terms of the frequency of endorsement rather than qualitatively.
4.1. Implication
The study has implication for both research and clinical set ups. Firstly, the study provides evidence for the multimodal nature of HLEs in Hindi-speaking Indians. Thus, HLEs are prevalent across different cultures, although their nature and manifestation may be shaped by the individual culture. For example, our study showed that HLEs related to deceased individuals may not be prominent in collectivistic cultures due to distinct cultural mores and ethos.
The study also provides evidence for the dimensional nature of hallucinations existing in healthy populations on the one end of the spectrum, to clinical populations on the other end of the spectrum indicating psychopathology (Laurens et al., 2012; Van Os et al., 2009). This has clinical relevance for the eradication of stigma as these experiences are not specific to psychiatric patients and maybe experienced by the general public at large.
4.2. Strengths and limitations
This is the first study, to the best of our knowledge, to explore the presence of HLEs in a Hindi-speaking Indian sample. Although the study was conducted on a limited sample of 182 participants, all the participants were interviewed face to face as against an online survey used in other cultures (Castiajo and Pinheiro, 2017; Siddi et al., 2018). All the interviewers were trained extensively, thus increasing the reliability of data collection. The inclusion criteria were adhered to strictly, thereby reducing the risk of potential simulation likely in online surveys. This also allowed the interviewers to reach out to those individuals in the general population who did not have access to the internet.
Although participants with neurological and psychiatric illnesses were excluded from the final analysis, participants were included if they reported alcohol consumption once a week or more (n = 10), or consumption of cannabis once a week or more (n = 3), or consuming both alcohol and cannabis once a week or more (n = 4). However, none of these individuals reported having any psychopathology or a formal psychiatric diagnosis of substance or alcohol dependence. Moreover, face to face interviews allowed the interviewers to ascertain that the survey was not undertaken under the influence of any substance or alcohol.
A major limitation of the study is its small sample size. All the participants were recruited from New Delhi, who were well versed in the Hindi language. India is a large country with diversity in cultures, religions and languages, all of which are known to influence PLEs. Thus, further studies are needed to investigate HLEs in different populations of the country speaking Hindi and perhaps, speaking different Indian languages. Translating LSHS-E into different Indian languages would allow the investigation of HLEs in a more representative sample of Indians.
A further limitation of the study is the lack of comparison between healthy and clinical populations. We found only 18 participants with self-reported past or current psychiatric diagnoses. Comparison with a clinical population would have yielded a better understanding of those HLEs which carry the maximum risk of conversion into psychopathology. Our study found intrusive thoughts to be the most common HLE. Hence, if intrusive thoughts had most commonly been reported by psychiatric patients, then we could have concluded that ‘intrusive thoughts’ HLE has a high risk of becoming a psychopathology, with such individuals requiring clinical attention.
Furthermore, our study through Latent Class Analysis identified a ‘high endorsement group’ (LCA terminology) who are possibly vulnerable to developing psychopathology and may eventually require both clinical attention and intervention. However, this group did not receive any medical or psychosocial intervention from our group since the group was identified only after data analysis which was carried out without any personal identifiers. Nevertheless, each participant in the survey received the instruction to contact the staff that was conducting the study in case they needed to. None did.
It is desirable that future studies on the topic, make provisions for psychoeducation to participants identified as high risk within a preventive care paradigm.
5. Conclusion
The Hindi LSHS-E is a reliable and a valid measure for assessing HLEs in Hindi-speaking Indians. HLEs is a multidimensional construct with intrusive thoughts being the most frequently reported HLE in this population. The scale is particularly valuable in the nonclinical population for identifying high risk individuals and subsequently providing preventive intervention. Furthermore, classification of the sample into three subgroups of HLEs endorsement supports the notion of hallucinations being a dimensional construct than a categorical one, suggesting that the high endorsement group represents a vulnerable group requiring clinical attention.
Acknowledgment
We thank the participants of this study.
We acknowledge the funding from various agencies. Salary of SS was supported by the DST project ‘The Neurobiology of Dyslexia: integrating brain with behaviour’ (File No.S R/CSRI/80/2016(C) 22.11.2016), MoST, Government of India project. Salary of VS was supported by the Indian Council of Medical Research project “National Coordination Unit of Implementation Research” under Task Force for NMHP (File No. 51 4 l-41 1 51 lMl2017lNCD- 1/31.07.2018).
Salary of TB was supported by the Fogarty International Center, NIH project ‘Cross Fertilized Research Training for new investigators in India and Egypt (D43 TW009114)’ to SND. The content of this manuscript is solely the responsibility of the authors and does not necessarily represent the official views of NIH or ICMR. NIH and ICMR had no role in the design and conduct of the study; collection, management, analysis, and interpretation of the data; preparation, review, or approval of the manuscript; and decision to submit the manuscript for publication.
Financial Disclosure
This research did not receive any specific grant from funding agencies in the public, commercial, or not-for-profit sectors.
Footnotes
Declaration of Competing Interest
The authors have no conflict of interest to declare.
References
- Akaike H, 1987. Factor analysis and AIC. Psychometrika. 10.1007/BF02294359. [DOI] [Google Scholar]
- Aleman A, Nieuwenstein MR, Böcker KBE, De Haan EHF, 2001. Multidimensionality of hallucinatory predisposition: factor structure of the Launay-Slade Hallucination Scale in a normal sample. Personality and Individual Differences. 10.1016/s0191-8869(00)00045-3. [DOI] [Google Scholar]
- Beavan V, Read J, Cartwright C, 2011. The prevalence of voice-hearers in the general population: A literature review. Journal of Mental Health. 10.3109/09638237.2011.562262. [DOI] [PubMed] [Google Scholar]
- Bentall RP, Slade PD, 1985. Reality testing and auditory hallucinations: A signal detection analysis. British Journal of Clinical Psychology. 10.1111/j.2044-8260.1985.tb01331.x. [DOI] [PubMed] [Google Scholar]
- Bozdogan H, 1987. Model selection and Akaike’s Information Criterion (AIC): The general theory and its analytical extensions. Psychometrika. 10.1007/BF02294361. [DOI] [Google Scholar]
- Castiajo P, Pinheiro AP, 2017. On “hearing” voices and “seeing” things: Probing hallucination predisposition in a Portuguese nonclinical sample with the Launay-Slade Hallucination Scale-revised. Frontiers in Psychology. 10.3389/fpsyg.2017.01138. [DOI] [PMC free article] [PubMed] [Google Scholar]
- Comrey AL, Lee HB, 1992. Interpretation and application of factor analytic results. In: Comrey AL, Lee HB (Eds.), A First Course in Factor Analysis. [Google Scholar]
- core Team, R., 2018. R: A Language and Environment for Statistical Computing. R Foundation for Statistical Computing, Vienna, Austria. [Google Scholar]
- Curran PJ, West SG, Finch JF, 1996. The Robustness of Test Statistics to Nonnormality and Specification Error in Confirmatory Factor Analysis. Psychological Methods. 10.1037/1082-989X.1.1.16. [DOI] [Google Scholar]
- Fonseca-Pedrero E, Santarén-Rosell M, Lemos-Giráldez S, Paino M, Sierra-Baigrie S, Muñiz J, 2011. Psychotic-like experiences in the adolescent general population. Actas Espanolas de Psiquiatría 39 (3), 155–162. Retrieved from. http://www.ncbi.nlm.nih.gov/pubmed/21560075. [PubMed] [Google Scholar]
- Gale CK, Wells JE, Mcgee MA, Oakley Browne MA, 2011. A latent class analysis of psychosis-like experiences in the New Zealand Mental Health Survey. Acta Psychiatrica Scandinavica. 10.1111/j.1600-0447.2011.01707.x. [DOI] [PubMed] [Google Scholar]
- Hu LT, Bentler PM, 1999. Cutoff criteria for fit indexes in covariance structure analysis: Conventional criteria versus new alternatives. Structural Equation Modeling. 10.1080/10705519909540118. [DOI] [Google Scholar]
- Hussein H, Oyebode JR, 2009. Influences of religion and culture on continuing bonds in a sample of British Muslims of Pakistani origin hanan hussein. Death Studies. 10.1080/07481180903251554. [DOI] [PubMed] [Google Scholar]
- IBM SPSS Inc, 2016. SPSS Statistics for Windows. IBM Corp. Released 2012. 10.1364/OFC.2014.M2H.4. [DOI] [Google Scholar]
- Johns LC, Nazroo JY, Bebbington P, Kuipers E, 2002. Occurrence of hallucinatory experiences in a community sample and ethnic variations. British Journal of Psychiatry. 10.1192/bjp.180.2.174. [DOI] [PubMed] [Google Scholar]
- Johns LC, Van Os J, 2001. The continuity of psychotic experiences in the general population. Clinical Psychology Review. 10.1016/S0272-7358(01)00103-9. [DOI] [PubMed] [Google Scholar]
- Kaminski JA, Sterzer P, Mishara AL, 2019. “Seeing Rain”: Integrating phenomenological and Bayesian predictive coding approaches to visual hallucinations and self-disturbances (Ichstörungen) in schizophrenia. Consciousness and Cognition. 10.1016/j.concog.2019.05.005. [DOI] [PubMed] [Google Scholar]
- Konings M, Bak M, Hanssen M, Van Os J, Krabbendam L, 2006. Validity and reliability of the CAPE: A self-report instrument for the measurement of psychotic experiences in the general population. Acta Psychiatrica Scandinavica. 10.1111/j.1600-0447.2005.00741.x. [DOI] [PubMed] [Google Scholar]
- Kottner J, Audige L, Brorson S, Donner A, Gajewski BJ, Hróbjartsson A, et al. , 2011. Guidelines for Reporting Reliability and Agreement Studies (GRRAS) were proposed. International Journal of Nursing Studies. 10.1016/j.ijnurstu.2011.01.016. [DOI] [PubMed] [Google Scholar]
- Kurotori I, Kato S, 2015. A Clinical Case of Grief Hallucination through the Mourning Work Normal Grief and Spiritual Care. Seishin Shinkeigaku Zasshi = Psychiatria et Neurologia Japonica. [PubMed] [Google Scholar]
- Larøi F, 2012. How do auditory verbal hallucinations in patients differ from those in non-patients? Frontiers in Human Neuroscience 6 (February), 1–9. 10.3389/fnhum.2012.00025. [DOI] [PMC free article] [PubMed] [Google Scholar]
- Larøi F, Marczewski P, Van Der Linden M, 2004. Further evidence of the multidimensionality of hallucinatory predisposition: Factor structure of a modified version of the Launay-Slade Hallucinations Scale in a normal sample. European Psychiatry. 10.1016/S0924-9338(03)00028-2. [DOI] [PubMed] [Google Scholar]
- Larøi F, Van Der Linden M, 2005. Nonclinical participants’ reports of hallucinatory experiences. Canadian Journal of Behavioural Science. 10.1037/h0087243. [DOI] [Google Scholar]
- Launay G, Slade P, 1981. The measurement of hallucinatory predisposition in male and female prisoners. Personality and Individual Differences. 10.1016/0191-8869(81)90027-1. [DOI] [Google Scholar]
- Laurens KR, Hobbs MJ, Sunderland M, Green MJ, Mould GL, 2012. Psychotic-like experiences in a community sample of 8000 children aged 9 to 11 years: An item response theory analysis. Psychological Medicine 42 (7), 1495–1506. 10.1017/S0033291711002108. [DOI] [PubMed] [Google Scholar]
- Linscott RJ, Van Os J, 2013. An updated and conservative systematic review and meta-analysis of epidemiological evidence on psychotic experiences in children and adults: On the pathway from proneness to persistence to dimensional expression across mental disorders. Psychological Medicine 43 (6), 1133–1149. 10.1017/S0033291712001626. [DOI] [PubMed] [Google Scholar]
- Loch AA, Chianca C, Alves TM, Freitas EL, Hortêncio L, Andrade JC, et al. , 2017. Poverty, low education, and the expression of psychotic-like experiences in the general population of São Paulo, Brazil. Psychiatry Research. 10.1016/j.psychres.2017.03.052. [DOI] [PubMed] [Google Scholar]
- Mamah D, Owoso A, Mbwayo AW, Mutiso VN, Muriungi SK, Khasakhala LI, et al. , 2013. Classes of psychotic experiences in kenyan children and adolescents. Child Psychiatry and Human Development. 10.1007/s10578-012-0339-5. [DOI] [PMC free article] [PubMed] [Google Scholar]
- McCutcheon A, 2011. Latent Class Analysis. Latent Class Analysis. 10.4135/9781412984713. [DOI] [Google Scholar]
- McGrath JJ, Saha S, Al-Hamzawi A, Alonso J, Bromet EJ, Bruffaerts R, et al. , 2015. Psychotic experiences in the general population: A cross-national analysis based on 31 261 respondents from 18 countries. JAMA Psychiatry. 10.1001/jamapsychiatry.2015.0575. [DOI] [PMC free article] [PubMed] [Google Scholar]
- Nuevo R, Chatterji S, Verdes E, Naidoo N, Arango C, Ayuso-Mateos JL, 2012. The continuum of psychotic symptoms in the general population: A cross-national study. Schizophrenia Bulletin 38 (3), 475–485. 10.1093/schbul/sbq099. [DOI] [PMC free article] [PubMed] [Google Scholar]
- Ochoa S, Haro JM, Torres JV, Pinto-Meza A, Palacín C, Bernal M, et al. , 2008. What is the relative importance of self reported psychotic symptoms in epidemiological studies? Results from the ESEMeD-Catalonia Study. Schizophrenia Research. 10.1016/j.schres.2008.04.010. [DOI] [PubMed] [Google Scholar]
- Ohayon MM, 2000. Prevalence of hallucinations and their pathological associations in the general population. Psychiatry Research. 10.1016/S0165-1781(00)00227-4. [DOI] [PubMed] [Google Scholar]
- Olson PR, Suddeth JA, Peterson PJ, Egelhoff C, 1985. Hallucinations of Widowhood. Journal of the American Geriatrics Society. 10.1111/j.1532-5415.1985.tb04619.x. [DOI] [PubMed] [Google Scholar]
- Pignon B, Peyre H, Szöke A, Geoffroy PA, Rolland B, Jardri R, et al. , 2018. A latent class analysis of psychotic symptoms in the general population. Australian and New Zealand Journal of Psychiatry. 10.1177/0004867417744255. [DOI] [PubMed] [Google Scholar]
- Pionke R, Gidzgier P, Nelson B, Gawęda Ł, 2019. Prevalence, dimensionality and clinical relevance of self-disturbances and psychotic-like experiences in Polish young adults: a latent class analysis approach. International Journal of Methods in Psychiatric Research. 10.1002/mpr.1809. [DOI] [PMC free article] [PubMed] [Google Scholar]
- Preti A, Sisti D, Rocchi MBL, Siddi S, Cella M, Masala C, et al. , 2014. Prevalence and dimensionality of hallucination-like experiences in young adults. Comprehensive Psychiatry 55 (4), 826–836. 10.1016/j.comppsych.2014.01.015. [DOI] [PubMed] [Google Scholar]
- Rees WD, 1971. The Hallucinations of Widowhood. British Medical Journal. 10.1136/bmj.4.5778.37. [DOI] [PMC free article] [PubMed] [Google Scholar]
- Rosseel Y, 2012. Lavaan: An R package for structural equation modeling. Journal of Statistical Software. 10.18637/jss.v048.i02. [DOI] [Google Scholar]
- Schwarz G, 1978. Estimating the Dimension of a Model. The Annals of Statistics. 10.1214/aos/1176344136. [DOI] [Google Scholar]
- Sclove SL, 1987. Application of model-selection criteria to some problems in multivariate analysis. Psychometrika. 10.1007/BF02294360. [DOI] [Google Scholar]
- Serper M, Dill CA, Chang N, Kot T, Elliot J, 2005. Factorial structure of the hallucinatory experience: Continuity of experience in psychotic and normal individuals. Journal of Nervous and Mental Disease. 10.1097/01.nmd.0000158374.54513.a0. [DOI] [PubMed] [Google Scholar]
- Shevlin M, Murphy J, Dorahy MJ, Adamson G, 2007. The distribution of positive psychosis-like symptoms in the population: A latent class analysis of the National Comorbidity Survey. Schizophrenia Research. 10.1016/j.schres.2006.09.014. [DOI] [PubMed] [Google Scholar]
- Siddi S, Ochoa S, Farreny A, Brébion G, Larøi F, Cuevas-Esteban J, et al. , 2018. Measurement invariance of the Spanish Launay-Slade Hallucinations Scale-Extended version between putatively healthy controls and people diagnosed with a mental disorder. International Journal of Methods in Psychiatric Research. 10.1002/mpr.1741. [DOI] [PMC free article] [PubMed] [Google Scholar]
- Siddi S, Ochoa S, Laroi F, Cella M, Raballo A, Saldivia S, et al. , 2019. A Cross-National Investigation of Hallucination-Like Experiences in 10 Countries: The ECLECTIC Study. Schizophrenia Bulletin. 10.1093/schbul/sby156. [DOI] [PMC free article] [PubMed] [Google Scholar]
- Siddi S, Petretto DR, Burrai C, Scanu R, Baita A, Trincas P, et al. , 2017. The role of set-shifting in auditory verbal hallucinations. Comprehensive Psychiatry. 10.1016/j.comppsych.2017.01.011. [DOI] [PubMed] [Google Scholar]
- Simon AE, Cattapan-Ludewig K, Gruber K, Ouertani J, Zimmer A, Roth B, et al. , 2009. Subclinical hallucinations in adolescent outpatients: An outcome study. Schizophrenia Research. 10.1016/j.schres.2008.12.018. [DOI] [PubMed] [Google Scholar]
- Singh SP, Singh V, Kar N, Chan K, 2010. Efficacy of antidepressants in treating the negative symptoms of chronic schizophrenia: Meta-analysis. British Journal of Psychiatry. 10.1192/bjp.bp.109.067710. [DOI] [PubMed] [Google Scholar]
- Smeets F, Lataster T, Dominguez MDG, Hommes J, Lieb R, Wittchen HU, van Os J, 2012a. Evidence that onset of psychosis in the population reflects early hallucinatory experiences that through environmental risks and affective dysregulation become complicated by delusions. Schizophrenia bulletin. 10.1093/schbul/sbq117. [DOI] [PMC free article] [PubMed] [Google Scholar]
- Smeets F, Lataster T, van Winkel R, de Graaf R, ten Have M, van Os J, 2012b. Testing the hypothesis that psychotic illness begins when subthreshold hallucinations combine with delusional ideation. Acta Psychiatrica Scandinavica. 10.1111/j.1600-0447.2012.01888.x. [DOI] [PubMed] [Google Scholar]
- Sommer IE, Daalman K, Rietkerk T, Diederen KM, Bakker S, Wijkstra J, Boks MPM, 2010. Healthy individuals with auditory verbal hallucinations; Who are they? psychiatric assessments of a selected sample of 103 subjects. Schizophrenia Bulletin. 10.1093/schbul/sbn130. [DOI] [PMC free article] [PubMed] [Google Scholar]
- Stefanis NC, Hanssen M, Smirnis NK, Avramopoulos DA, Evdokimidis IK, Stefanis CN, et al. , 2002. Evidence that three dimensions of psychosis have a distribution in the general population. Psychological Medicine. 10.1017/S0033291701005141. [DOI] [PubMed] [Google Scholar]
- Steiger JH, 1990. Some Additional Thoughts on Components, Factors, and Factor Indeterminacy. Multivariate Behavioral Research. 10.1207/s15327906mbr2501_4. [DOI] [PubMed] [Google Scholar]
- Tien AY, 1991. Psychiatric Epidemiology Distributions of hallucinations in the population. Social Psychiatry and Psychiatric Epidemiology. [DOI] [PubMed] [Google Scholar]
- van Os J, Linscott RJ, Myin-Germeys I, Delespaul P, Krabbendam L, 2009. A systematic review and meta-analysis of the psychosis continuum: Evidence for a psychosis proneness-persistence-impairment model of psychotic disorder. Psychological Medicine. 10.1017/S0033291708003814. [DOI] [PubMed] [Google Scholar]
- van Os Jim, Reininghaus U, 2016. Psychosis as a transdiagnostic and extended phenotype in the general population. World Psychiatry 15 (2), 118–124. 10.1002/wps.20310. [DOI] [PMC free article] [PubMed] [Google Scholar]
- Vellante M, Larøi F, Cella M, Raballo A, Petretto DR, Preti A, 2012. Hallucination-like experiences in the nonclinical population. Journal of Nervous and Mental Disease. 10.1097/NMD.0b013e31824cb2ba. [DOI] [PubMed] [Google Scholar]