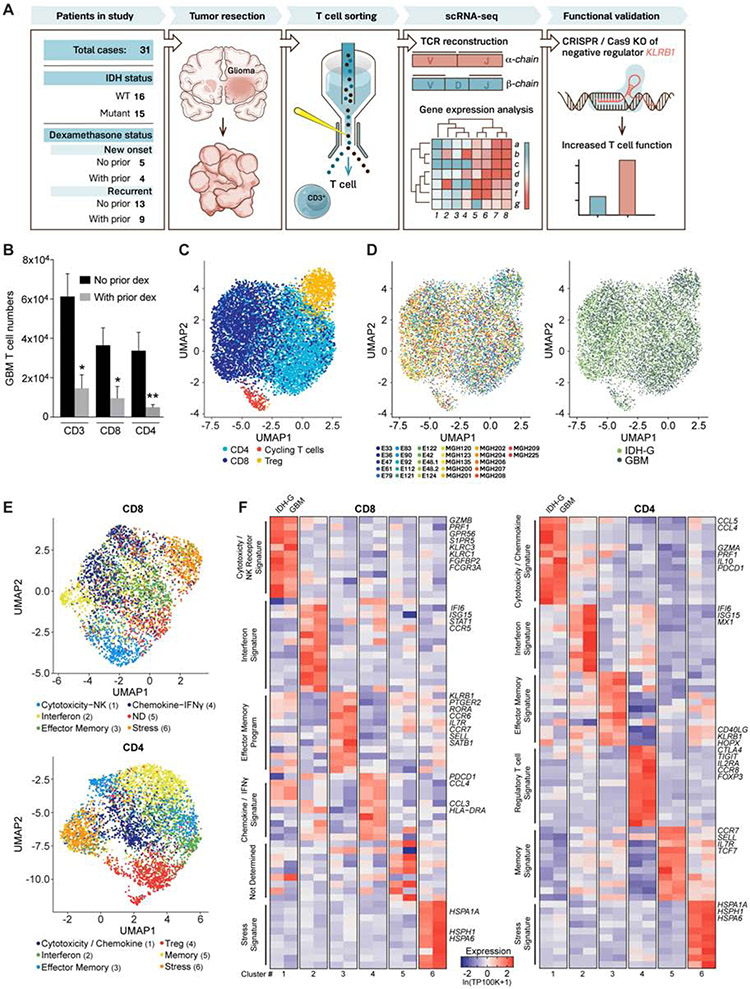
Fig. 1. Transcriptional features of glioma-infiltrating T cells.
(A) Experimental strategy. (B) Quantification of GBM infiltrating T cells from patients who did or did not receive prior dexamethasone. * P < 0.05, ** P < 0.01 (Mann-Whitney U test). Error bars denote SEM. (C) Uniform Manifold Approximation and Projection (UMAP) visualization of 8,252 T cells from 26 glioma patients colored by T cell sub-cluster. (D) UMAP representation from (C) colored based on patient ID (left) and tumor mutational status (right). (E) Sub-clustering and UMAP visualization of CD8 T cells and CD4 T cells, colored based on NMF clustering; ND – not determined. (F) Heat map showing relative expression of selected genes across glioma T cell subsets (clusters numbered at bottom as in E). Gene expression is shown separately for T cells from IDH-G and GBM based on subsets identified using NMF clustering (E). Gene expression is zero-centered and given in units of ln(TP100K+1).

