

Abstract
5‐Fluorouracil (5‐FU) is one of the most frequently used pharmacological agents in the treatment of colorectal cancer (CRC). Resistance to chemotherapy is a major cause of treatment failure of CRC, and it is a well known fact that cancer stem cells play a significant role in the acquisition of drug resistance. In this study, we focused on the KHDRBS3 gene that encodes KH RNA Binding Domain Containing, Signal Transduction Associated 3. We first clarified the relationship between KHDRBS3 and 5‐FU resistance. We then observed higher expression levels of KHDRBS3 in KRAS‐mutant organoids and cell lines in comparison with KRAS wild‐type organoids and cell lines. Immunohistochemical analysis using CRC cases revealed that the prognosis of KHDRBS3‐positive patients was significantly worse compared with that of KHDRBS3‐negative patients. Univariate and multivariate Cox proportional hazards analyses showed that KHDRBS3 was an independent prognostic factor in patients with CRC. We determined that KHDRBS3 might play a crucial role in the acquisition of stem cell properties, such as drug resistance and spheroid/organoid formation, by regulating CD44 variant expression and the Wnt signaling pathway. In an immunodeficient mouse model, KHDRBS3‐positive cells showed efficient tumor formation and formed metastatic lesions in the lungs. These results indicated that KHDRBS3 plays a crucial role in drug resistance and anchorage‐independent growth by maintaining stem cell‐like features in CRC cells. KHDRBS3 could be a promising candidate marker for predicting chemotherapeutic effect and prognosis in CRC patients.
Keywords: 5‐FU, cancer stem cell, colorectal cancer, drug resistance, KHDRBS3
KHDRBS3 plays a crucial role in drug resistance and anchorage‐independent growth by maintaining stem cell‐like features in CRC cells. KHDRBS3 could be a promising candidate marker for predicting chemotherapeutic effect and prognosis in CRC patients.
1. INTRODUCTION
Colorectal cancer (CRC) is the second leading cause of cancer‐related deaths, accounting for approximately 860 000 deaths each year worldwide. 1 Although diagnostic and therapeutic methods have improved, the prognosis of patients with metastasis or recurrence remains poor. 5‐Fluorouracil (5‐FU) is one of the key anti‐cancer drugs known as antimetabolites and remains the mainstay of chemotherapeutic regimens for CRC. Although chemotherapy is often capable of reducing tumor bulk, not all patients show tumor regression, and many experience recurrence after therapy. 2 Therefore, it is crucial to clarify the molecular mechanisms underlying the acquisition of 5‐FU resistance in CRC.
KHDRBS3 (KH RNA Binding Domain Containing, Signal Transduction Associated 3) was initially identified as a novel RNA‐binding protein that interacts with several proteins playing a crucial role in spermatogenesis. 3 KHDRBS3 plays a part in the regulation of alternative splicing and influences mRNA splice site selection to bind preferentially to some specific motif in RNA. In particular, KHDRBS3 is involved in the alternative splicing of CD44 lacking exons 8 and 9 (CD44v). 4 In addition to producing CD44v, KHDRBS3 has been reported to play a significant role in tumor progression, including increasing anoikis resistance in breast cancer and decreasing drug permeability in glioblastoma. 4 , 5 We recently reported the upregulation of KHDRBS3 in patients with 5‐FU‐resistant gastric cancer (GC) and in organoids and its interaction with stem cell markers and multi‐drug resistance associated protein 1 (MRP1). 6 CD44v promoted drug resistance and stemness of cancer cells via increased expression of MRP1. 6 Targeted knockout of KHDRBS3 significantly reduced the expression of CD44v and MRP1. 6 Although the importance of KHDRBS3 in tumor progression has been reported in various organs, no reports have detailed the functional role and clinical significance of KHDRBS3 in CRC.
In the present study, we examined the expression and distribution of KHDRBS3 in CRC immunohistochemically and analyzed the biological function of KHDRBS3, especially focusing on the acquisition of drug resistance and cancer stem cell (CSC)‐like characteristics in CRC cells by forced expression and knockout using the CRISPR‐Cas9 system. Furthermore, we evaluated the tumorigenic capacity of KHDRBS3 through a spheroid forming assay, organoid forming assay, and xenograft mouse model.
2. MATERIAL AND METHODS
2.1. Human tissues
Human CRC tissues were obtained from patients who underwent surgery at the Department of Gastroenterological and Transplant Surgery at Hiroshima University Hospital and the Kure Medical Center and Chugoku Cancer Center. Clinical data of the patient‐derived organoids are summarized in Table S1. Two CRC cohorts were enrolled; Cohort 1 was resected between 2006 and 2010 and Cohort 2 was diagnosed between 2013 and 2016. We investigated the prognosis and history of 5‐FU‐based chemotherapy including TS‐1, Xeloda or combination therapies using Cohort 1, and BRAF/KRAS mutation using Cohort 2. Tumor staging was determined based on the TNM classification system. The histological classifications were determined based on the guidelines of the Japanese Society for Cancer of the Colon and Rectum. Written informed consent for the establishment of the organoids was obtained from all of the patients. This study was approved by the Ethics Committee for Human Genome Research of Hiroshima University, Hiroshima (E‐597‐01) and was conducted in accordance with the Ethical Guidance for Human Genome/Gene Research of the Japanese Government.
2.2. Establishment and culture of human CRC organoids
Human CRC organoids were established and cultured using the previously described “TMDU protocol” and were passaged twice a week with a split ratio of 1:3/1:6. 7
2.3. Cell lines
Ten cell lines derived from human CRC (DLD‐1, Colo‐201, RKO, WiDr, LoVo, HCT‐116, HT‐29, SW‐480, SW‐48 and SW‐837) were purchased from the Japanese Collection of Research Bioresources Cell Bank. All cell lines were maintained as described previously in a humidified atmosphere of 5% CO2 and 95% air at 37°C. 8
2.4. Quantitative reverse transcription‐polymerase chain reaction analysis
Isolation of total RNA was described previously. 9 The primers used are listed in Table S2. Real‐time detection of the emission intensity of SYBR Green bound to double‐stranded DNA was performed with a CFX Connect real‐time system (Bio‐Rad Laboratories). ACTB‐specific PCR products, which were amplified from the same RNA samples, served as internal controls. A single peak on the melting curve analysis was confirmed for each reaction. Relative quantification was determined by the ∆∆Ct method.
2.5. Cell growth assay for the effects of 5‐FU, L‐OHP (oxaliplatin) and FTD (trifluridine) on cell viability
Cell growth was assessed with a standard MTT assay, which detects the dehydrogenase activity in viable cells. In total, 5 × 10³ cells were seeded into each well of 96‐well culture plates. After 24 h, the cells were treated with various concentrations of drugs. After another 72 h, the culture medium was removed, and 50 μL of a 0.5‐mg/mL solution of MTT (Sigma‐Aldrich) were added to each well. The plates were then incubated for 1 h at 37°C. The MTT solution was then removed and replaced with 50 μL of dimethyl sulfoxide (Wako) per well, and the absorbance at 540 nm was measured using an Envision 2104 Multilabel Reader (PerkinElmer, Inc). 5‐FU was purchased from Kyowa Hakko, L‐OHP (oxaliplatin) was purchased from Yakult, and FTD (trifluridine) was purchased from Tokyo Chemical Industry.
2.6. Immunohistochemistry and scoring
Immunohistochemical analysis was performed with a Dako Envision+Mouse/Rabbit Peroxidase Detection System (Dako Cytomation). Antigen retrieval was performed by pressure cooker heating in citrate buffer (pH 6.0) for 5 min. Peroxidase activity was blocked with 3% H2O2‐methanol for 10 min. Sections were incubated with a mouse monoclonal anti‐KHDRBS3 (SLM‐2) F‐3 antibody (1:200; Santa Cruz Biotechnology, Inc) for 1 h at room temperature, followed by incubation with Envision+anti‐mouse peroxidase for 1 h. For color reactions, sections were incubated with DAB Substrate‐Chromogen Solution (Dako Cytomation) for 5 min. Sections were counterstained with 0.1% hematoxylin. Reactions lacking a primary antibody were used as negative controls.
Two surgical pathologists (NS and DT) independently measured the ratio of positivity without knowledge of the clinical and pathological parameters or outcome of the patients. When >50% of tumor cells were stained, immunostaining was considered to be positive for KHDRBS3 in reference to the median value of the positivity. Inter‐observer differences were resolved by consensus review at a double‐headed microscope after independent reviews.
2.7. Western blot
Cells were lysed as described previously. 10 Lysates (40 µg) were subjected to 10% SDS‐PAGE followed by electrotransfer onto nitrocellulose membranes. Anti‐KHDRBS3 (SLM‐2) F‐3 antibody (1:200, Santa Cruz Biotechnology, Inc) was used in the primary reaction, and peroxidase‐conjugated anti‐mouse IgG was used in the secondary reaction. Immunocomplexes were visualized with an ECL Western Blot Detection System (Amersham Biosciences). β‐Actin (AC‐15; Sigma Chemical) was also stained as a loading control.
2.8. Generation of KHDRBS3‐deleted cells
We used a plasmid previously created. 3 The targeting construct and pX459 were transfected into CRC cell lines by lipofection using Fugene6 (Promega). After transfection, cells were released into the drug‐free medium for 48 h followed by puromycin selection until single colonies were formed. Single clones were expanded, and gene‐deletion was confirmed by western blotting. PCR primers and guide RNA sequences are listed in Table S2.
2.9. Spheroid colony formation
The limiting‐dilution method was used to isolate KHDRBS3‐knockout or overexpressed single cells. For the generation of spheres, 2000 cells were plated on a 24‐well ultra‐low attachment plate (Corning). Cells were grown in mTeSR medium (Stemcell Technologies Inc). The plates were incubated at 37°C in a 5% CO2 incubator for 7 d. Sphere number and size were determined and counted under a microscope.
2.10. Xenograft tumor mouse models
In total, 5 × 10⁵ cells with KHDRBS3 knockout/overexpressed or control cells were injected into the mammary gland in 3 NOD/SCID Gamma mice as a group. The mice were sacrificed after 20 d and the tumors were separated and weighed. Tumor volume was calculated using the formula (a × b × b)/2, where a and b are the major and minor tumor axes, respectively. All animal care in our laboratory was in accordance with the guidelines for animal and recombinant DNA experiments of Hiroshima University (Hiroshima, Japan, A20‐46).
2.11. Generation of KHDRBS3‐expressing cells/organoids
We used a plasmid that we had previously created. 3 The coding sequence (CDS) and pDon‐5 Neo were transfected into CRC cell lines by lipofection using Fugene6 (Promega). After transfection, cells were released into the drug‐free medium for 48 h followed by G418 selection until single colonies were formed. Single clones were expanded, and overexpression of KHDRBS3 was confirmed by western blotting. PCR primers and are listed in Table S2.
2.12. Statistical analysis
Statistical differences were evaluated using Student t test or the Mann‐Whitney U test as appropriate. The correlation between expression levels of KHDRBS3 and clinicopathological characteristics was analyzed with Fisher exact test. The results are expressed as the mean ± SD of triplicate measurements. We considered P < .05 to indicate statistical significance.
2.13. Survival analysis using online database
We conducted survival analysis on KHDRBS3 using the online database Oncolnc, which provides The Cancer Genome Atlas (TCGA) survival data to mRNA, miRNA, or lncRNA expression levels. (http://www.oncolnc.org) The patient sample was divided into 2 groups with a cutoff of upper 33%, median, and lower 33%, respectively. Patient numbers in each group and P‐values are shown in the graphs.
3. RESULTS
3.1. Expression of KHDRBS3 is associated with 5‐FU resistance and KRAS mutation in CRC cell lines
To investigate the biological significance of KHDRBS3 in CRC, we first measured the expression of KHDRBS3 protein in 10 CRC cell lines whose genetic features were previously analyzed (https://cancer.sanger.ac.uk/cell_lines; Figure 1A). Determination of the IC50 of 5‐FU in the 10 CRC cell lines revealed that KHDRBS3 expression was significantly associated with the sensitivity to 5‐FU in these lines (Figure 1B). We also observed robust expression of KHDRBS3 in 5/10 (50%) cell lines and, among them, 3 cell lines (60%) showed KRAS mutation (Figure 1A) although there were some exceptions such as DLD‐1 and SW‐480. To further examine the relationship between KHDRBS3 and KRAS mutation, we used organoid culture methods, which could recapitulate several structural and functional aspects of CRC cells. We successfully established 10 CRC organoids whose details including clinicopathological features and mutations are listed in Table S1. The expression levels of KHDRBS3 in these organoids were measured and showed that KHDRBS3 was highly expressed in the KRAS‐mutant organoids (Figure 1C). We performed immunohistochemistry (IHC) using 10 CRCOs and found that 3 of 4 KRAS‐mutant CRCOs showed robust KHDRBS3 expression whereas no BRAF‐mutant CRCOs showed KHDRBS3 expression (Figure S1). There was also a significant positive correlation between KHDRBS3 expression and IC50 values of 5‐FU (Figure S2). These data suggested that KHDRBS3 is associated with inherited 5‐FU resistance in CRC, and that KRAS mutation was preferentially detected in the CRC cells and organoids with high KHDRBS3 expression.
FIGURE 1.
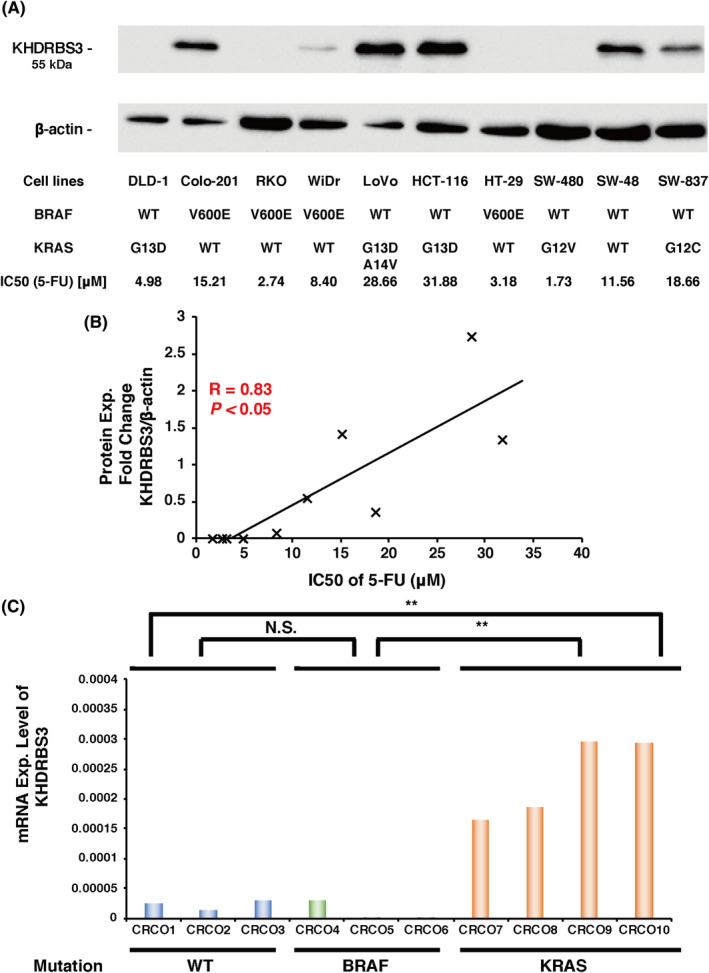
Relationship between the expression level of KHDRBS3 and the IC50 values of 5‐FU. A, Protein expression levels of KHDRBS3 were determined in CRC cell lines. Mutation status of cancer‐critical genes and IC50 values of 5‐FU are also shown. B, Relationship between the expression level of KHDRBS3 and the IC50 values of 5‐FU in 10 CRC cell lines. C, mRNA expression levels of KHDRBS3 in 10 CRC organoids (CRCO). **P < .01 from Student t test. NS: P > .05 from Student t test
3.2. Targeted KHDRBS3 knockout reduced chemoresistance in CRC cell lines
Although previous studies have reported that KHDRBS3 is involved in the splicing of several genes including CD44 in breast cancer and GC, 5 , 6 no papers have detailed the biological function of KHDRBS3 in CRC. We tried to establish KHDRBS3 knockout CRC cell lines. HCT‐116 and LoVo cells were selected as they showed robust KHDRBS3 expression among the 10 CRC cell lines (Figure 1A). Clones were selected in puromycin, and 2 clones of stable KHDRBS3 knockout (KO) CRC cells were isolated. Western blot analysis showed that the expression of KHDRBS3 was undetectable in the KO cells (Figure 2A). We then performed an MTT viability assay and confirmed that both KO cells showed significantly higher chemosensitivity against 5‐FU and FTD, which are 2 representative fluoropyrimidines commonly used in CRC treatment (Figure 2B). Conversely, knockout of KHDRBS3 did not affect resistance to L‐OHP in the CRC cell line. We then performed qRT‐PCR on CD44v using primers connecting exons 7 and 10 and on CD44s using primers connecting exons 5 and 15. We found that compared with the negative control, both KO cells expressed lower levels of CD44v and MRP1, which is a hallmark of the acquisition of multi‐drug resistance (Figure 2C). 3 It is noteworthy that the expression levels of CD44 standard form were not changed (Figure 2C). These results suggested that KHDRBS3 regulates fluoropyrimidine resistance possibly via a KHDRBS3‐CD44v‐MRP1 axis in CRC.
FIGURE 2.
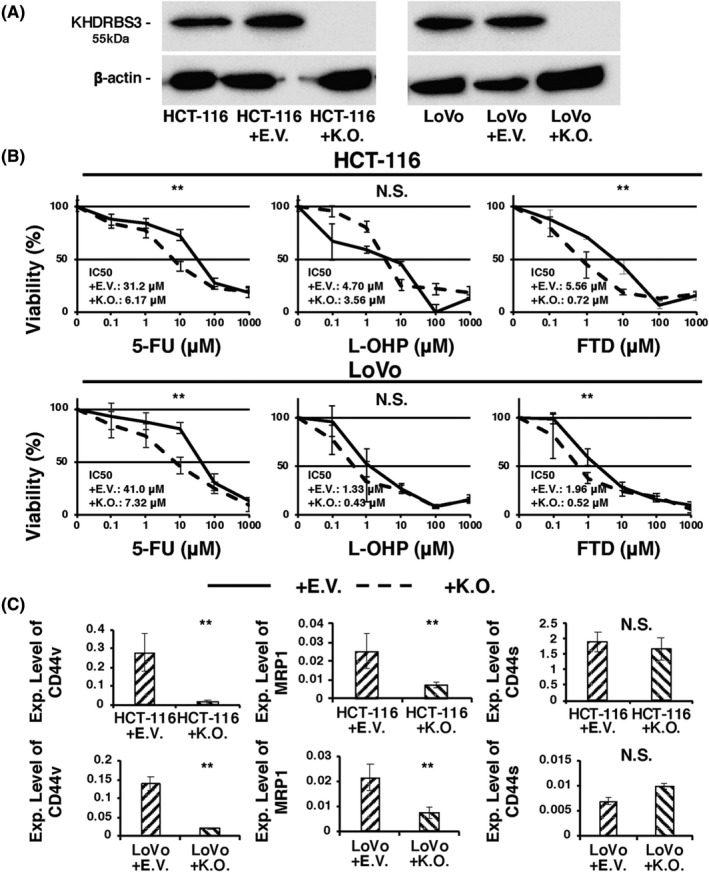
Targeted knockout of KHDRBS3 in CRC cell lines. A, Western blotting analysis confirmed the knockout of KHDRBS3. B, Dose‐response curves of HCT‐116 and LoVo transfected with empty vector (EV) or KHDRBS3‐specific knockout vector (KO) that were treated with 5‐FU, oxaliplatin (L‐OHP) and trifluridine (FTD). Error bars represent SD. **P < .01 from Student t test. NS: P > .05 from Student t test. C, mRNA expression levels of CD44v, MRP1, and CD44s on HCT‐116 and LoVo transfected with EV or KO. Error bars represent SD. **P < .01 from Student t test. NS: P > .05 from Student t test
3.3. Forced expression of KHDRBS3 promoted multi‐drug resistance in CRC cell lines
To further clarify the biological role of KHDRBS3 in CRC, we tried to establish CRC cell lines stably expressing KHDRBS3 (OE). RKO and WiDr cells were selected as they showed low KHDRBS3 expression among the 10 CRC cell lines (Figure 1A). Clones were selected in G418 and examined for KHDRBS3 expression by western blotting. We confirmed the relative overexpression of KHDRBS3 in OE cells (Figure 3A). Two CRC cells overexpressing KHDRBS3 showed significantly lower chemosensitivity against 5‐FU and FTD (Figure 3B). Forced expression of KHDRBS3 also did not affect L‐OHP resistance. All OE cells expressed significantly higher levels of CD44v and MRP1 (Figure 3C). Furthermore, expression levels of CD44 standard form were not changed (Figure 3C). These results were completely opposite to the data obtained from the knockout of KHDRBS3 in CRC cells, which further supported the important role of a KHDRBS3‐CD44v‐MRP1 axis in fluoropyrimidine resistance in CRC.
FIGURE 3.
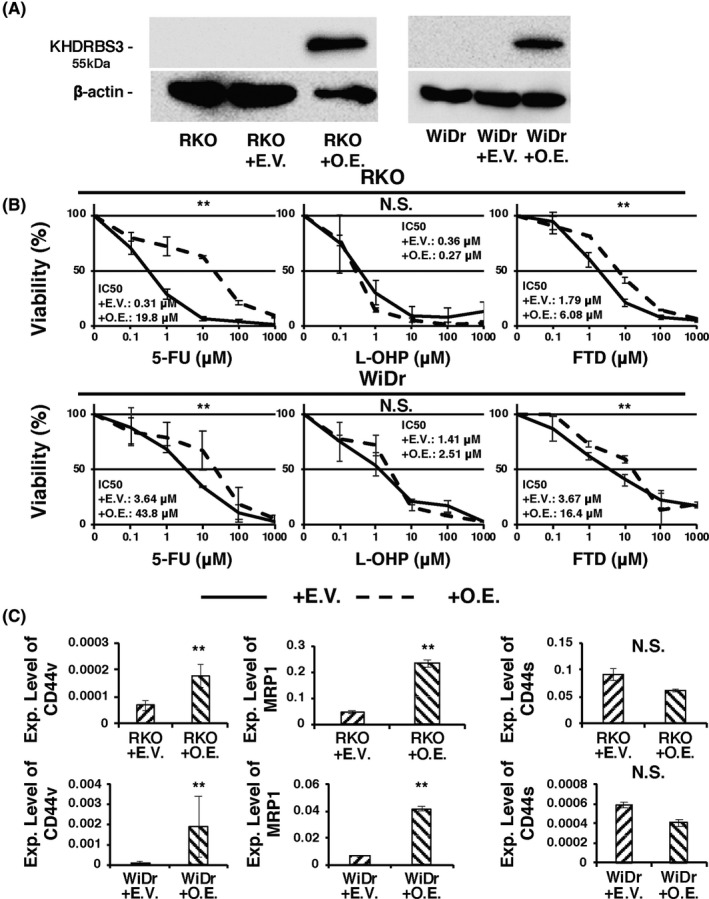
Overexpression of KHDRBS3 in CRC cell lines. A, Western blotting analysis confirmed the overexpression of KHDRBS3. B, Dose‐response curves of RKO and WiDr transfected with empty vector (EV) or KHDRBS3‐specific overexpression vector (OE) that were treated with 5‐FU, oxaliplatin (L‐OHP) and trifluridine (FTD). Error bars represent SD. **P < .01 from Student t test. NS: P > .05 from Student t test. C, mRNA expression levels of CD44v, MRP1, and CD44s on RKO and WiDr transfected with EV or OE. Error bars represent SD. **P < .01 from Student t test. NS: P > .05 from Student t test
3.4. KHDRBS3 was significantly associated with worse clinical outcomes in CRC patients
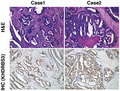
To determine the clinical importance of KHDRBS3 expression in CRC, we examined KHDRBS3 expression in tissue samples by immunohistochemical staining. In non‐neoplastic colorectal mucosa, KHDRBS3 expression was mainly detected in stromal cells such as lymphocytes and fibroblasts as reported in GC, 3 whereas robust nuclear staining of KHDRBS3 was broadly detected in all types of CRC tissues (Figure 4A,B). We determined that the immunostaining was considered positive for KHDRBS3 when more than 50% of tumor cells were stained.
FIGURE 4.
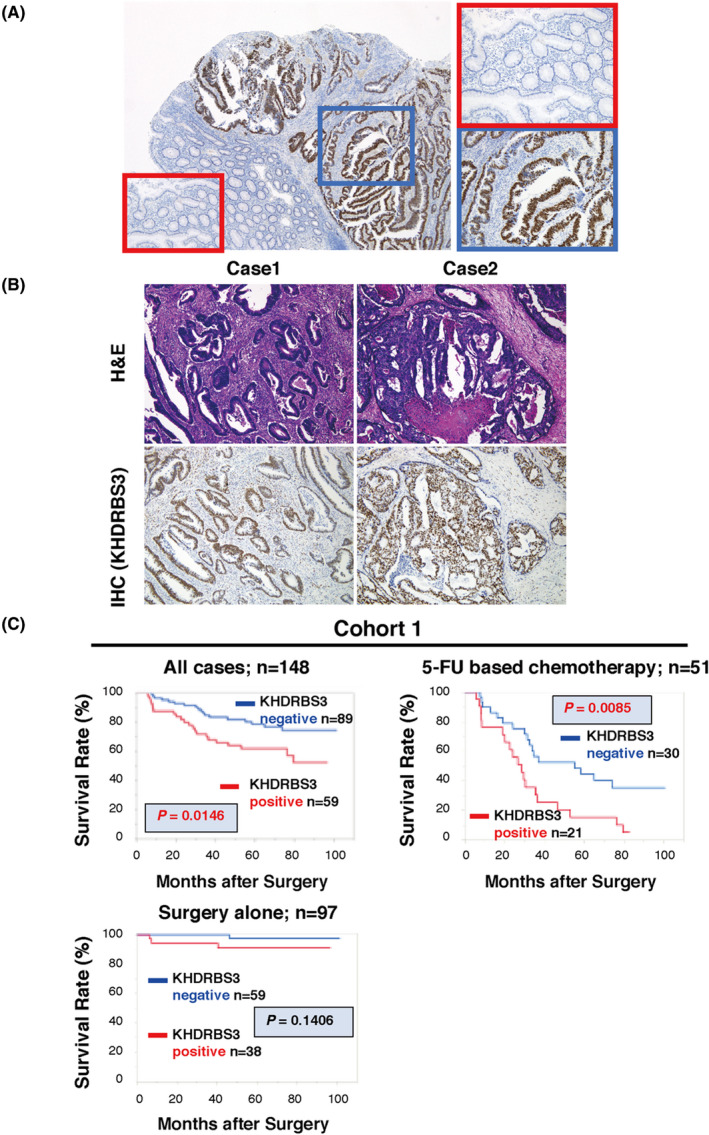
Immunohistochemistry and Kaplan‐Meier curves for KHDRBS3 in human CRC tissues. A, Representative images of immunohistochemical staining of KHDRBS3 in tissue sections from human colorectal carcinoma (original magnification ×40 [left] and ×400 [right]). Red box: non‐tumorous area, blue box: tumorous area. B, Representative images of upper: H&E staining and lower: immunohistochemical staining of KHDRBS3 in well (Case 1: tub1) and moderately differentiated (Case 2: tub2) CRC (original magnification ×100). C, Survival analysis of KHDRBS3 in 148 CRC cases (Cohort 1). The P‐values (log‐rank test) are shown for the survival analysis. P < .05 indicates statistical significance
We next examined the relationship of KHDRBS3 expression to clinicopathological characteristics in 148 cases of CRC using Cohort 1, which has information concerning patient survival (Table 1). Only age was significantly associated with KHDRBS3 positivity, and no other factors showed significance. The relationship between KHDRBS3 expression and survival probability was examined using Cohort 1. The 5‐y overall survival rates were 62% and 78% for KHDRBS3‐positive and ‐negative cases, respectively, and KHDRBS3‐positive CRC cases had significantly lower survival probability than that of KHDRBS3‐negative CRC cases (P = .015; Figure 4C). However, online database examination showed no correlation between high KHDRBS3 expression and worse prognosis of CRC patients (Figure S3). It may be due to the staining of KHDRBS3 in stromal cells, further highlighting that KHDRBS3 expression should be evaluated by IHC to precisely determine the specific KHDRBS3 expression in cancer cells. To further evaluate KHDRBS3 as a prognostic classifier, the association between its expression and cancer‐specific mortality was investigated in univariate and multivariate Cox proportional hazards analyses. In the univariate analysis, T grade, N grade, M grade, TNM stage, lymphatic invasion and KHDRBS3 expression were associated with survival, and in the multivariate analysis, KHDRBS3 expression was found to be an independent prognostic indicator, as were M grade and TNM stage (Table 2). As KHDRBS3 could be associated with 5‐FU resistance, we investigated the association between KHDRBS3 expression and patient survival in the 51 CRC patients who had received 5‐FU‐based chemotherapy (TS‐1, FOLFOX, Xeloda, or Xelox). Kaplan‐Meier analysis also showed significantly worse survival in the KHDRBS3‐positive CRC cases (P = .009; Figure 4C), whereas KHDRBS3‐positive patients without 5‐FU chemotherapy did not show a significantly worse prognosis. (Figure 4C). These data support the potential for KHDRBS3 expression to be a promising biomarker for CRC patients, especially for CRC patients who have received 5‐FU‐based chemotherapy.
TABLE 1.
Relationship between KHDRBS3 expression and clinicopathological characteristics in 275 CRC cases
| Cohort 1 (n = 148) | Cohort 2 (n = 127) | ||||||
|---|---|---|---|---|---|---|---|
| Factor | KHDRBS3 expression | P‐value | Factor | KHDRBS3 expression | P‐value | ||
| Positive | Negative | Positive | Negative | ||||
| Age (y) | Age (y) | ||||||
| ≤65 (n = 69) | 36 | 33 | .0041 | ≤65 (n = 45) | 24 | 21 | .9720 |
| >65 (n = 79) | 23 | 56 | >65 (n = 82) | 44 | 38 | ||
| Sex | Sex | ||||||
| Male (n = 92) | 40 | 52 | .2477 | Male (n = 72) | 41 | 31 | .3792 |
| Female (n = 56) | 19 | 37 | Female (n = 55) | 27 | 28 | ||
| Histologic classification | Histologic classification | ||||||
| Well/Moderate (n = 134) | 55 | 79 | .3552 | Well/Moderate (n = 118) | 66 | 52 | .0464 |
| Mucinous/Poor (n = 14) | 4 | 10 | Mucinous/Poor (n = 9) | 2 | 7 | ||
| T grade | T grade | ||||||
| T1/T2 (n = 50) | 20 | 30 | .9809 | T1/T2 (n = 40) | 21 | 19 | .8730 |
| T3/T4 (n = 98) | 39 | 59 | T3/T4 (n = 87) | 47 | 40 | ||
| N grade | N grade | ||||||
| N0 (n = 70) | 28 | 42 | .9746 | N0 (n = 66) | 40 | 26 | .0964 |
| N1/N2/N3 (n = 78) | 31 | 47 | N1/N2/N3 (n = 61) | 28 | 33 | ||
| M grade | M grade | ||||||
| M0 (n = 118) | 43 | 75 | .0944 | M0 (n = 112) | 60 | 52 | .9861 |
| M1 (n = 30) | 16 | 14 | M1 (n = 15) | 8 | 7 | ||
| Lymphatic invasion | Lymphatic invasion | ||||||
| ly0 (n = 69) | 24 | 45 | .2371 | ly0 (n = 40) | 17 | 23 | .0906 |
| ly1/2/3 (n = 79) | 35 | 44 | ly1/2/3 (n = 87) | 51 | 36 | ||
| Vascular invasion | Vascular invasion | ||||||
| v0 (n = 78) | 28 | 50 | .2980 | v0 (n = 43) | 24 | 19 | .7134 |
| v1/2/3 (n = 70) | 31 | 39 | v1/2/3 (n = 84) | 44 | 40 | ||
| Stage | Stage | ||||||
| 0/I/II (n = 66) | 26 | 40 | .9164 | Stage 0/I/II (n = 64) | 39 | 25 | .0916 |
| III/IV (n = 82) | 33 | 49 | Stage III/IV (n = 63) | 29 | 34 | ||
| BRAF mutation | |||||||
| BRAF mutant (n = 4) | 0 | 4 | .0122 | ||||
| BRAF WT (n = 123) | 68 | 55 | |||||
| KRAS mutation | |||||||
| KRAS‐mutant (n = 58) | 39 | 19 | .0043 | ||||
| KRAS WT (n = 69) | 29 | 40 | |||||
Abbreviations: WT, wild‐type.
TABLE 2.
Univariate and multivariate Cox regression analyses of factors influencing overall survival in 148 cases of colorectal cancer (Cohort 1)
| Factor | Univariate analysis | Multivariate analysis | ||||
|---|---|---|---|---|---|---|
| HR | 95% CI | P‐value | HR | 95% CI | P‐value | |
| Age (y) | ||||||
| ≤65 | 1 (Ref.) | .735 | ||||
| >65 | 1.113 | (0.596‐2.071) | ||||
| Sex | ||||||
| Male | 1 (Ref.) | .265 | ||||
| Female | 0.691 | (0.357‐1.340) | ||||
| Histologic classification | ||||||
| Well/Moderate | 1 (Ref.) | .516 | ||||
| Mucinous/Poor | 1.433 | (0.509‐4.034) | ||||
| T grade | ||||||
| T0/1/T2 | 1 (Ref.) | <.001 | 1 (Ref.) | .505 | ||
| T3/T4 | 7.136 | (2.199‐23.161) | 1.548 | (0.408‐5.876) | ||
| N grade | ||||||
| N0 | 1 (Ref.) | <.001 | 1 (Ref.) | .239 | ||
| N1/N2/N3 | 6.384 | (2.677‐15.229) | 0.418 | (0.108‐1.615) | ||
| M grade | ||||||
| M0 | 1 (Ref.) | <.001 | 1 (Ref.) | <.001 | ||
| M1 | 13.646 | (6.939‐26.834) | 5.571 | (2.606‐11.91) | ||
| Lymphatic invasion | ||||||
| ly0 | 1 (Ref.) | <.001 | 1 (Ref.) | .151 | ||
| ly1/2/3 | 3.499 | (1.708‐7.167) | 1.766 | (0.408‐3.958) | ||
| Vascular invasion | ||||||
| v0 | 1 (Ref.) | .059 | ||||
| v1/2/3 | 1.834 | (0.967‐3.480) | ||||
| Stage | ||||||
| 0/I/II | 1 (Ref.) | <.001 | 1 (Ref.) | .017 | ||
| III/IV | 13.331 | (4.103‐43.309) | 10.447 | (1.656‐65.92) | ||
| KHDRBS3 expression | ||||||
| Negative | 1 (Ref.) | .017 | 1 (Ref.) | .049 | ||
| Positive | 2.136 | (1.144‐3.986) | 1.899 | (1.002‐3.596) | ||
In addition, we examined the correlation between KHDRBS3 expression and KRAS mutations in 127 cases of CRC using Cohort 2 that has information concerning KRAS and BRAF mutation status. Although tumor differentiation correlated significantly with KHDRBS3 positivity, KRAS mutation occurred in 58 (46%) of the 127 cases of CRC and that the KHDRBS3‐positive cases had significantly more KRAS mutations (Table 1). These data supported the in vitro results of the organoids showing that high KHDRBS3 expression is associated with KRAS mutation (Figure 1C).
3.5. KHDRBS3 promotes in vitro and in vivo tumorigenesis through the regulation of Wnt target genes
To further elucidate the molecular significance of KHDRBS3 in terms of stemness, we measured the expression levels of Wnt target genes (AXIN2, c‐MYC and LGR5) in CRC cell lines with knockout or overexpression of KHDRBS3. As a result, the expression levels of AXIN2, c‐MYC and LGR5 were decreased in cell lines lacking KHDRBS3 (HCT‐116+KO and LoVo+KO) and increased in cell lines overexpressing KHDRBS3 (RKO+OE and WiDr+OE; Figure 5A‐C).
FIGURE 5.
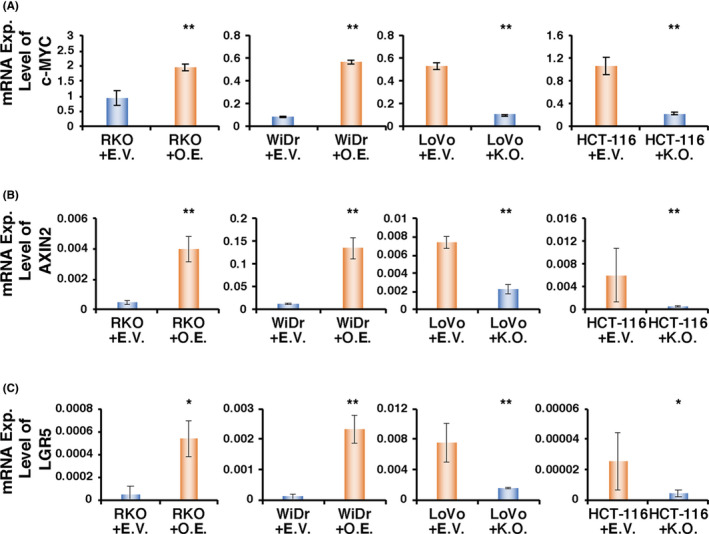
KHDRBS3 enhances the expression of Wnt target genes. A‐C, mRNA expression levels of (A) c‐MYC, (B) AXIN2 and (C) LGR5 on RKO and WiDr transfected with EV or OE and LoVo and HCT‐116 transfected with EV or KO. Error bars represent SD. *P < .05 from Student t test. **P < .01 from Student t test
To investigate the influence of KHDRBS3 in in vitro tumorigenesis, the effects of KHDRBS3 knockout and overexpression on sphere number and size were measured to determine whether the single cells that are positive for KHDRBS3 reform spheres. By spheroid assay, after picking single clones, the number and size of the spheres were found to be significantly reduced in the KHDRBS3 knockout cells (Figure 6A‐C) and increased in the KHDRBS3 overexpressing cells (Figure 6D‐F).
FIGURE 6.
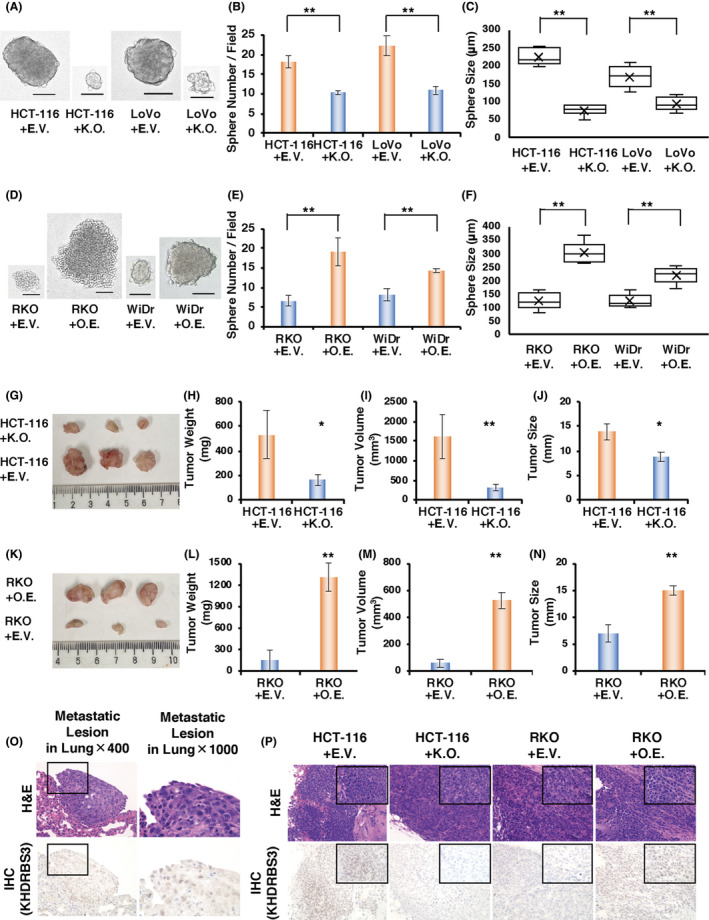
KHDRBS3 promotes anchorage‐independent growth and in vivo tumor formation. A, Representative images of spheroids derived from HCT‐116 and LoVo cells transfected with EV or KO. Scale bar: 100μm. B, C, Quantification of spheroid formation (B) and diameter of spheroids (C) from the experiment described in (A). Error bars represent SD. **P < .01 from Student t test. D, Representative images of spheroids derived from RKO and WiDr cells transfected with EV or OE. Scale bar: 100 μm. E, F, Quantification of spheroid formation (E) and diameter of spheroids (F) from the experiment described in (D). Error bars represent SD. **P < .01 from Student t test. G‐J (G) Pictures, (H) weight, (I) volume and (J) size of tumors from mice injected with HCT‐116 transfected with EV or KO. Error bars represent SD. *P < .05 from Student t test. **P < .01 from Student t test. K‐N (K) Pictures, (L) weight, (M) volume and (N) size of tumors from mice injected with RKO transfected with EV or OE. Error bars represent SD. *P < .05 from Student t test. **P < .01 from Student t test. O, Representative histological images of metastatic lesions in the lung. Upper: H&E staining, lower: IHC for KHDRBS3 (original magnification left: ×400, right: ×1000). P, Representative histological sections of xenografts derived from HCT‐116 transfected with EV or KO and RKO transfected with EV or OE. upper: H&E staining, lower: IHC for KHDRBS3 (original magnification big square: ×400 small square in the upper right: ×1000)
To evaluate the impact of KHDRBS3 on tumorigenesis in vivo, RKO+OE and HCT‐116+KO and their controls (RKO+empty vector (EV) and HCT‐116+EV) were injected into the mammary glands of NOD/SCID gamma mice. Consistent with the data obtained from the in vitro study, knockout of KHDRBS3 inhibited the growth of tumors and significantly decreased the tumor weight in the xenograft models (Figure 6G‐J) and vice versa (Figure 6K‐N). Interestingly, KHDRBS3‐expressing cells displayed metastatic lesions in the lung, but KHDRBS3 knockout cells did not bear any metastases (Figure 6O). The expression or absence of KHDRBS3 in the tumors was confirmed by immunostaining (Figure 6P). These results strongly suggested that KHDRBS3 plays an important role in CRC tumorigenesis.
4. DISCUSSION
The present study showed the clinicopathological significance of KHDRBS3 expression in CRC and provided evidence that KHDRBS3 plays a pivotal role in acquiring essential characteristics of colorectal CSCs, especially in terms of multi‐drug resistance and anchorage‐independent proliferation. Although the molecular functions of KHDRBS3 have been reported in various tumors, 3 , 5 , 6 our results showed the biological and clinical significance of KHDRBS3 in CRC, which has not been reported to date, to our knowledge. CRCs have accumulated defects in oncogenes and tumor suppressor genes. 11 , 12 , 13 Aberrant activation of the Wnt/β‐catenin and RAS‐ERK pathways, due to somatic mutations in APC and KRAS, plays important roles in the tumorigenesis of conventional CRC, 14 , 15 which roughly accounts for 80% of all cases of CRC. KRAS and BRAF oncogenic mutations are seen in roughly 40% and 10% of CRCs, respectively, and are mutually exclusive in a given CRC. 16 In the present study, we revealed that high KHDRBS3 expression was preferentially detected in KRAS‐mutant CRC cell lines and CRC cases, indicating that the subsequent KHDRBS3‐CD44v‐MRP1 axis mainly contributes to the reinforcement of CSC‐like features in conventional CRCs. Our work presented here could potentially provide an impetus for solving the unclear points concerning the biological mechanism in conventional CRCs.
It is well known that activation of the Wnt/β‐catenin pathway is responsible for the production of CSCs and also for enhanced drug resistance by evading apoptosis in CRC. 17 , 18 , 19 In the present study, the high expression of KHDRBS3 significantly upregulated the expression of Wnt/β‐catenin pathway‐related genes (AXIN2, c‐MYC, LGR5). With regards to the significant upregulation of AXIN2 by KHDRBS3 overexpression, KHDRBS3 is more likely to have an effect on some of the points relatively upstream of the Wnt signaling pathway. One challenge in elucidating this issue is that the functional role of KHDRBS3 remains unclear; there is no solid evidence of a key regulator or direct target of KHDRBS3. Although high KHDRBS3 expression was preferentially detected in KRAS‐mutant CRC cell lines, organoids, and cases, it is still unclear whether KRAS mutation and its down‐stream pathway are involved in the regulation of KHDRBS3 expression. However, it is an undoubted fact that KHDRBS3 expression was present significantly in KRAS‐mutant CRCs, some of the other factors that contribute to the pathogenesis of KRAS‐mutant CRC could probably contribute to induce KHDRBS3 expression. Further extensive studies, perhaps using a proteome analysis, are likely to be needed to enhance our comprehension of the mechanism involved in the regulation of KHDRBS3 and its target, which could possibly disclose the basic mechanisms through which KHDRBS3 contributes to the progression of CRC.
Concerning the clinical significance of KHDRBS3 as a biomarker in CRC, we found that KHDRBS3 detected by immunohistochemistry is an independent prognostic indicator of CRC patients. Although no significant correlations between KHDRBS3 expression and clinicopathological factors such as TNM grades were found in either Cohort 1 or 2, univariate and multivariate analyses revealed that KHDRBS3 was an independent prognostic classifier in the patients with CRC. Our previous study on KHDRBS3 expression in GC also showed that KHDRBS3 expression was an independent prognostic indicator in all of the patients with GC and in the patients with GC who were treated with 5‐FU‐based chemotherapy whereas there were no significant correlations between KHDRBS3 expression and clinicopathological factors. 3 Based on these results, KHDRBS3 does not seem to be involved in the process of cancer progression, such as tumor invasion and metastasis, but it does have an effect on the prognosis of patients with gastrointestinal cancer via the attainment of multi‐drug resistance especially against 5‐FU and FTD. However, one of the results that piqued our interest is that deregulation of KHDRBS3 expression never affected the sensitivity and resistance against L‐OHP in CRC, indicating that L‐OHP‐based chemotherapy could be a favorable option for KHDRBS3‐positive CRC cases. Although there have been many uncertainties concerning the mechanism how KHDRBS3‐CD44v‐MRP1 axis selectively contributes to the attainment of multi‐drug resistance against 5‐FU and FTD, our findings could potentially provide valuable information on a therapeutic option for CRC patients, which could be a quite important process in the establishment of personalized medicine in CRC treatment.
Although we have consistently argued that KHDRBS3 is likely to play a significant role in CSC considering the results of our in vitro and in vivo studies, one of the issues is that the proportion of KHDRBS3‐positive cells in CRC tissues was c. 50%. As CSC is characterized as a minority population (<5%) of cells, 20 this result implies that KHDRBS3 does not qualify as a specific marker for CRC stem cells but is probably capable of strengthening the function of CSCs. One of the most noteworthy phenomena in the in vivo experiments was the enhanced metastatic capacity caused by KHDRBS3 overexpression; however, there is an evident discrepancy because high KHDRBS3 expression is not associated with M grade in human tissues. To further determine the roles of KHDRBS3 in metastasis, more detailed investigations that dissect the several steps of the metastatic cascade (migration, intravasation, seeding and outgrowth) are needed.
In conclusion, we reported the clinical significance of KHDRBS3 in CRC and especially its preferential expression in KRAS‐mutant cases and usefulness as a predictive marker for survival of CRC patients. We also revealed that KHDRBS3 enhanced CSC‐like features, such as multi‐drug resistance and anchorage‐independent proliferation, via a KHDRBS3‐CD44v‐MRP1 axis. Our study provided a promising candidate as a predictive marker for CRC patients and could potentially highlight clues leading to the mechanism underlying the acquisition of CSC‐like features in conventional CRC.
DISCLOSURE
The authors have no conflicts of interest.
Supporting information
Fig S1
Fig S2
Fig S3
Table S1‐S2
ACKNOWLEDGMENTS
We thank Shinichi Norimura (Technical Center, Hiroshima University) for his excellent technical assistance. This research was carried out with the kind cooperation of the Research Center for Molecular Medicine of the Faculty of Medicine of Hiroshima University. We also thank the Analysis Center of Life Science of Hiroshima University for the use of their facilities. The R‐spondin‐producing cell line was a kind gift from Professor Jeffery Whitsett (Cincinnati Children's Hospital Medical Center, Cincinnati, OH, USA). We would like to thank Professor Eric Fearon (University of Michigan, Ann Arbor, MI, USA) for providing collaborative research resources and comments. The present study was supported by Grants‐in‐Aid for Scientific Research (JP18K07017, JP18J11110, JP19H03443) from the Japan Society for the Promotion of Science.
Ukai S, Sakamoto N, Taniyama D, et al. KHDRBS3 promotes multi‐drug resistance and anchorage‐independent growth in colorectal cancer. Cancer Sci. 2021;112:1196–1208. 10.1111/cas.14805
REFERENCES
- 1. Bray F, Ferlay J, Soerjomataram I, Siegel RL, Torre LA, Jemal A. Global cancer statistics 2018: GLOBOCAN estimates of incidence and mortality worldwide for 36 cancers in 185 countries. CA Cancer J Clin. 2018;68(6):394‐424. 10.3322/caac.21492 [DOI] [PubMed] [Google Scholar]
- 2. Tomasello G, Petrelli F, Ghidini M, Russo A, Passalacqua R, Barni S. FOLFOXIRI plus bevacizumab as conversion therapy for patients with initially unresectable metastatic colorectal cancer: a systematic review and pooled analysis. JAMA Oncol. 2017;3(7):e170278. 10.1001/jamaoncol.2017.0278 [DOI] [PMC free article] [PubMed] [Google Scholar]
- 3. Venables JP, Vernet C, Chew SL, et al. T‐STAR/ÉTOILE: a novel relative of SAM68 that interacts with an RNA‐binding protein implicated in spermatogenesis. Hum Mol Genet. 1999;8(6):959‐969. 10.1093/hmg/8.6.959 [DOI] [PubMed] [Google Scholar]
- 4. Matsumoto Y, Itou J, Sato F, Toi M. SALL4 ‐ KHDRBS3 network enhances stemness by modulating CD44 splicing in basal‐like breast cancer. Cancer Med. 2018;7(2):454‐462. 10.1002/cam4.1296 [DOI] [PMC free article] [PubMed] [Google Scholar]
- 5. Wu P, Gao Y, Shen S, et al. KHDRBS3 regulates the permeability of blood–tumor barrier via cDENND4C/miR‐577 axis. Cell Death Dis. 2019;10(7):1‐15. 10.1038/s41419-019-1771-2 [DOI] [PMC free article] [PubMed] [Google Scholar]
- 6. Ukai S, Honma R, Sakamoto N, et al. Molecular biological analysis of 5‐FU‐resistant gastric cancer organoids; KHDRBS3 contributes to the attainment of features of cancer stem cell. Oncogene. 2020;39(50):7265–7278. 10.1038/s41388-020-01492-9. Online ahead of print [DOI] [PubMed] [Google Scholar]
- 7. Yui S, Nakamura T, Sato T, et al. Functional engraftment of colon epithelium expanded in vitro from a single adult Lgr5+ stem cell. Nat Med. 2012;18(4):618‐623. 10.1038/nm.2695 [DOI] [PubMed] [Google Scholar]
- 8. Hattori T, Sentani K, Naohide O, Sakamoto N, Yasui W. Clinicopathological significance of SPC18 in colorectal cancer: SPC18 participates in tumor progression. Cancer Sci. 2017;108(1):143‐150. 10.1111/cas.13121 [DOI] [PMC free article] [PubMed] [Google Scholar]
- 9. Honma R, Goto K, Sakamoto N, et al. Expression and function of Uc.160+, a transcribed ultraconserved region, in gastric cancer. Gastric Cancer. 2017;20(6):960‐969. 10.1007/s10120-017-0714-9 [DOI] [PubMed] [Google Scholar]
- 10. Sakamoto N, Naito Y, Oue N, et al. MicroRNA‐148a is downregulated in gastric cancer, targets MMP7, and indicates tumor invasiveness and poor prognosis. Cancer Sci. 2014;105(2):236‐243. 10.1111/cas.12330 [DOI] [PMC free article] [PubMed] [Google Scholar]
- 11. Fearon ER, Vogelstein B. A genetic model for colorectal tumorigenesis. Cell. 1990;61(5):759‐767. 10.1016/0092-8674(90)90186-I [DOI] [PubMed] [Google Scholar]
- 12. Fearon ER, Jones PA. Progressing toward a molecular description of colorectal cancer development. FASEB J. 1992;6(10):2783‐2790. 10.1096/fasebj.6.10.1321771 [DOI] [PubMed] [Google Scholar]
- 13. Fearon ER. Human cancer syndromes: clues to the origin and nature of cancer. Science. 1997;278(5340):1043‐1050. 10.1126/science.278.5340.1043 [DOI] [PubMed] [Google Scholar]
- 14. Fearon ER. Molecular genetics of colorectal cancer. Annu Rev Pathol. 2011;6(1):479‐507. 10.1146/annurev-pathol-011110-130235 [DOI] [PubMed] [Google Scholar]
- 15. Jeong W‐J, Ro EJ, Choi K‐Y. Interaction between Wnt/β‐catenin and RAS‐ERK pathways and an anti‐cancer strategy via degradations of β‐catenin and RAS by targeting the Wnt/β‐catenin pathway. NPJ Precis Oncol. 2018;2(1):1‐10. 10.1038/s41698-018-0049-y [DOI] [PMC free article] [PubMed] [Google Scholar]
- 16. Network CGA. Comprehensive molecular characterization of human colon and rectal cancer. Nature. 2012;487(7407):330‐337. 10.1038/nature11252 [DOI] [PMC free article] [PubMed] [Google Scholar]
- 17. Emons G, Spitzner M, Reineke S, et al. Chemoradiotherapy resistance in colorectal cancer cells is mediated by Wnt/β‐catenin signaling. Mol Cancer Res. 2017;15(11):1481‐1490. 10.1158/1541-7786.MCR-17-0205 [DOI] [PMC free article] [PubMed] [Google Scholar]
- 18. Pothuraju R, Rachagani S, Krishn SR, et al. Molecular implications of MUC5AC‐CD44 axis in colorectal cancer progression and chemoresistance. Mol Cancer. 2020;19(1):37. 10.1186/s12943-020-01156-y [DOI] [PMC free article] [PubMed] [Google Scholar]
- 19. Krausova M, Korinek V. Wnt signaling in adult intestinal stem cells and cancer. Cell Signal. 2014;26(3):570‐579. 10.1016/j.cellsig.2013.11.032 [DOI] [PubMed] [Google Scholar]
- 20. Al‐Hajj M, Wicha MS, Benito‐Hernandez A, Morrison SJ, Clarke MF. Prospective identification of tumorigenic breast cancer cells. Proc Natl Acad Sci USA. 2003;100(7):3983‐3988. 10.1073/pnas.0530291100 [DOI] [PMC free article] [PubMed] [Google Scholar]
Associated Data
This section collects any data citations, data availability statements, or supplementary materials included in this article.
Supplementary Materials
Fig S1
Fig S2
Fig S3
Table S1‐S2