Abstract
Mammalian glycogen chain lengths are subject to complex regulation, including by seven proteins (protein phosphatase-1 regulatory subunit 3, PPP1R3A through PPP1R3G) that target protein phosphatase-1 (PP1) to glycogen to activate the glycogen chain-elongating enzyme glycogen synthase and inactivate the chain-shortening glycogen phosphorylase. Lafora disease is a fatal neurodegenerative epilepsy caused by aggregates of long-chained, and as a result insoluble, glycogen, termed Lafora bodies (LBs). We previously eliminated PPP1R3C from a Lafora disease mouse model and studied the effect on LB formation. In the present work, we eliminate and study the effect of absent PPP1R3D. In the interim, brain cell type levels of all PPP1R3 genes have been published, and brain cell type localization of LBs clarified. Integrating these data we find that PPP1R3C is the major isoform in most tissues including brain. In the brain, PPP1R3C is expressed at 15-fold higher levels than PPP1R3D in astrocytes, the cell type where most LBs form. PPP1R3C deficiency eliminates ~90% of brain LBs. PPP1R3D is quantitatively a minor isoform, but possesses unique MAPK, CaMK2 and 14-3-3 binding domains and appears to have an important functional niche in murine neurons and cardiomyocytes. In neurons, it is expressed equally to PPP1R3C, and its deficiency eliminates ~50% of neuronal LBs. In heart, it is expressed at 25% of PPP1R3C where its deficiency eliminates ~90% of LBs. This work studies the role of a second (PPP1R3D) of seven PP1 subunits that regulate the structure of glycogen, toward better understanding of brain glycogen metabolism generally, and in Lafora disease.
Keywords: glycogen, glycogen synthase, glycogen targeting subunit, Lafora, laforin, PPP1R3D
1 |. INTRODUCTION
Lafora disease (LD) is an autosomal recessive, teenage-onset neurodegenerative disease with progressively intractable epilepsy until death in status epilepticus within 10 years. Underlying the disease is progressive formation and precipitation of glycogen molecules with excess phosphorylation and overlong branches. These insoluble molecules aggregate as polyglucosan bodies named Lafora bodies (LBs), which accumulate in multiple organs over time. In the brain, LBs accumulate in processes and cell bodies of astrocytes and neurons. LD is caused by mutations in the EPM2A gene encoding the glycogen phosphatase, laforin, or the EPM2B gene encoding the laforin-interacting ubiquitin E3 ligase, malin (Nitschke, Ahonen, Nitschke, Mitra, & Minassian, 2018). The insolubility of polyglucosans is because of their long branches similar to amylopectin, the insoluble glucose storage macromolecule of plants, where adjacent chains form double helices that extrude water, causing precipitation. A very small fraction of glycogen in LD transforms to abnormal polyglucosan at any one time, but because the latter precipitates and is no longer subject to metabolism, it progressively accumulates, initially being scarce but over time to manifold exceed the amount of normal glycogen (Sullivan, Nitschke, Steup, Minassian, & Nitschke, 2017; Tagliabracci et al., 2008). Multiple therapeutic approaches are beginning to show promise in treating LD. These include downregulating glycogen synthase (GYS) activity (discussed below), targeting LBs for digestion with amylase via a cell-penetrating antibody, targeting leptin receptor signaling and several pharmacological approaches (Berthier et al., 2016; Brewer et al., 2019; Rai, Mishra, & Ganesh, 2017; Sánchez-Elexpuru, Serratosa, & Sánchez, 2017).
The laforin-malin complex regulates glycogen chain lengths, though precisely how remains unknown. Irrespective, the enzyme that catalyzes the extension of glycogen chains is glycogen synthase (GYS), and it was shown that reduction of GYS activity in LD mouse models by 50% or greater drastically reduces polyglucosan and LB formation and rescues LD. In these experiments, GYS down-regulation was achieved by heterozygous or complete knockout of the brain-expressed GYS isoform gene Gys1, or by knockout of the Ppp1r3c gene (Duran, Gruart, Garcia-Rocha, Delgado-Garcia, & Guinovart, 2014; Pederson et al., 2013; Turnbull et al., 2011). Protein phosphatase-1 regulatory subunit 3 (PPP1R3C) is a member of a family of seven proteins (PPP1R3A through PPP1R3G) with a shared function of serving individually as subunits of the pleiotropic phosphatase protein phosphatase-1 (PP1) that target the phosphatase to glycogen, where it dephosphorylates and activates GYS and dephosphorylates and inactivates the glycogen degrading enzyme glycogen phosphorylase (GP) (Armstrong, Browne, Cohen, & Cohen, 1997; Munro, Ceulemans, Bollen, Diplexcito, & Cohen, 2005). PPP1R3A and PPP1R3B are the murine muscle and liver isoforms respectively (although in humans the latter is also expressed in muscle; see Table 1). At the time of launching the present work, the remaining isoforms were considered ubiquitously expressed with little to no information available on absolute or relative levels of expression including across species and across or within organs. Having studied the effect of absence of PPP1R3C (also known as PTG and R5), in this work we examined the effect of absence of the next member of the family, namely PPP1R3D (also known as R6). Meanwhile, the relative expression distributions of the seven isoforms in mouse and human, and between organs, were determined (Table 1) as part of genome-wide transcriptome studies (Barbosa-Morais et al., 2012; Consortium & G. T, 2015), which crucially inform our analyses.
TABLE 1.
Transcript levels of protein phosphatase-1 (PP1) targeting subunits in transcripts per million (TPM) from mouse, with human levels in parentheses (Consortium 2015; Barbosa-Morais et al., 2012)
| Gene | Brain | Heart | Liver | Skeletal Muscle |
|---|---|---|---|---|
| Ppp1r3a | 21 (16) | 15 (31) | ||
| Ppp1r3b | 0.8 (1) | 14 (19) | 75 (44) | 1(43) |
| Ppp1r3c | 10 (39) | 35 (55) | 16 (86) | 156 (144) |
| Ppp1r3d | 3 (4) | 9 (4) | −0.7 | 0.8 (5) |
| Ppp1r3e | 5 (23) | 1 (4) | 2 (8) | 1 (11) |
| Ppp1r3f | 2 (39) | −9 | −2 | −16 |
| Ppp1r3g | 4 (3) | −4 | −1 | −0.3 |
Note: Empty boxes indicate transcript level below cutoff threshold.
2 |. MATERIALS AND METHODS
2.1 |. Ethics
All mouse procedures were conducted at The Toronto Centre for Phenogenomics and approved by the Animal Care Committee (animal use protocol number 17–0044H).
2.2 |. Mice
This study was not pre-registered. A timeline of experiments conducted is depicted in Figure 1, along with number of mice used per group for this study. Laforin knockout (LKO) and R5 knockout mice were kind gifts from AV Delgado-Escueta (Ganesh et al., 2002) and A DePaoli-Roach respectively (Turnbull et al., 2011). The R6 knockout (R6KO) mouse line was created using embryonic stem cell clone 11161A-E11 (Regeneron Pharmaceuticals Inc.) from the KOMP repository. The Velocigene targeting vector consisting of the ZEN-Ub1 cassette encoding a lacZ promoter and neomycin selection gene (Valenzuela et al., 2003) was inserted into the single exon of Ppp1r3d replacing the entire coding sequence of the gene (Figure 2). Embryonic stem cells harboring the deletion were injected into C57BL/6N blastocysts and implanted into pseudopregnant CD1 mice. Heterozygous chimeras were bred to generate the R6KO mice. Single knockout mice were crossed together to generate heterozygous double knockouts, which were crossed together to obtain homozygous double knockout and control animals. Genetic backgrounds of the single knockout mice prior to intercrossings were as follows: R6KO on C57BL/6NTac, LKO on C57BL6/129S and R5KO on 129P2/OlaHsd X C57BL/6J. No randomization of mice occurred as mice are grouped based on genotype. Mouse genomic DNA was extracted from tissue (ear clippings) and genotyping done using PCR (for genotyping primers see Table 2). To confirm the deletion of the complete ORF in R6KO as shown in Figure 2 the following primers were used: Ppp1r3d-F: CAAGCCCTAAAGCCTAGTGG, Ppp1r3d-wtR: AGCGTCGTTGGATGATGG, Ppp1r3d-koR: GACAGTATCGGCCTCAGGAA. Ppp1r3dF/Ppp1r3d-wtR give a 203 bp amplicon in WT only. Ppp1r3dF/Ppp1r3d-koR give a 302 bp amplicon in R6KO only.
FIGURE 1.
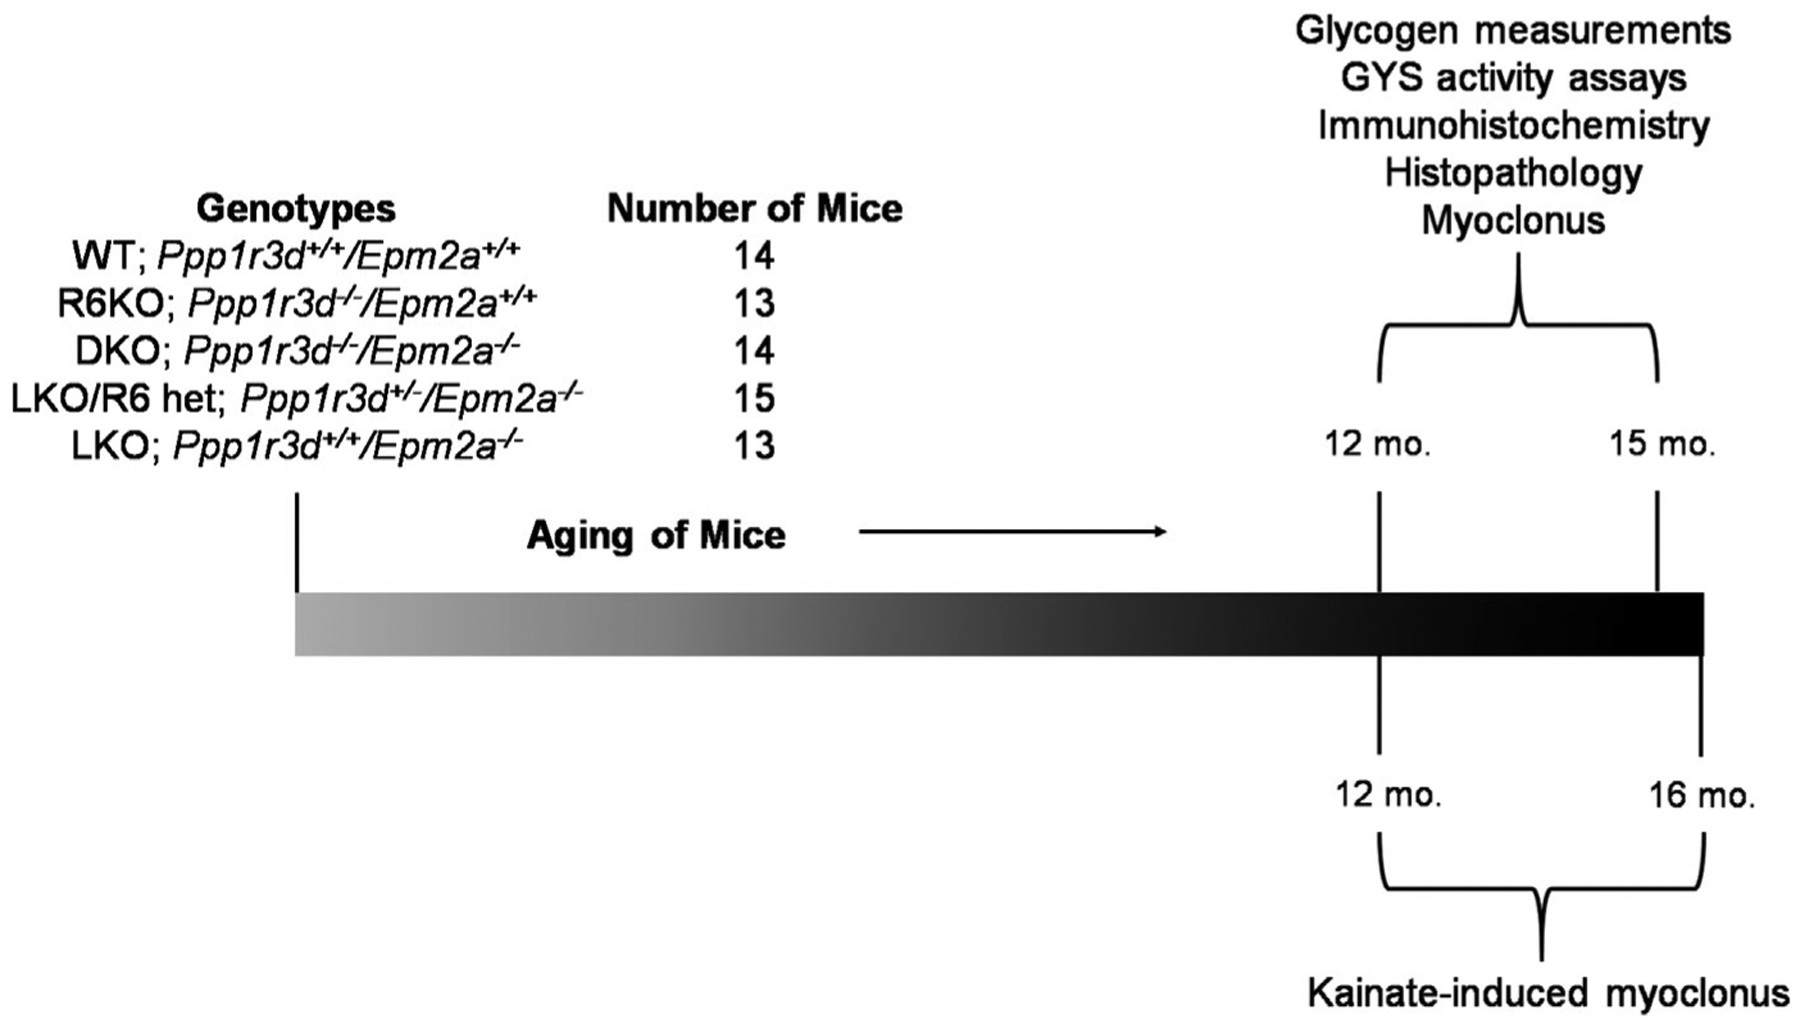
Timeline of experiments conducted involving aged mice. Mice of above five genotypes were aged until sacrifice via cervical dislocation between 12–15 months for glycogen quantification, biochemical assays, immunohistochemistry and histopathology (periodic acid-Schiff diastase staining). For myoclonus testing, mice were 12–15 months old, while kainate-induced epilepsy testing involved mice 12 –16 months old. The number of mice excluded over the course of the experiment and across all genotypes was 18. Reasons for exclusion were various health concerns, or animals found dead, that were not specific to any particular genotype
FIGURE 2.
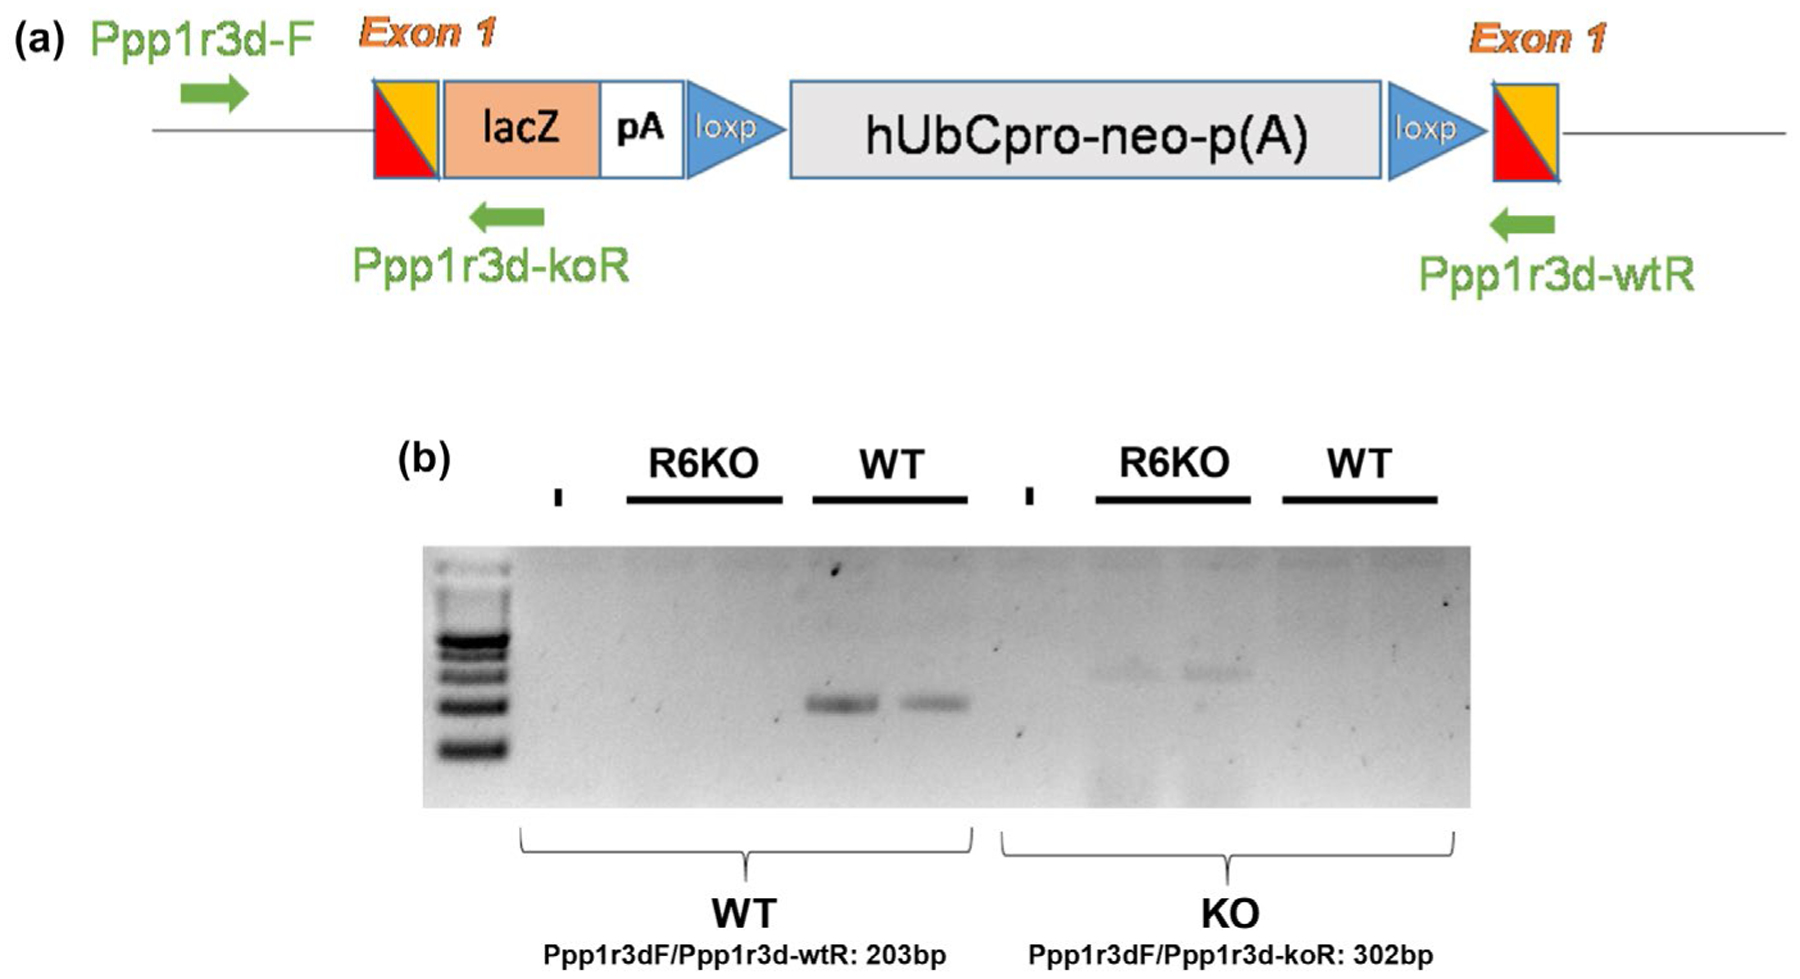
Insertion of the Zen-Ub1 cassette into exon 1 of Ppp1r3d for generation of R6KO mice. (a) A Zen-Ub1 cassette consisting of a lacZ-p(A) reporter and a loxP-flanked hUbCpro-neo-p(A) selection marker were inserted into exon 1 for an 836 base pair deletion. (b) Extraction of genomic DNA from brain tissue reveals that exon 1 was replaced with the cassette in R6KO mice
TABLE 2.
Genotyping primers
| Name | Purpose/Annealing temperature | Sequence [5’−3’] | Amplicon size [bp] |
|---|---|---|---|
| Ppp1r3c-WT-F Ppp1r3c-WT-R |
Detection of Ppp1r3c WT/57°C | GAGCTGTGTCAGACTTGTTCAGATAGAGC TTGAAAACCATTGTAAGGACCCAGGAAACTC |
400 |
| Ppp1r3c-KO-F Ppp1r3c-KO-R |
Detection of Ppp1r3c WT/55°C | AGATCTCATCACCCCAGTGC TAGTTCCCAGGCTGTCCTTG |
192 |
| Ppp1r3d-WT-F Ppp1r3d-WT-R |
Detection of Ppp1r3d WT/55°C | CGAAGATGTCCTCGGTACCTTCAGC CAGGATCTGGAGTTCACGCTGC |
274 |
| Ppp1r3d-KO-F Ppp1r3d-KO-R |
Detection of Ppp1r3d KO/57°C | GCAGCCTCTGTTCCACATACACTTCA AGGCCTTTCTTGCAAAACACTGACC |
438 |
| Epm2a-F Epm2a-KO-R Epm2a-WT-R |
Detection of Epm2a WT and KO/55°C Detection of Epm2a KO/55°C Detection of Epm2a WT/55°C |
GCATCGGCTGTAAGTTAGCC AGCGTATTCAATAACCCTTAAT CGTGTGTCCATTCTCCAGAA |
430 (KO) 620 (WT) |
Statistical methods were not employed to predetermine the sample size for each mouse genotype. Sample sizes for biochemical experiments were approximated based on past LD studies that demonstrated the predominant phenotype of glycogen accumulation in LD mice (Duran et al., 2014; Nitschke et al. 2017; Brewer et al., 2019). All mice were housed in individually ventilated cages with a maximum of four companions per cage, with access to food and water ad libitum. Room temperature was consistent and maintained between 20 and 22°C. Weights of mice varied with age and ranged from 30 to 40 g. Both males and females were used in this study, except in the results in the muscle and heart experiments where only male animals were used. Mice were sacrificed once reaching the desired age and were sacrificed during morning hours via cervical dislocation. Cervical dislocation was chosen to minimize stress for mice and avoid risk of glycogen depletion. The experimenter was blind to mouse genotype for all experiments, as an identification number was allocated to each mouse with no reference to genotype. For kainic acid testing, the experimenter was aware of mouse genotype since this was necessary to have known during dose optimization procedures. For glycogen measurements, mice were 12–15 months old at sacrifice. Behavioural tests were conducted at 12 months of age (myoclonic activity) or 12–16 months of age (kainic acid testing). These ages were used because LD is a progressive disease, and its behavioral phenotypes are stronger and easier to distinguish from control in older age. In vitro GYS activity assays were conducted using brain or muscle homogenates from mice 12–15 months old, except for data showing GYS activity ratios of R5- and R6- partially or completely deficient mice, which were 1–3 months old. Histopathology and immunohistochemistry images are from mice 12–15 months of age.
2.3 |. Genotyping information
2.4 |. Glycogen determination
Mice were sacrificed by cervical dislocation and harvested brain, muscle, and heart tissue were flash-frozen. Tissues were pulverized in liquid nitrogen and boiled in 30% (w/v) KOH for one hour with frequent agitation. Tissues were precipitated three times in 67% (v/v) ethanol and 15 mM LiCl. Between each precipitation, tissues were stored at −20°C overnight. Aliquots were suspended in water and digested with amyloglucosidase (Megazyme) in 80 mM sodium acetate buffer, pH 4.5 at 55°C for 1 hr. Liberated glucose was quantified enzymatically (Lowry & Passonneau, 1972).
2.5 |. Immunohistochemistry and histopathology
Tissues were fixed in 10% neutral buffered formalin and lightly agitated for 48 hr at room temperature, prior to embedding in paraffin. Immunohistochemistry was conducted using anti-glial fibrillary acid protein (anti-GFAP) antibody, for measurement of astrogliosis (1:200; BioLegend; Cat #914501; RRID_AB2565155) or anti-ionized calcium-binding adapter molecule 1 (anti-Iba1) antibody, to visualize reactive microglia (1:2000; Wako Chemicals; Cat #019–19741; RRID_AB839504). Washing buffer was PBST with 0.1% Tween 20. Serum-free protein block solution was from Agilent/Dako X090930–2. Block buffer was Dako serum-free protein block from the same source Cat# X090930–2.
LB were visualized using the periodic acid-Schiff diastase (PASD) stain. Slides were scanned using Pannoramic 250 Flash II Slide Scanner, and the HistoQuant module from 3DHISTECH digital pathology software was used to analyze mouse hippocampi. LB were detected by the software based on their color, hue, and saturation. Size exclusion parameters were included to avoid detection of structures that can also stain with PASD such as blood vessels within the hippocampus. The area of the hippocampus and the area of the hippocampus stained with PASD (indicating presence of LB) were measured, and LB accumulation was presented as the percent of hippocampus occupied by LB (Appendix A; Equation A.1.). Anti-GFAP and anti-Iba1 binding were quantified by a similar equation (Appendix A; Equation A.2. and Equation A.3.).
2.6 |. Kainate-induced myoclonus and seizures
Kainic acid (Sigma–Aldrich) was prepared by dissolving 10 mg with 1–2 drops of 1 N NaOH for a concentration of 1 mg/ml. Mice 12–16 months were injected with 8 mg/kg intraperitoneally and observed for a maximum of 1.5 hr. Myoclonic and seizure activity were compared between genotypes and assigned a number corresponding to stage 0–5 on the modified Racine Scale (Pederson et al., 2013; Racine, 1972). Mice were euthanized by cervical dislocation following a maximum 1.5 hr observation period.
2.7 |. Spontaneous myoclonus
Spontaneous myoclonic jerks were quantified as described previously with slight modifications (Turnbull et al., 2011). Mice 12 months of age were videotaped for three hours in an empty cage. Periods of low movement and sleeping were closely monitored for myoclonic jerks. A total of 10 min was watched for each mouse, blind to genotype, and myoclonus reported as jerks/minute.
2.8 |. Tissue homogenization and glycogen synthase activity assay
Flash frozen tissue was pulverized in mortar and pestle to a fine powder. Samples were homogenized in ice-cold homogenization buffer (50 mM Tris-HCl buffer [pH 8], 1 mM EDTA, 1 mM EGTA, 50 mM NaF, 10 mM Sodium β-glycerol phosphate, 5 mM sodium pyrophosphate, 2mM DTT, protease and phosphatase inhibitor cocktails (Roche)) by repetitive agitation using 18G × 1 ½ BD PrecisionGlide™ needles. Samples were centrifuged at 4°C, 10,000 rpm for 20 min supernatant recovered. The in vitro GYS activity assay was conducted in a 96-well plate and measured in triplicates. Brain samples were incubated with UDP-[14C]glucose, 0.17 mM glucose-6-phosphate (G6P) (absence, −) or 8 mM G6P (presence, +) and 2 mg/ml glycogen for 30 min at 37°C. Glycogen was precipitated with 67% ethanol, and repeatedly washed with ethanol to removed unbound UDP-[14C]glucose. The amount of radiolabeled glucose incorporated by GYS in the absence and presence of G6P generates an activity ratio, providing an indication of the phosphorylation status of GYS in tissue samples.
2.9 |. Transcript expression – organ level
Transcript expression levels were evaluated from publicly available databases deposited form published data for mouse and human from https://www.ebi.ac.uk/gxa/home. Database filters were for Mus musculus or Homo sapiens and “organism part.” An RNA-seq database was selected for each species (Barbosa-Morais et al., 2012; Consortium & G. T, 2015). The transcripts for Ppp1r3a, Ppp1r3b, Ppp1r3c, Ppp1r3d, Ppp1r3e, Ppp1r3f, Ppp1r3g and the respective human genes were used as keywords. Transcript data was downloaded as transcripts per million (TPM) with display cutoffs at 0.5 TPM.
2.10 |. Transcript expression—cellular level of the brain
Transcript levels of Ppp1r3c and Ppp1r3d were compared from the http://www.brainrnaseq.org database with data deposited from published work (Zhang et al., 2014, 2016). Transcript levels are represented as fragments per kilobase million (FPKM). The transcript levels of R5 were then compared to R6 in each of mouse and human in astrocytes and neurons.
2.11 |. Focused Ppp1r3c and Ppp1r3d gene expression level analysis
Total brain RNA was extracted and purified as follows: brain tissue was homogenized in Ambion TRIzol reagent (Thermo Fisher Scientific, Cat. #15596018) using a 1cc syringe and 21g needle. The homogenate was loaded onto Phase Lock Gels (VWR, Cat. #10847–802) and after centrifugation the aqueous phase was loaded onto RNA columns from the PureLink™ RNA Mini Kit (Thermo Fisher Scientific, Cat. #12183025). The kit’s manufacturer’s instructions were followed and on-column DNaseI digestion was performed to eliminate all genomic DNA in the samples using the PureLink™ DNase Set (Thermo Fisher Scientific, Cat. #12185010). cDNA synthesis was conducted using the iScript™ Reverse Transcription Supermix (Bio-Rad, Cat. # 1,708,841), using 1 ug of total brain RNA with a final volume of 20 μL.
Ppp1r3c and Ppp1r3d gene expression analysis was performed using the Bio-Rad QX200 Droplet Digital PCR (ddPCR) system. Tfrc1 was used as reference. For Tfrc1 a custom TaqMan assay was used (Tfrc1-F: TGCCTAATATACCTGTGCAAACAATC, Tfrc1-probe: CAAGAGCTGCTGCAGAA, Tfrc1-R: TTCCTTCCATTTTT CCAAATAGCT), while predesigned assays were used for Ppp1r3c (Mm01204084_m1) and Ppp1r3d (Mm01221590_s1). Both custom and commercial assays were ordered from Thermo Fisher Scientific. The 20 μL ddPCR reaction mix consisted of 10 μL 2× ddPCR SuperMix for Probes (Bio-Rad, Cat. #186–3023), 1 μL Ppp1r3c or Ppp1r3d assay (FAM-labeled), 1 μL reference gene assay (VIC-labeled), 1 μL of cDNA, and 7 μL nuclease free water, respectively. Cycling conditions for the reaction were 95°C for 10 min, followed by 45 cycles of 94°C for 30 s and 60°C for 1 min, and eventually 98°C for 10 min on a Life Technologies Veriti thermal cycler. Data were analyzed using QuantaSoft v1.4 from Bio-Rad. Both Ppp1r3c and Ppp1r3d were analyzed in duplex reaction mode together with the Tfrc1 reference assay. Results are expressed as relative expression values and were obtained by calculating the ratio of Ppp1r3c/Tfrc1 and Ppp1r3d/Tfrc1, respectively, and then normalizing to Ppp1r3c WT values. No-template controls and no-RT controls were run in parallel with the study samples.
Lcn2, Cxcl10, and C3 gene expression analysis was performed using the Applied Biosystems QuantStudio 7 Pro SmartStart Real-Time PCR system. Data were analyzed using Design & Analysis Software v2.3 from Applied Biosystems. Real-time PCR was performed using SYBR® Green I technology and’Standard’ cycling conditions (30 s at 95°C, 40 cycles of 15 s at 95°C, and 1 min 60°C) followed by a dissociation curve to check specificity of the amplification. Reactions contained 1× concentrated iTaq Universal SYBR Green Supermix (Bio-Rad, Cat. #1725122), 400 nM forward and reverse primers, and 2 μl of 1:5 diluted cDNA (20 ng) in a total volume of 20 μl. Gene expression data were normalized against Oaz1 and Hprt according to Vandesompele et al. after using the geNorm algorithm which determined these two genes as the most stable reference genes in our dataset (Vandesompele et al., 2002). Results are expressed as relative expression values with WT values set to 1. The following primers were used with amplicon size in parentheses: Lcn2-F: GCCTCAAGGACGACAACATC, Lcn2-R: CACACTCACCACCCATTCAG (75 bp); Cxcl10-F: AAGTGCTGCCGTCATTTTCT, Cxcl10-R: ATAGGCTCGCAGGGATGATT (158 bp); C3-R: CTGTGTGGGTGGATGTGAAG, C3-R: TCCTGAGTGTCGTTTGTTGC (102 bp); Oaz1-F: AGGGCAGTAAGGACAGTTTTG, Oaz1-R: TCTCACAATCTCAAAGCCAAG (149 bp); Hprt-F: TTGCTGACCTGCTGGATTAC, and Hprt-R: ACTTTTATGTCCCCCGTTGA (124 bp).
2.12 |. Statistics
Statistical analyses were not conducted with blinding. Analyses were conducted using GraphPad Prism versions 8.1.2. Unless otherwise stated, ordinary one-way ANOVA was conducted and followed by unpaired student’s t test with Welch’s correction to evaluate statistical significance, where bars are shown as means ± standard deviation. Exceptions include data pertaining to kainic acid seizure susceptibility testing, where a Kruskal–Wallis ANOVA followed by the Mann–Whitney test was used to determine statistical significance among median Racine stage reached of each genotype. An additional exception includes data from quantification of LB in whole versus pyramidal hippocampal neurons, where a multiple t test analysis with Holm-Šídák correction was conducted. Expression data in Figure 5 were analyzed using one-way ANOVA followed by post-hoc tests with Holm-Šídák correction for multiple comparison. Expression data displayed in Figure 9a were analyzed using a two-way ANOVA followed by post-hoc tests with Bonferroni correction for multiple comparison. Asterisks denote level of significance based on p value: *p < .05, **p < .01, ***p < .001, and ****p < .0001.
FIGURE 5.
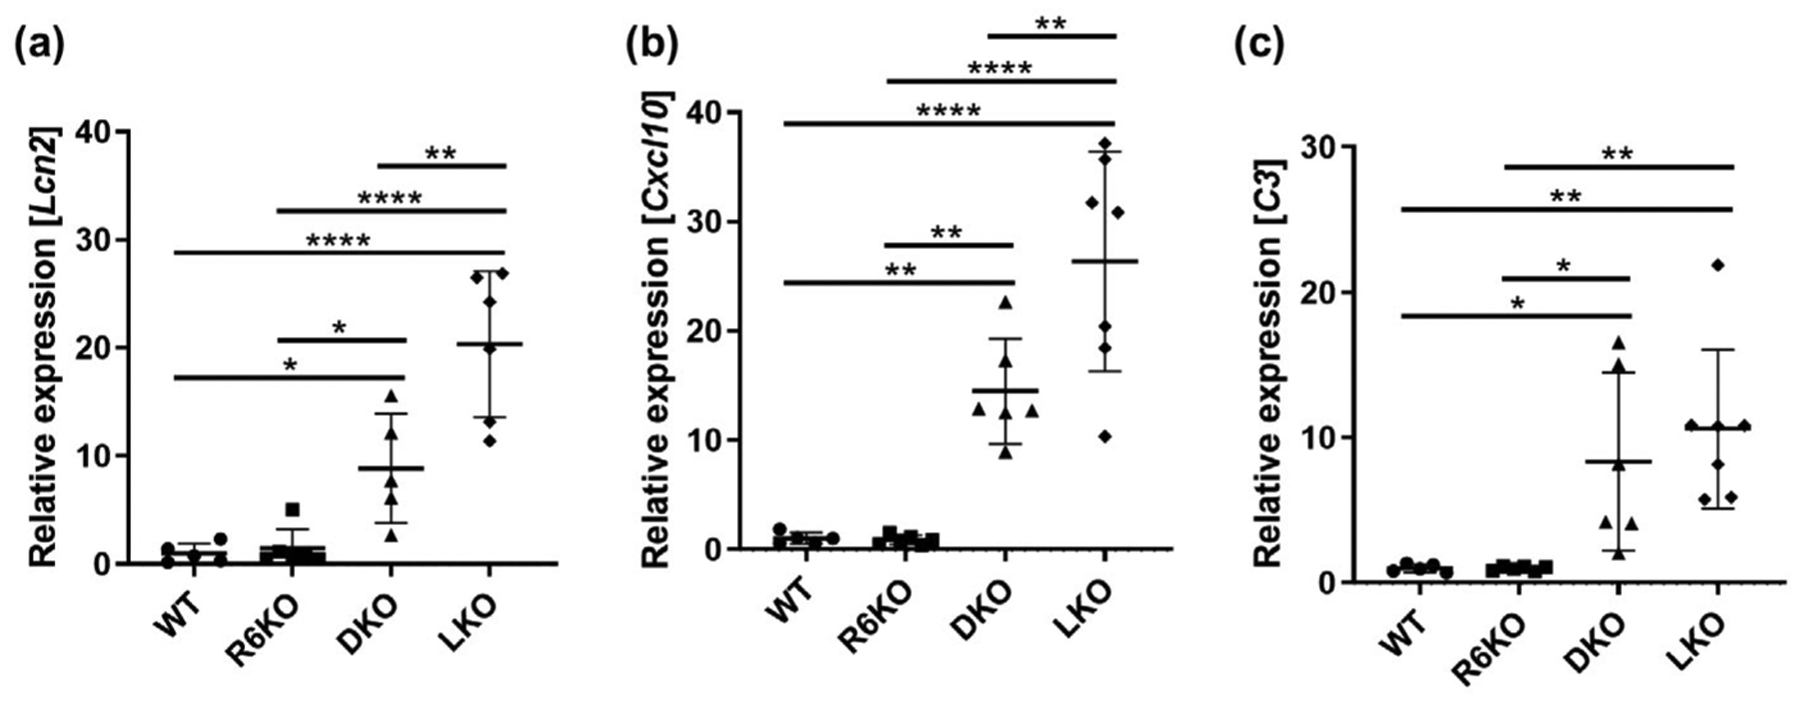
R6 deficiency significantly reduces inflammatory and immune system response gene expression in Lafora disease mice. (a) Lcn2, (b) Cxcl10, and (c) C3 relative gene expression. n = 5–7 mice per genotype
FIGURE 9.
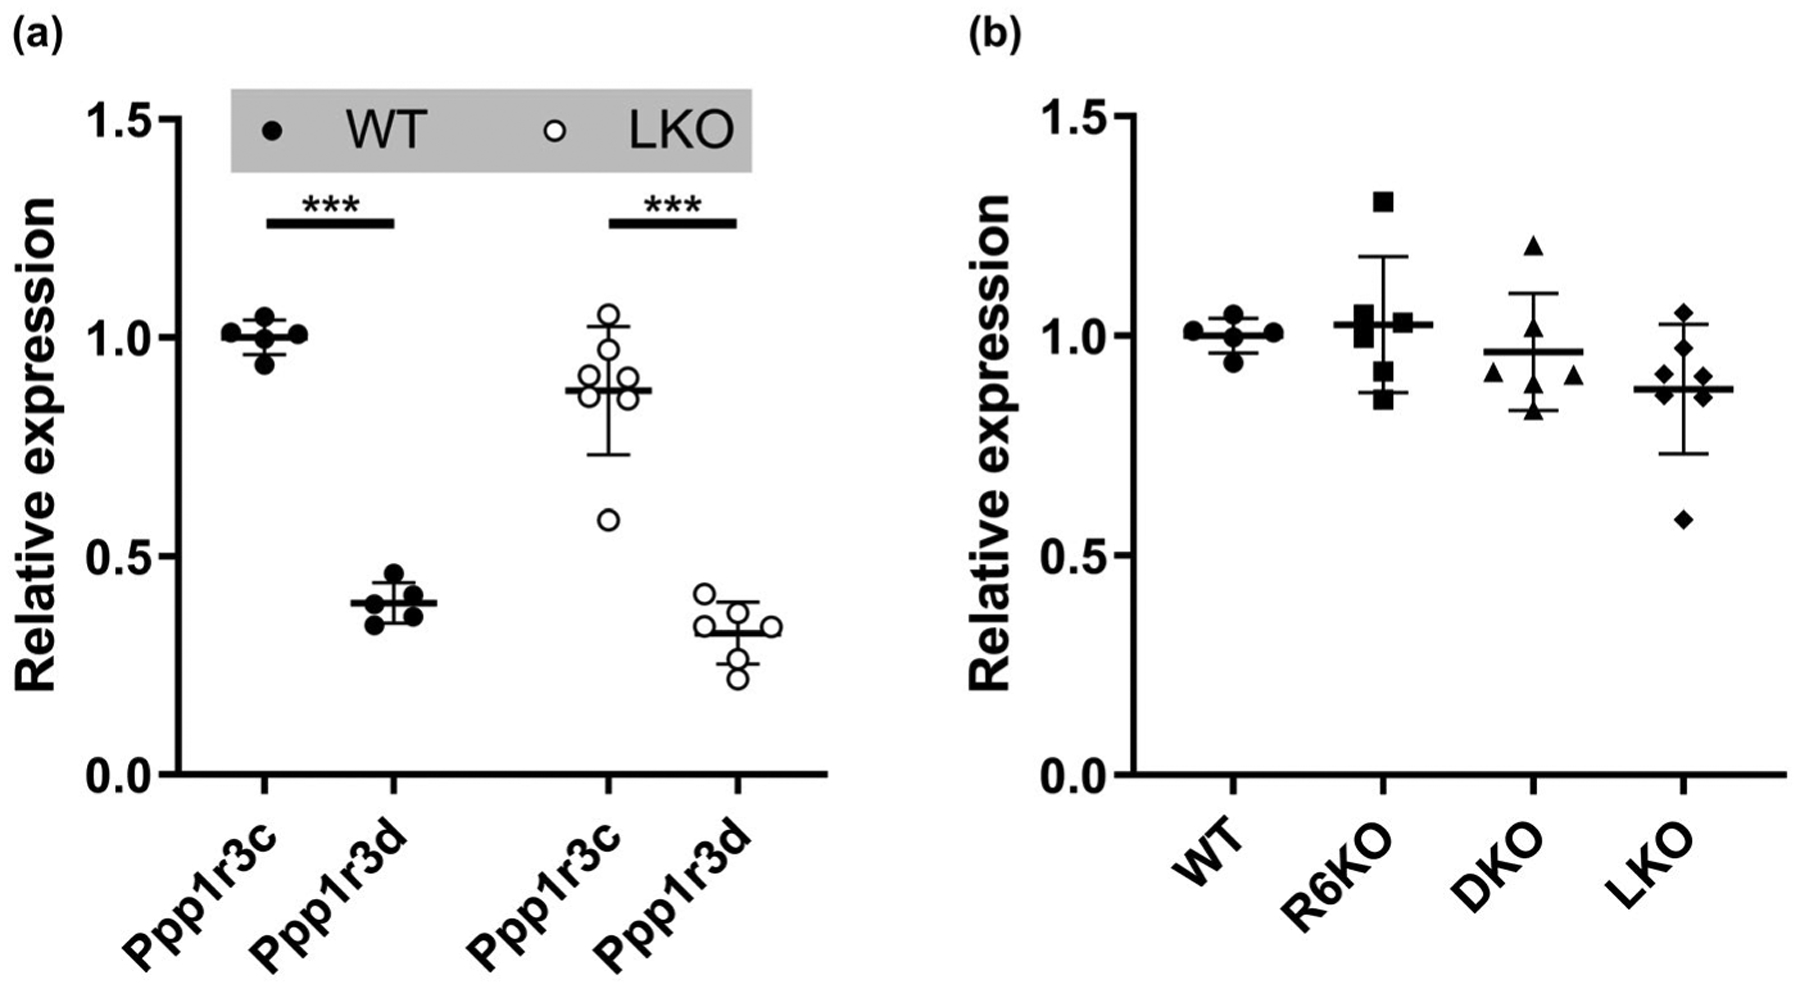
Expression level of Ppp1r3c (R5) relative to Ppp1r3d (R6) as measured by ddPCR is consistent with values obtained in general transcriptomic analyses (Table 1) and is unaltered in Laforin knockout (LKO) and R6KO mice. (a) Brain R5 and R6 gene expression in WT and LKO mice. (b) Brain R5 gene expression in WT, R6KO, laforin/R6 double knockout (DKO), and LKO mice; n = 5–7 mice/genotype
3 |. RESULTS
3.1 |. R6 knockout in LD mice partially reduces brain LBs
Crossing laforin-deficient mice (LKO) with R6 deficient mice (R6KO), we generated double knockout mice, which we studied at ~14 months. In the remainder of the paper, laforin/R6 double knockout mice are referred to as laforin/R6 double knockout (DKO). As quantified histochemically in the hippocampus, LBs were reduced by 25% in DKO mice (Figure 3b). Total brain glycogen, most of which in LD mice of this age consists of the polyglucosans accumulated into LBs (Nitschke et al., 2018), quantified biochemically, was reduced by 50% (Figure 3a). This 25%–50% reduction is far less than is achieved with knocking out of R5 in LKO mice, where LBs and accumulated glycogen are reduced by over 90% (Turnbull et al., 2011). This is not surprising given that brain R6 transcripts make up a much smaller portion of total Ppp1r3 transcripts than R5 (Table 1). It is, however, surprising that it is as high as 25%–50%, given that R6 makes up only ~12% of total Ppp1r3 mRNA (Table 1).
FIGURE 3.
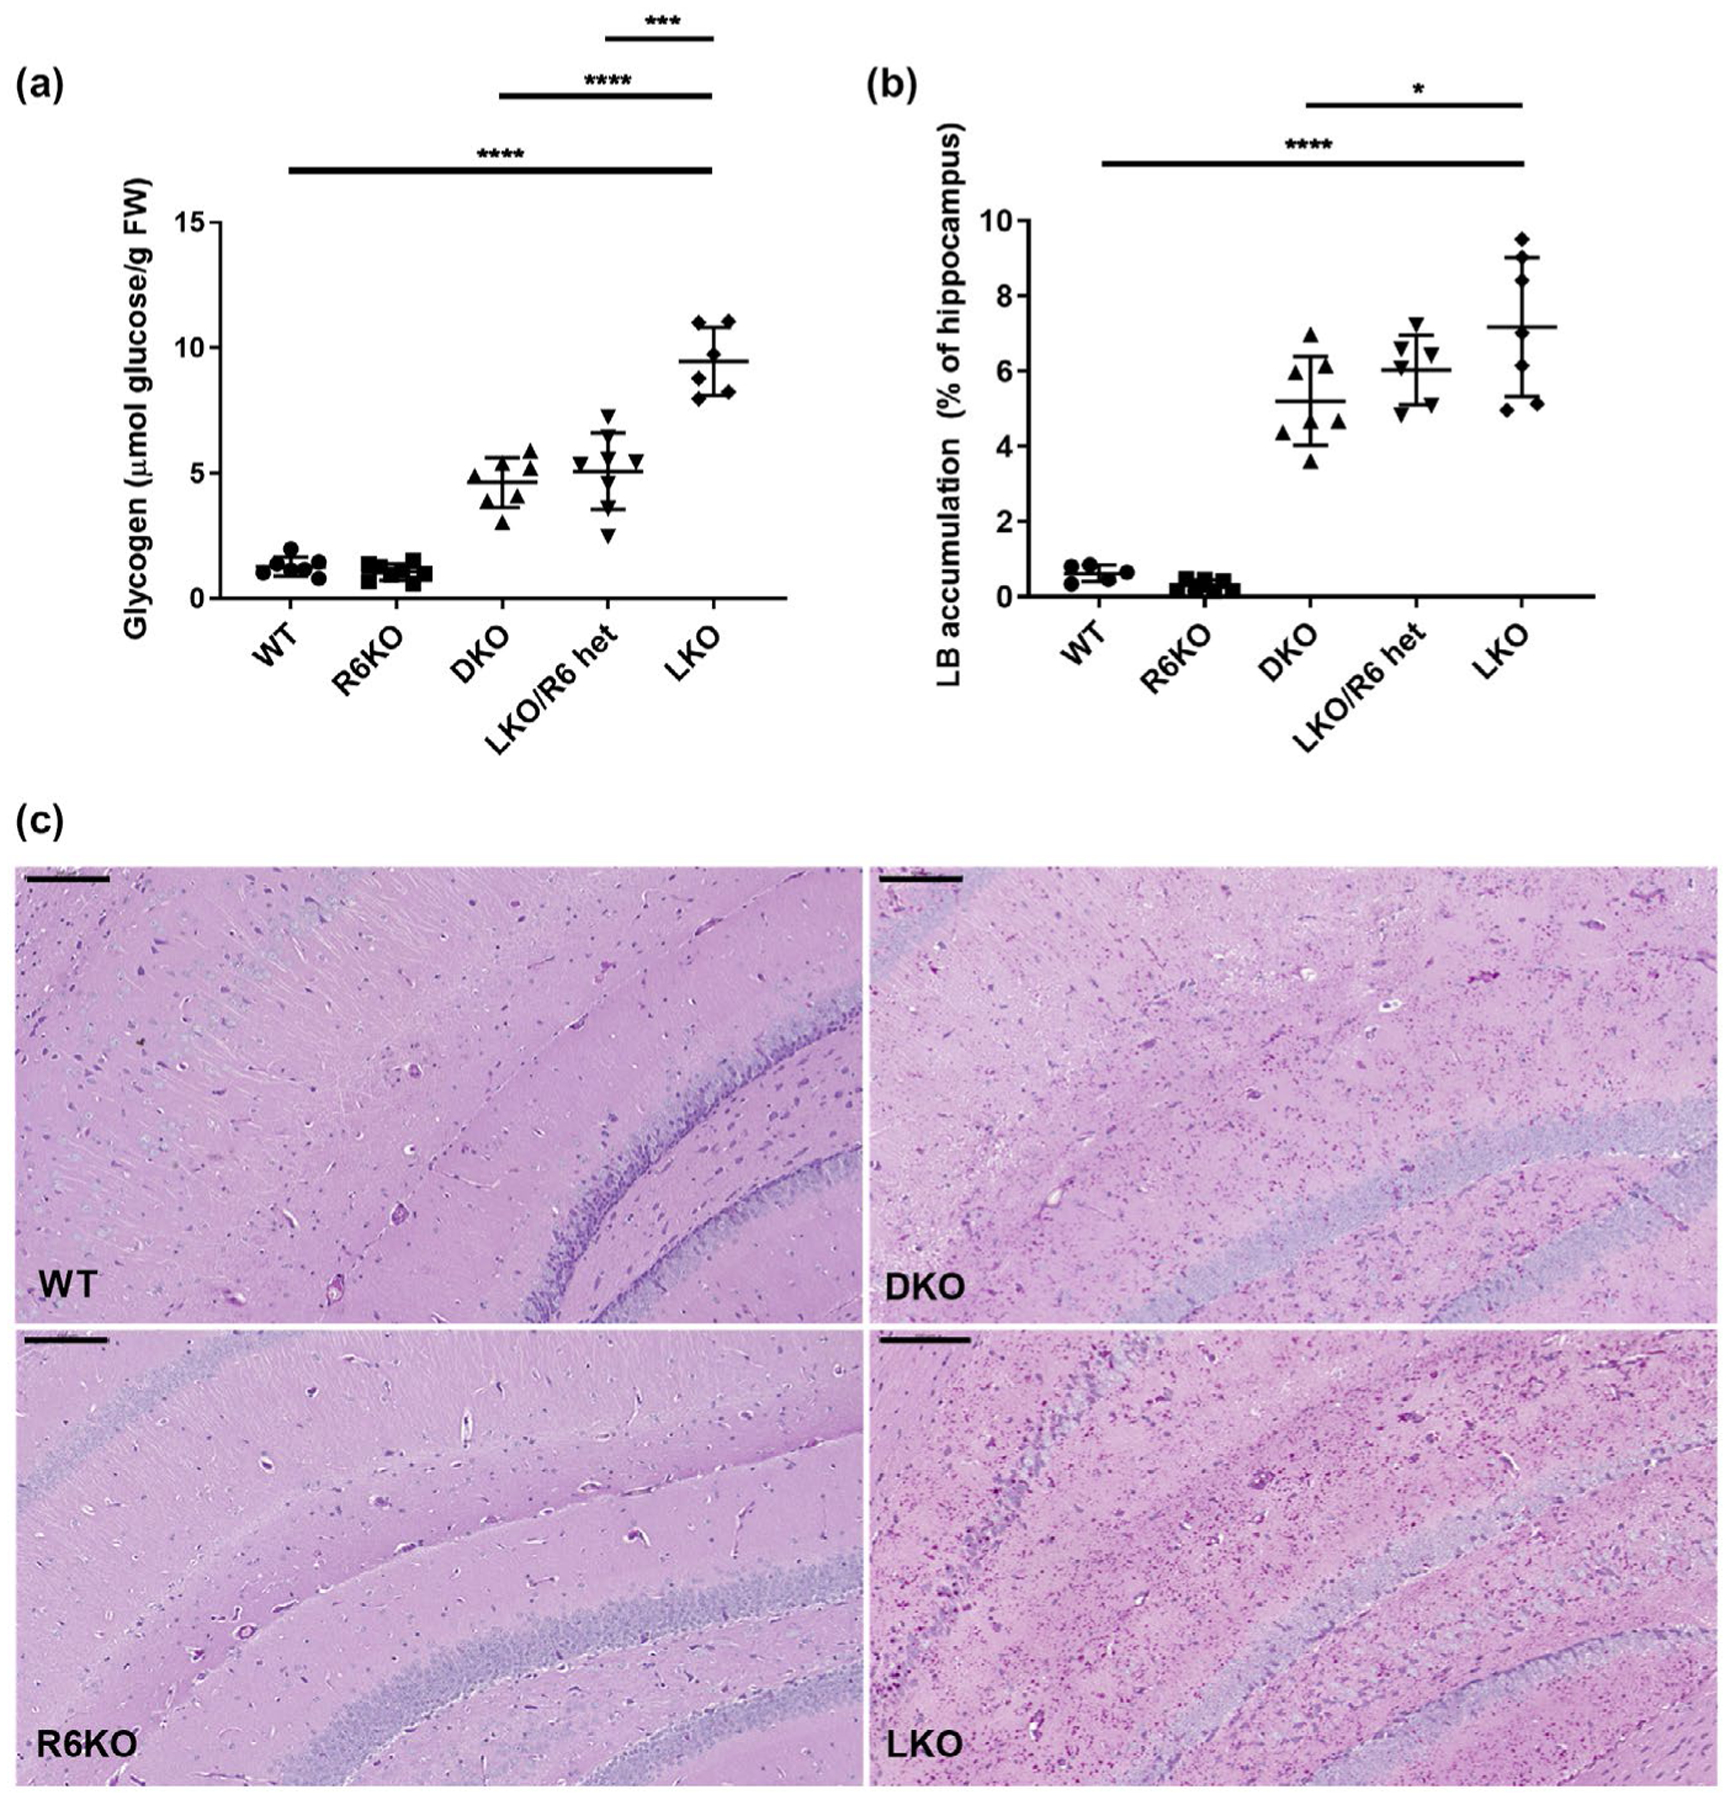
R6-deficienct laforin knockout mice have decreased total brain glycogen with corresponding reduction in hippocampal LBs. (a) Total brain glycogen measured as μmol glucose/gram fresh weight (FW). (b) LBs quantified as % of hippocampus stained with PASD. n = 5–8 mice/genotype. (C) Hippocampal micrographs showing representative images from indicated genotypes. Images acquired at 20× magnification. Scale bars, 100 μm
3.2 |. Knockout of R6 in LD mice does not rescue gliosis, myoclonus or seizure susceptibility, but does reduce expression of several LD-related inflammatory and immune system response markers
Hippocampal astrogliosis is the most consistent neuropathological correlate of LB accumulations in LD mouse models (Duran et al., 2014; Lahuerta et al., 2020; López-González, Viana, Sanz, & Ferrer, 2017; Puri, Toshimitsu, Yamakawa, & Ganesh, 2012; Sánchez-Elexpuru et al., 2017), which is rescued in R5-deficient (Turnbull et al., 2011) but not, as shown in Figure 4, in the present R6-deficient LKO mice. Extending the study to microglia, with Iba1 staining, we observed the presence of microgliosis in the LKO mice, but this too was not corrected in the DKO mice (Figure 4). Recently, transcriptomic studies revealed wide-ranging increased expression of inflammatory and immune system response genes in the murine LD brain. Of the large array of differentially expressed genes upregulation of nine genes was validated using quantitative RT-PCR and other analyses (Lahuerta et al., 2020). We tested the three genes with the strongest fold change at 16 months, Lcn2, Cxcl10, and C3, which also exhibited a clear age-dependent increase in gene induction, in accordance with LD progression. We found all three genes significantly upregulated in LKO mice with Lcn2 and Cxcl10 being significantly corrected in DKO mice (Figure 5), suggesting that the partial reduction in LBs with R6 deficiency does impact at least some aspects of the LD neuroinflammatory disease.
FIGURE 4.
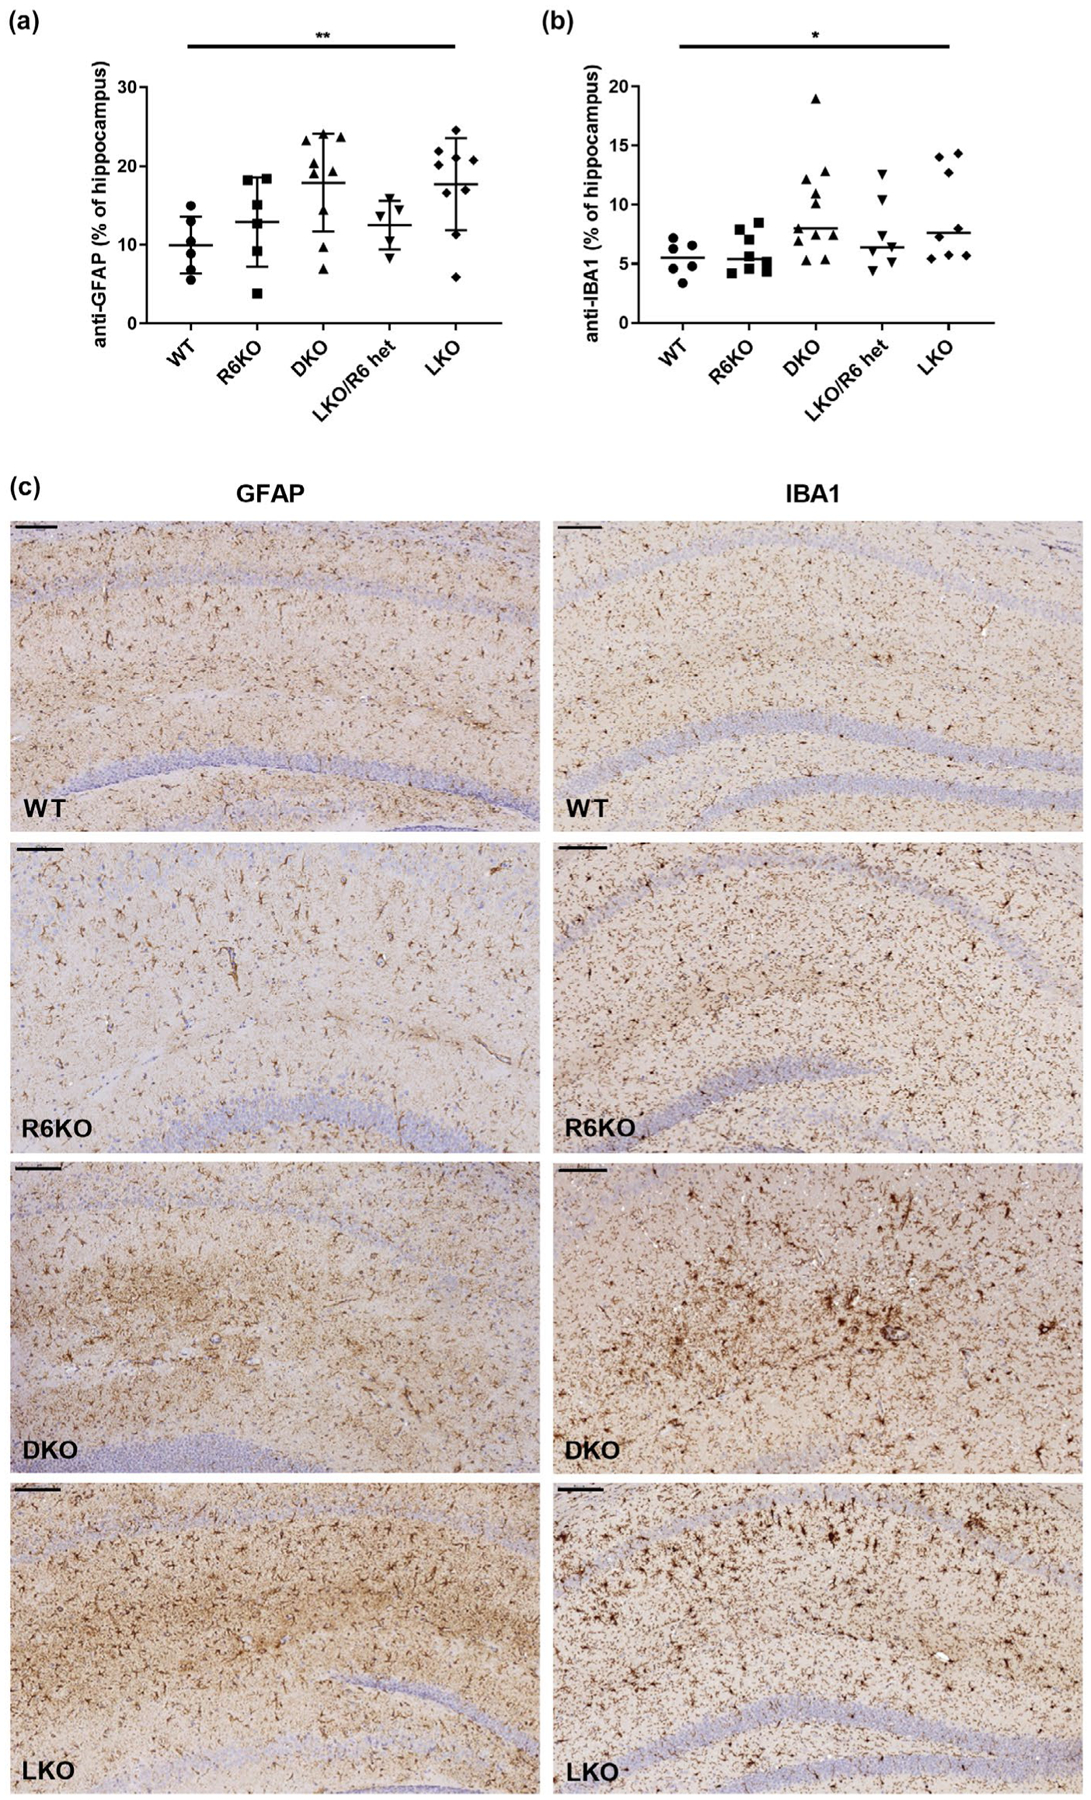
Astrogliosis and microgliosis are not rescued in R6-lacking laforin knockout mice. Gliosis quantified as % hippocampus stained with (a) anti-glial fibrillary acid protein (anti-GFAP) (astrocytes) or ionized calcium-binding adapter molecule 1 (Iba1) (microglia) antibodies; n = 5–11 mice per genotype. Micrographs, representative images from indicated genotypes; scale bars, 100 μm
The best documented epileptic phenotypes in LD mice are spontaneous myoclonus (Ganesh et al., 2002) and increased seizure susceptibility to pro-convulsant drugs (Duran et al., 2014; García-Cabrero, Sánchez-Elexpuru, Serratosa, & Sánchez, 2014; Pederson et al., 2013; Valles-Ortega et al., 2011), which are rescued by R5 knockout (Turnbull et al., 2011). Myoclonus and increased susceptibility to kainic acid-induced seizures were confirmed to be present in the LKO mice in the present study, but neither was corrected to significance by R6 deficiency, although there is a trend toward correction of the kainic acid seizure susceptibility (Figure 6).
FIGURE 6.
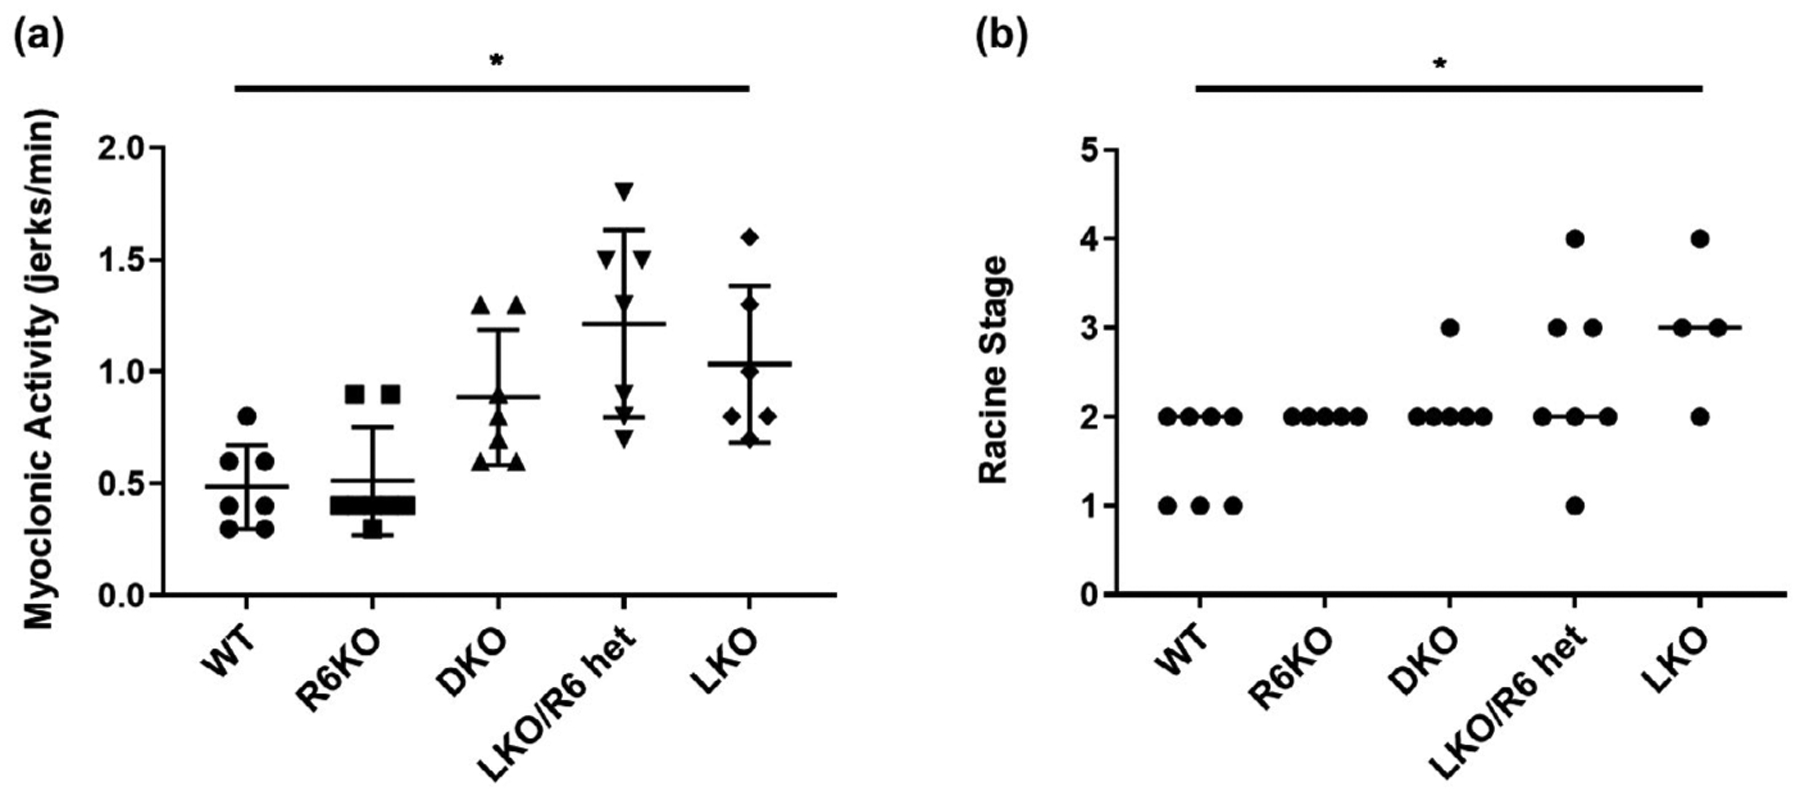
Myoclonus and seizure susceptibility are not rescued in R6-lacking laforin deficient mice. (a) Spontaneous myoclonus quantified as jerks/min; (b) Susceptibility to kainic acid-induced seizures; black dots, individual mice; lines connecting dots, median stage of the modified Racine scale; n = 4–8 mice per genotype
3.3 |. R6 knockout decreases brain GYS activity to a similar degree as R5 knockout
PP1 dephosphorylates GYS, and the degree of dephosphorylation correlates with GYS activity. GYS is also activated allosterically by glucose-6-phosphate (G6P), which at a sufficiently high concentration activates the enzyme fully, irrespective of its phosphorylation state. The degree of GYS activation attributable to its phosphorylation state is assessed in vitro by the ratio of GYS activity at a low G6P concentration versus GYS activity at a high G6P concentration, a higher ratio signifying a lower phosphorylation-dependent inactivation of GYS (Roach, 2002). We measured the GYS activity ratio in the soluble fraction of whole-brain extracts in R6KO mice and found that R6 deficiency does reduce the total brain GYS activity ratio to a significant degree (Figure 7a). Next, we aimed to compare this reduction to that imparted by R5 knockout. As a first step toward this, and to obviate genetic background effect, we bred R6KO and R5 knockout mice together to generate new mice with these same genotypes (i.e. R6KO and R5 knockout) and then compared their GYS activity ratios in whole brain extracts, which we found to be not significantly different (Figure 7b). Thus, surprisingly, despite its lower brain expression levels, R6 deficiency appears to have a similar impact on overall brain GYS activity as R5 deficiency.
FIGURE 7.
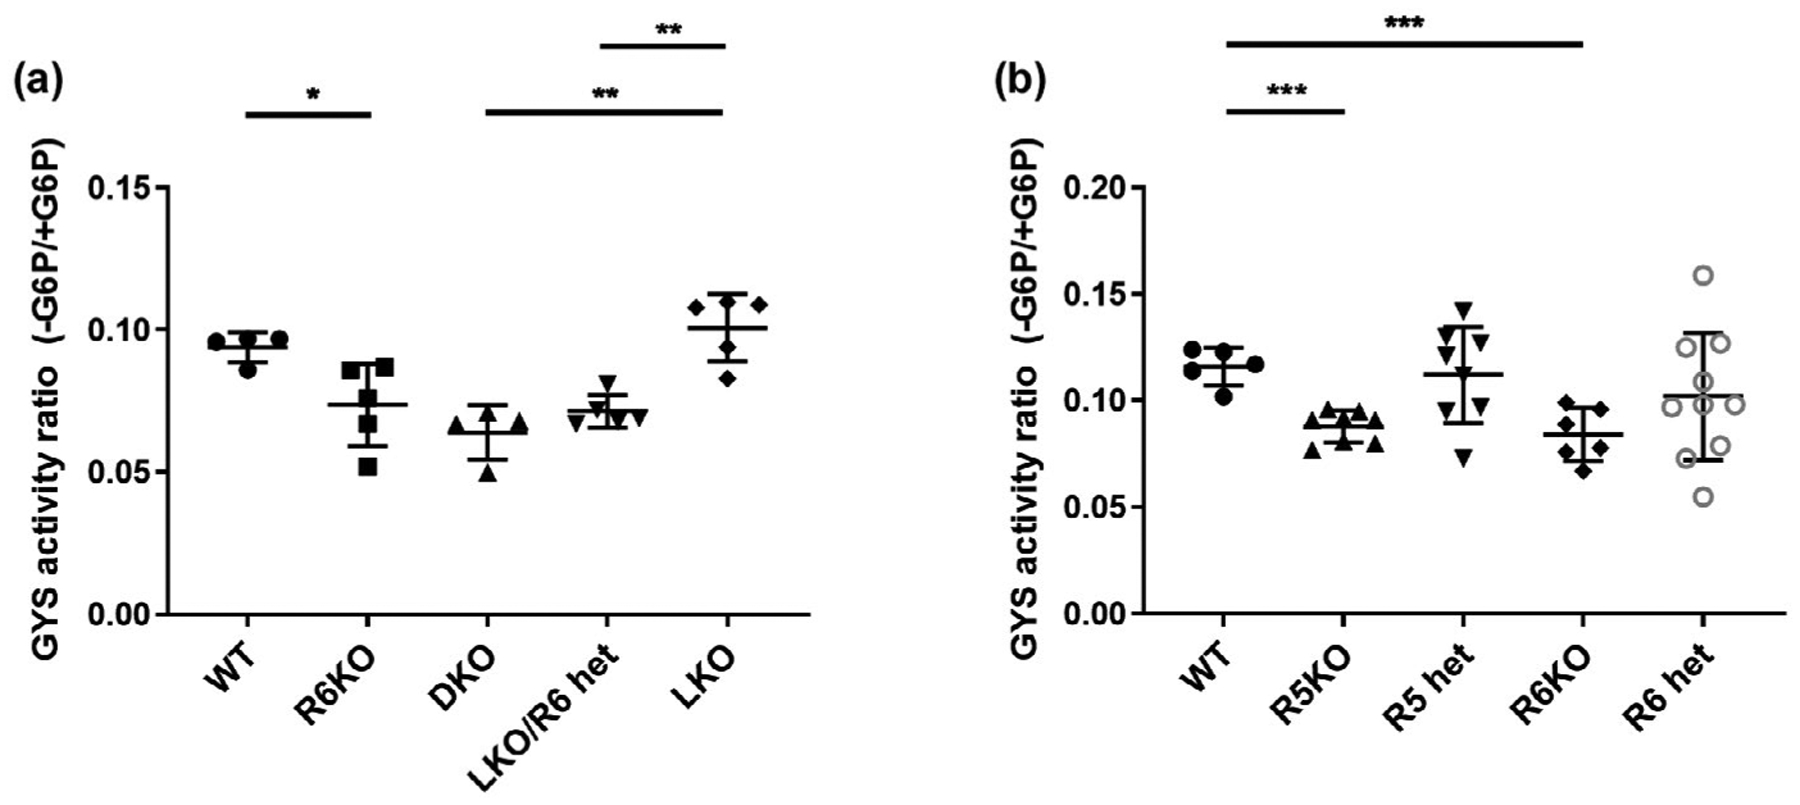
R6 deficient mice have total brain glycogen synthase (GYS) activity ratios comparable to those of R5 deficient mice. (a) Effect of R6 deficiency on the GYS activity ratio. (b) Comparison of the effects of R5 and R6 deficiencies on the GYS activity ratios. G6P, glucose-6-phosphate; n = 3–6 mice per genotype
3.4 |. Cell type-specific effect of R6 deficiency on reduction of LBs
As this work was in progress, the brain cell types in which LBs localize in mouse were specified. It was shown that the large majority of LBs are in astrocytes and most of the remainder in neurons (Auge et al., 2018; Rubio-Villena et al., 2018). In the hippocampus specifically, the majority of LBs were in astrocytes as in the rest of the brain. However, in the hippocampal pyramidal layer, the LBs were not in astrocytes, not co-localizing with GFAP, but in neurons, co-localizing with the neuronal marker NeuN (Auge et al., 2018). Separately, mouse brain single cell RNA sequencing results became available (Zhang et al., 2014), which show that while in astrocytes R6 is expressed 15-fold less than R5, in neurons it is expressed at the same level as R5 (Zhang et al., 2014) (Table 3). We therefore tested whether the impact of R6 deficiency on neuronal LBs is greater than on overall LBs. Measuring LBs in the hippocampal pyramidal neuron layer we found that in this layer LBs are reduced by 43% (Figure 8) (compared to 25% reduction, as mentioned, in the hippocampus as a whole (Figure 3b)), confirming a greater effect by R6 deficiency in neurons (at least hippocampal pyramidal neurons). This result, together with the observation that neuronal LBs are underrepresented in the hippocampus compared to other parts of the brain (Auge et al., 2018; Rubio-Villena et al., 2018), may, at least in part, explain the discrepancy between the 25% reduction in LBs in the DKO mice as measured histochemically in the hippocampus as a whole (Figure 3b) compared to the 50% reduction as measured biochemically in whole brain (Figure 3a).
TABLE 3.
Transcripts of mouse Ppp1r3 subunits expressed as fragments per kilobase million (FPKM)
| Gene | Astrocytes | Neurons |
|---|---|---|
| Ppp1r3a | 0.1 (0.1) | 0.1 (0.1) |
| Ppp1r3b | 0.1 (0.13) | 0.1 (0.1) |
| Ppp1r3c | 104.65 (47.93) | 2.77 (3.78) |
| Ppp1r3d | 6.92 (3.16) | 2.71 (0.1) |
| Ppp1r3e | 0.53 (3.19) | 3.55 (4.56) |
| Ppp1r3f | 2.71 (0.79) | 6.34 (2.92) |
| Ppp1r3g | 22.54 (2.84) | 0.68 (0.1) |
Note: Human levels in parentheses (Zhang et al., 2014, 2016).
FIGURE 8.
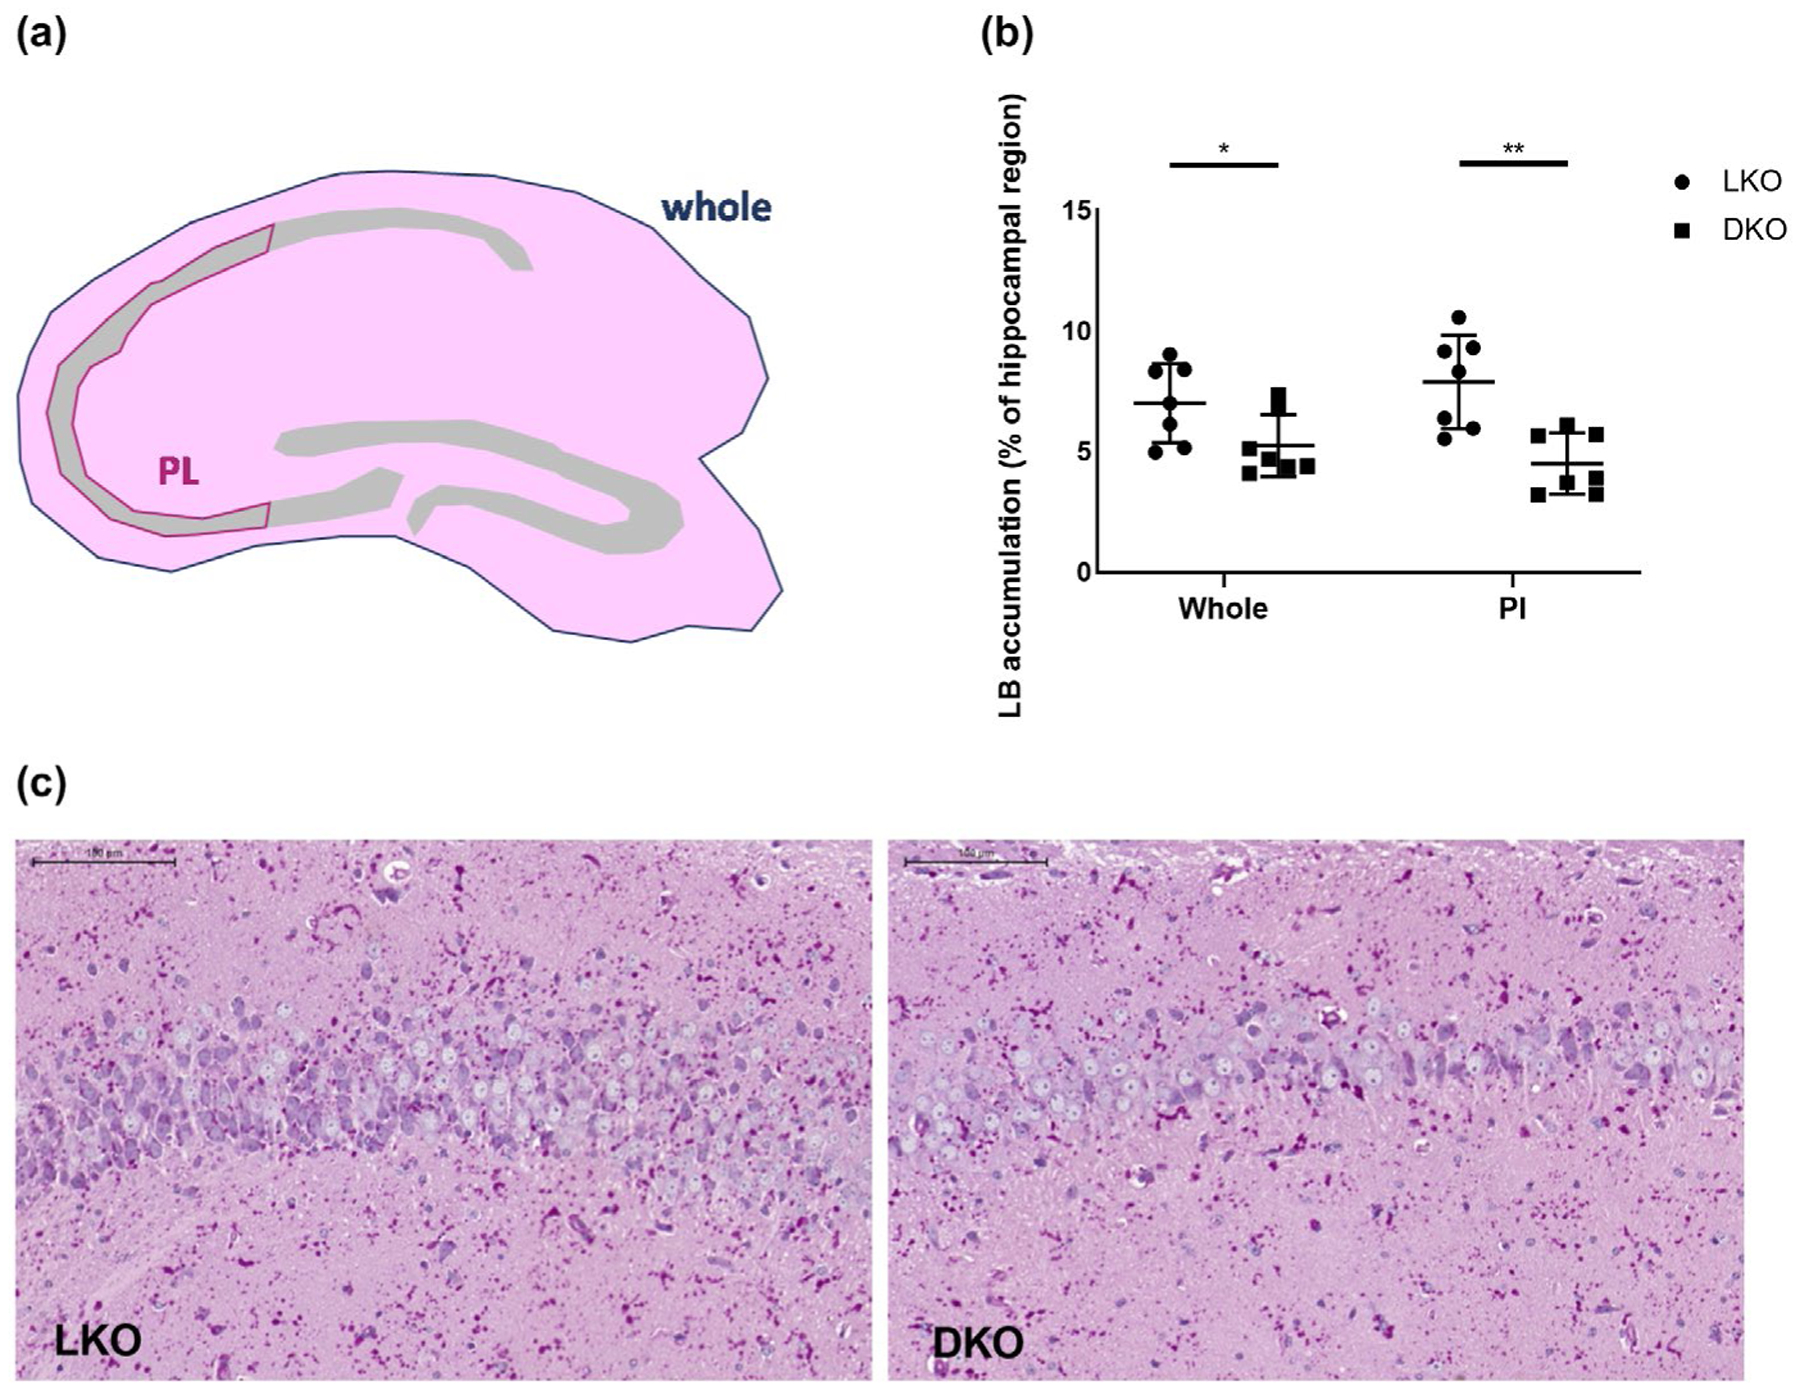
R6-deficient laforin knockout mice have reduced Lafora bodies in hippocampal pyramidal neurons. (a) Schematic diagram showing the areas in which LB were quantified; Whole = whole hippocampal area; Pl = pyramidal layer area of C2 and C3 regions of the hippocampus. (b) LB quantification in ‘Whole’ and Pl areas; n = 7 per genotype. (c) Micrographs, representative images of Pl area from indicated genotypes; PASD stain; scale bars, 100 μm
3.5 |. Absence of laforin does not alter brain expression levels of R5 and R6, and absence of R6 does not alter brain expression levels of R5
To verify reported transcriptomic data in our models, we proceeded to verify the relative brain expression levels of R5 and R6 reported in the transcriptomics study (Table 1) by quantifying brain R5 and R6 expression levels using focused droplet digital PCR. The relative expression levels we obtained for these two genes (Figure 9a) were closely similar to the values in the transcriptomic study (Table 1), confirming significantly lower expression of R6.
We also asked whether the relative brain expression levels of R5 and R6 are altered in the absence of laforin (i.e. in LKO mice) and found that they were not (Figure 9a). Finally, absence of R6 (R6KO) did not affect expression levels of R5 (Figure 9b).
3.6 |. Knockout of R6 does not reduce LBs in skeletal muscle but does so substantially in the heart
DKO animals did not exhibit reductions in LBs or accumulated glycogen in skeletal muscle (Figure 10a), unsurprising given the very low R6 expression in that tissue (<1% of total Ppp1r3 transcripts) (Table 1). In the heart, there was substantial reduction of LBs and accumulated glycogen in the DKO mice (Figure 10b), consistent with the substantial R6 expression (>11% of total Ppp1r3 mRNA) in cardiac muscle.
FIGURE 10.
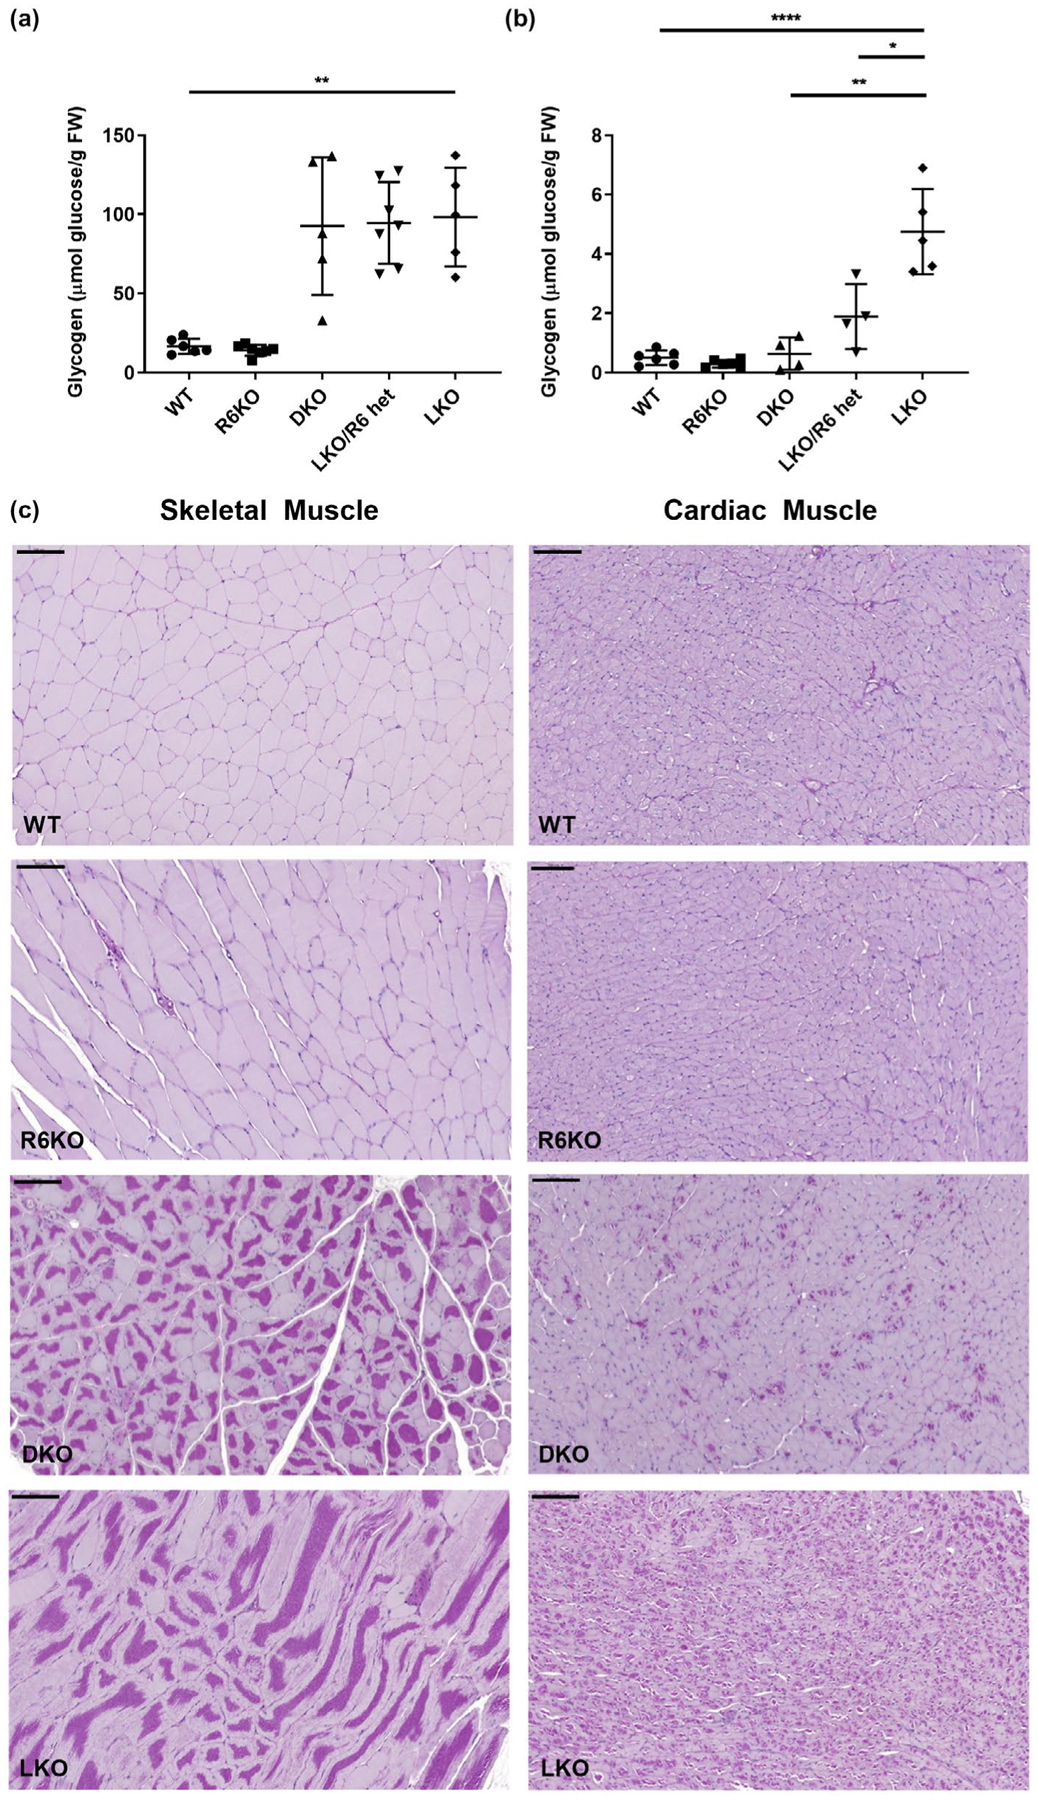
R6-deficient laforin knockout mice have reduced glycogen and LB accumulation in cardiac muscle, but not skeletal muscle. (a) Total skeletal muscle glycogen; n = 5–7 mice per genotype. (b) Total cardiac muscle glycogen; n = 4–6 mice per genotype. Left column of micrographs are representative images of LB accumulation in skeletal muscle from indicated genotypes. Right column of micrographs are representative images of LB accumulation in cardiac muscle from indicated genotypes; periodic acid-Schiff diastase stain; scale bars, 100 μm
4 |. DISCUSSION
LD discloses a previously unknown regulation of glycogen metabolism involving the laforin-malin complex acting via glycogen dephosphorylation and chain length calibration. A molecular link between this complex and the enzymes of glycogen metabolism (e.g. GYS and GP) is expected but not experimentally made yet. GYS and GP are also regulated by allosteric activation by G6P and AMP, respectively, and by phosphoregulation by kinases and PP1. The latter’s reciprocal activity on GYS and GP is in turn regulated by seven different subunits, at least five of which are utilized in the brain. Dedication of five separate genes to PP1-mediated brain glycogen metabolism regulation indicates a high degree of specialization, suggesting linkages between this metabolism and specific neural functions. Such linkages await to be studied, but appear to be expected based on recent findings on glycogen function in the brain. For example, lactate derived from glycogen in the astrocytic processes that ensheath synapses appears to be both the main energy source for and a signaling molecule in synapse activity (Magistretti & Allaman, 2018). The expected ‘quantal’ provision of lactate for these functions would likely be under tight, coordinated, regulation. Recent work has shown that blocking perisynaptic astrocytic glycogen digestion results in morphological synaptic contact and behavioral deficits, both of which can be rescued by lactate replenishment (Vezzoli et al., 2020). It is tempting to speculate that in LD, where the normal glycogen of astrocytic processes is replaced by unusable LBs, synapses starve of lactate, which may underlie part of the neurodegeneration and related symptoms of the disease.
Differences in the expression patterns of the PPP1R3 genes (Tables 1 and 3) between mice and humans suggests that different glycogen metabolisms support the functional differences between human and murine brain. For example, in humans PPP1R3C (R5) expression is 15-fold higher than PPP1R3D (R6) in astrocytes, which is the same as in mouse, but 38-fold higher in neurons, which is different from mouse where the two subunits are expressed equally, suggesting differences in neuronal glycogen metabolism between the two species. Notwithstanding, it appears that R5 is the workhorse, perhaps the housekeeping subunit in both species with by far the highest expression in astrocytes, the cells that store and metabolize by far the largest amount of brain glycogen (Magistretti & Allaman, 2018).
With the above, it is not surprising that in LD mice the absence of R5 has a dramatic impact on LBs, given that the latter form predominantly in the cell type in which the former predominates. The results in this study support the notion that LBs are pathogenic. The greater impact on LBs by R5 compared with R6 deficiency correlates with neuropathologic and epileptic improvement in the former but not the latter. While R6 deficiency does not result in improvement in neuroinflammation as measured immunohistochemically, it does impact at least some inflammatory and immune system response markers at the transcription level, probably consistent with its partial effect on LBs. Interestingly, in neurons (at least hippocampal pyramidal layer neurons), where R6 is expressed at a high level in mice, absence of this subunit has a substantial impact on LB formation. The associated trend towards reduced seizure susceptibility could relate to this and opens important questions as to which cell type(s) is important in which neurological phenotype in the disease.
Therapeutically, R5 would appear to be the subunit to target for downregulation. However, it is not obvious that the impact of this in humans will mirror that in mice. While as in mice R5 predominates in astrocytes, unlike in mice it does not dominate in the brain as a whole. In human whole brain, PPP1R3F is expressed at levels equal to R5, and PPP1R3E at up to 60% of R5 levels. Furthermore, it is not clear to what degree each of the isoforms can or would compensate for the absence of any other and whether such compensation would vary between species.
In addition to its glycogen, substrate and PP1 binding domains shared with other subunits, R6, the subunit targeted in this work, possesses consensus binding sequences for mitogen-activated protein kinase, calmodulin-dependent protein kinase-2, and 14-3-3 proteins (Armstrong et al., 1997; Munro et al., 2005; Rubio-Villena, Sanz, & Garcia-Gimeno, 2015). The functional niche of this subunit in glycogen metabolism modulation will be important in understanding energy storage management in neurons, in mice, even while this might not be directly relevant to humans, where the isoform is underrepresented in neurons.
A surprising finding in our study is the apparently similar impact on the GYS activity ratio by absence of two subunits (R5 and R6) with widely different expression levels. A possible explanation may be experimental, related to the fact that brain glycogen is extremely rapidly degraded with hypoxia (i.e. at sacrificing) (Hirase, Akther, Wang, & Oe, 2019), and there may be mechanisms which in that state immediately demobilize R5 leading to a relative ‘leveling-of-the-field’ of GYS activation between R6 and R5 deficient brains. Another possibility could be different types of interactions between laforin and R6 versus R5.
While R5 knockout eliminates skeletal muscle LBs (Turnbull et al., 2011), R6 knockout had no impact, unsurprising given its low expression (less than 1% of R5 levels) in this tissue. Expression of R5 dominates in skeletal muscle, with levels in mouse tenfold higher than the prototypical muscle-specific isoform Ppp1r3a, again suggesting that R5 is an overall housekeeping isoform. The situation is somewhat different in humans, where R5 is still the major isoform, but PPP1R3A is expressed at ~20% of R5 levels and PPP1R3B, the isoform that is known as, and largely is, liver-specific in mouse, at ~30% of R5 levels (Table 1).
R6 knockout significantly reduced LBs in the heart, consistent with the isoform’s significant expression (~25% of R5 levels) in that organ. Here again R5 expression is highest, though not overwhelmingly, with Ppp1r3a and Ppp1r3b expressed at 40%–60% of R5 levels. The expression distribution in human is similar to the murine in this case (Table 1).
5 |. CONCLUSION
Glycogen metabolism is under fine regulation, including through seven unique PP1 glycogen targeting subunits, five of which have significant expression in the brain. The roles of the specific subunits are not known, but their plurality suggests existence of fine glycogen level function-related bio-energetic control. Based on relative expression levels and the strong and widespread impact of its absence on LBs, R5 appears to be the housekeeping subunit. R6, on the other hand, appears to have a specialized niche in glycogen metabolism regulation in neurons and in the heart. Our study supports previous recent work that astrocytes are the locus of the vast majority of LBs and therefore disturbance in astrocytic glycogen metabolism and LB accumulation are at the root of LD.
ACKNOWLEDGEMENTS
This work was supported by the National Institute of Neurological Disorders and Stroke of the National Institutes of Health (NIH) under award number P01 NS097197. Berge A. Minassian holds the University of Texas Southwestern Jimmy Elizabeth Westcott Chair in Pediatric Neurology.
All experiments were conducted in compliance with the ARRIVE guidelines.
Funding information
National Institute of Neurological Disorders and Stroke, Grant/Award Number: P01 NS097197
Abbreviations:
- ANOVA
analysis of variance
- DKO
laforin/R6 double knockout
- FPKM
fragments per kilobase million FPKM
- FW
fresh weight
- G6P
glucose-6-phosphate
- GFAP
glial fibrillary acid protein
- GP
glycogen phosphorylase
- GYS
glycogen synthase
- Iba1
ionized calcium-binding adapter molecule 1
- IHC
immunohistochemistry
- LBs
Lafora bodies
- LD
Lafora disease
- LKO
Laforin knockout
- PASD
periodic acid-Schiff diastase
- PP1
protein phosphatase-1
- PPP1R3
protein phosphatase-1 regulatory subunit 3
- R5
protein phosphatase-1 regulatory subunit 3C
- R6
protein phosphatase-1 regulatory subunit 3D
- R6KO
R6 knockout
- TPM
transcripts per million
APPENDIX A
| Equation A.1. |
| Equation A.2. |
| Equation A.3. |
Footnotes
CONFLICT OF INTEREST
The authors report no conflicts of interest.
REFERENCES
- Armstrong CG, Browne GJ, Cohen P, & Cohen PT (1997). PPP1R6, a novel member of the family of glycogen-targetting subunits of protein phosphatase 1. FEBS Letters, 418, 210–214. 10.1016/S0014-5793(97)01385-9 [DOI] [PubMed] [Google Scholar]
- Auge E, Pelegri C, Manich G, Cabezon I, Guinovart JJ, Duran J, & Vilaplana J (2018). Astrocytes and neurons produce distinct types of polyglucosan bodies in Lafora disease. Glia, 66, 2094–2107. 10.1002/glia.23463 [DOI] [PMC free article] [PubMed] [Google Scholar]
- Barbosa-Morais NL, Irimia M, Pan Q, Xiong HY, Gueroussov S, Lee LJ, … Blencowe BJ (2012). The evolutionary landscape of alternative splicing in vertebrate species. Science, 338, 1587–1593. 10.1126/science.1230612 [DOI] [PubMed] [Google Scholar]
- Berthier A, Payá M, García-Cabrero AM, Ballester MI, Heredia M, Serratosa JM, … Sanz P (2016). Pharmacological interventions to ameliorate neuropathological symptoms in a mouse model of Lafora disease. Molecular Neurobiology, 53, 1296–1309. 10.1007/s12035-015-9091-8 [DOI] [PMC free article] [PubMed] [Google Scholar]
- Brewer MK, Uittenbogaard A, Austin GL, Segvich DM, DePaoli-Roach A, Roach PJ, … Gentry MS (2019). Targeting pathogenic Lafora bodies in Lafora disease using an antibody-enzyme fusion. Cell Metabolism, 30, 689–705. 10.1016/j.cmet.2019.07.002 [DOI] [PMC free article] [PubMed] [Google Scholar]
- Consortium GT (2015). Human genomics. The genotype-tissue expression (GTEx) pilot analysis: Multitissue gene regulation in humans. Science, 348, 648–660. 10.1126/science.1262110 [DOI] [PMC free article] [PubMed] [Google Scholar]
- Duran J, Gruart A, Garcia-Rocha M, Delgado-Garcia JM, & Guinovart JJ (2014). Glycogen accumulation underlies neurodegeneration and autophagy impairment in Lafora disease. Human Molecular Genetics, 23, 3147–3156. 10.1093/hmg/ddu024 [DOI] [PubMed] [Google Scholar]
- Ganesh S, Delgado-Escueta AV, Sakamoto T, Avila MR, Machado-Salas J, Hoshii Y, … Agarwala KL (2002). Targeted disruption of the Epm2a gene causes formation of Lafora inclusion bodies, neurodegeneration, ataxia, myoclonus epilepsy and impaired behavioral response in mice. Human Molecular Genetics, 11, 1251–1262. 10.1093/hmg/11.11.1251 [DOI] [PubMed] [Google Scholar]
- García-Cabrero AM, Sánchez-Elexpuru G, Serratosa JM, & Sánchez MP (2014). Enhanced sensitivity of laforin- and malin-deficient mice to the convulsant agent pentylenetetrazole. Front Neurosci, 8, 291. 10.3389/fnins.2014.00291 [DOI] [PMC free article] [PubMed] [Google Scholar]
- Hirase H, Akther S, Wang X, & Oe Y (2019). Glycogen distribution in mouse hippocampus. Journal of Neuroscience Research, 97, 923–932. 10.1002/jnr.24386 [DOI] [PubMed] [Google Scholar]
- Lahuerta M, Gonzalez D, Aguado C, Fathinajafabadi A, García-Giménez JL, Moreno-Estellés M, … Sanz P (2020). Reactive glia-derived neuroinflammation: A novel hallmark in Lafora progressive myoclonus epilepsy that progresses with age. Molecular Neurobiology, 57, 1607–1621. 10.1007/s12035-019-01842-z [DOI] [PMC free article] [PubMed] [Google Scholar]
- López-González I, Viana R, Sanz P, & Ferrer I (2017). Inflammation in Lafora disease: Evolution with disease progression in laforin and malin knock-out mouse models. Molecular Neurobiology, 54, 3119–3130. 10.1007/s12035-016-9884-4 [DOI] [PMC free article] [PubMed] [Google Scholar]
- Lowry OH, & Passonneau JV (1972). A flexible system of enzymatic analysis. New York, NY: Academic Press. [Google Scholar]
- Magistretti PJ, & Allaman I (2018). Lactate in the brain: From metabolic end-product to signalling molecule. Nature Reviews Neuroscience, 19, 235–249. 10.1038/nrn.2018.19 [DOI] [PubMed] [Google Scholar]
- Munro S, Ceulemans H, Bollen M, Diplexcito J, & Cohen PT (2005). A novel glycogen-targeting subunit of protein phosphatase 1 that is regulated by insulin and shows differential tissue distribution in humans and rodents. FEBS Journal, 272, 1478–1489. 10.1111/j.1742-4658.2005.04585.x [DOI] [PubMed] [Google Scholar]
- Nitschke F, Ahonen SJ, Nitschke S, Mitra S, & Minassian BA (2018). Lafora disease - from pathogenesis to treatment strategies. Nature Reviews. Neurology, 14, 606–617. 10.1038/s41582-018-0057-0 [DOI] [PMC free article] [PubMed] [Google Scholar]
- Nitschke F, Sullivan MA, Wang P, Zhao X, Chown EE, Perri AM, … Minassian BA (2017). Abnormal glycogen chain length pattern, not hyperphosphorylation, is critical in Lafora disease. EMBO Molecular Medicine, 9(7), 906–917. 10.15252/emmm.201707608 [DOI] [PMC free article] [PubMed] [Google Scholar]
- Pederson BA, Turnbull J, Epp JR, Weaver SA, Zhao X, Pencea N, … Minassian BA (2013). Inhibiting glycogen synthesis prevents Lafora disease in a mouse model. Annals of Neurology, 74, 297–300. 10.1002/ana.23899 [DOI] [PMC free article] [PubMed] [Google Scholar]
- Puri R, Toshimitsu S, Yamakawa S, & Ganesh S (2012). Dysfunctions in endosomal-lysosomal and autophagy pathways underlie neuro-pathology in a mouse model for Lafora disease. Human Molecular Genetics, 21, 175–184. 10.1093/hmg/ddr452 [DOI] [PubMed] [Google Scholar]
- Racine RJ (1972). Modification of seizure activity by electrical stimulation. II. Motor Seizure. Electroencephalography and Clinical Neurophysiology, 32, 281–294. 10.1016/0013-4694(72)90177-0 [DOI] [PubMed] [Google Scholar]
- Rai A, Mishra R, & Ganesh S (2017). Suppression of leptin signaling reduces polyglucosan inclusions and seizure susceptibility in a mouse model for Lafora disease. Human Molecular Genetics, 26, 4778–4785. 10.1093/hmg/ddx357 [DOI] [PubMed] [Google Scholar]
- Roach PJ (2002). Glycogen and its metabolism. Current Molecular Medicine, 2, 101–120. [DOI] [PubMed] [Google Scholar]
- Rubio-Villena C, Sanz P, & Garcia-Gimeno MA (2015). Structure-function analysis of PPP1R3D, a protein phosphatase 1 targeting subunit, reveals a binding motif for 14-3-3 proteins which regulates its glycogenic properties. PLoS One, 10, e0131476. 10.1371/journal.pone.0131476 [DOI] [PMC free article] [PubMed] [Google Scholar]
- Rubio-Villena C, Viana R, Bonet J, Garcia-Gimeno MA, Casado M, Heredia M, & Sanz P (2018). Astrocytes: New players in progressive myoclonus epilepsy of Lafora type. Human Molecular Genetics, 27, 1290–1300. 10.1093/hmg/ddy044 [DOI] [PMC free article] [PubMed] [Google Scholar]
- Sánchez-Elexpuru G, Serratosa JM, & Sánchez MP (2017). Sodium selenate treatment improves symptoms and seizure susceptibility in a malin-deficient mouse model of Lafora disease. Epilepsia, 58, 467–475. 10.1111/epi.13656 [DOI] [PMC free article] [PubMed] [Google Scholar]
- Sullivan MA, Nitschke S, Steup M, Minassian BA, & Nitschke F (2017). Pathogenesis of Lafora disease: Transition of soluble glycogen to insoluble polyglucosan. International Journal of Molecular Sciences, 18. 10.3390/ijms18081743 [DOI] [PMC free article] [PubMed] [Google Scholar]
- Tagliabracci VS, Girard JM, Segvich D, Meyer C, Turnbull J, Zhao X, … Roach PJ (2008). Abnormal metabolism of glycogen phosphate as a cause for Lafora disease. Journal of Biological Chemistry, 283, 33816–33825. 10.1074/jbc.M807428200 [DOI] [PMC free article] [PubMed] [Google Scholar]
- Turnbull J, DePaoli-Roach AA, Zhao X, Cortez MA, Pencea N, Tiberia E, … Minassian BA (2011). PTG depletion removes Lafora bodies and rescues the fatal epilepsy of Lafora disease. PLoS Genetics, 7, e1002037. 10.1371/journal.pgen.1002037 [DOI] [PMC free article] [PubMed] [Google Scholar]
- Valenzuela DM, Murphy AJ, Frendewey D, Gale NW, Economides AN, Auerbach W, … Yancopoulos GD (2003). High-throughput engineering of the mouse genome coupled with high-resolution expression analysis. Nature Biotechnology, 21, 652–659. 10.1038/nbt822 [DOI] [PubMed] [Google Scholar]
- Valles-Ortega J, Duran J, Garcia-Rocha M, Bosch C, Saez I, Pujadas L, … Gruart A (2011). Neurodegeneration and funcitonal impairments associated with glycogen synthase accumulation in a mouse model of Lafora disease. EMBO Molecular Medicine, 3, 667–681. [DOI] [PMC free article] [PubMed] [Google Scholar]
- Vandesompele J, De Preter K, Pattyn F, Poppe B, Van Roy N, De Paepe A, & Speleman F (2002). Accurate normalization of real-time quantitative RT-PCR data by geometric averaging of multiple internal control genes. Genome Biology, 3, RESEARCH0034. [DOI] [PMC free article] [PubMed] [Google Scholar]
- Vezzoli E, Calì C, De Roo M, Ponzoni L, Sogne E, Gagnon N, … Magistretti PJ (2020). Ultrastructural evidence for a role of astrocytes and glycogen-derived lactate in learning-dependent synaptic stabilization. Cerebral Cortex, 30, 2114–2127. 10.1093/cercor/bhz226 [DOI] [PMC free article] [PubMed] [Google Scholar]
- Zhang Y, Chen K, Sloan SA, Bennett ML, Scholze AR, O’Keeffe S, … Wu JQ (2014). An RNA-sequencing transcriptome and splicing database of glia, neurons, and vascular cells of the cerebral cortex. Journal of Neuroscience, 34, 11929–11947. 10.1523/JNEUROSCI.1860-14.2014 [DOI] [PMC free article] [PubMed] [Google Scholar]
- Zhang YE, Sloan SA, Clarke LE, Caneda C, Plaza CA, Blumenthal PD, … Barres BA (2016). Purification and characterization of progenitor and mature human astrocytes reveals transcriptional and functional differences with mouse. Neuron, 89, 37–53. 10.1016/j.neuron.2015.11.013 [DOI] [PMC free article] [PubMed] [Google Scholar]


