

Liquid superficial‐static culture was a better method to produce GA. Transcriptome dynamics analysis revealed CYP5150L8 was the key gene regulating lanosterol flux into GA biosynthesis. Other sixteen CYP450s genes were significantly higher‐expressed during the culture time in LSSC and could be potential candidate genes associated with the biosynthesis of different GAs.
Summary
Ganoderic acid (GA), an important secondary metabolite of Ganoderma lucidum, exhibited many significant pharmacological activities. In this study, the biosynthetic mechanism of GAs was investigated by comparing metabolites and transcriptome dynamics during liquid superficial‐static culture (LSSC) and submerged culture (SC). LSSC was a better method to produce GA because thirteen GAs were identified from mycelia by UPLC‐QTOF‐MS, and the content of all GAs was higher in LSSC than in SC. Ergosterol was accumulated during the SC process in G. lucidum. Transcriptome dynamics analysis revealed CYP5150L8 was the key gene regulating lanosterol flux into GA biosynthesis. Other sixteen CYP450 genes were significantly higher expressed during the culture time in LSSC and could be potential candidate genes associated with the biosynthesis of different GAs. In addition, six of the ten expressed genes in ergosterol biosynthetic pathway shown upregulated at some time points in SC. These results not only provide a fundamental information of the key genes in ergosterol and GA biosynthetic pathway, but also provide directions for future elucidating the regulatory mechanisms of GAs in G. lucidum and enabling us to promote the development and utilization of LSSC at the industrial level.
Introduction
Ganoderma lucidum is a well‐known edible and medicinal mushroom in China and also draw more attention in other parts of the world recently (Bishop et al., 2015; Pharmacopoeia Commission of People’s Republic of China, 2015; Wang et al., 2018; Wu et al., 2019). Ganoderic acid (GA), classified as a kind of triterpenoid, is well recognized as the main and specific bioactive compound in G. lucidum (Bishop et al., 2015). More than 170 GAs had been isolated from Ganoderma species (Baby et al., 2015). According to the carbon skeletons, there were two types of GAs: type I had only one double bond in the lanostane skeleton, and type II possessed two conjugated double bonds in the tetracyclic rings (Hirotani et al., 1987; Nishitoba et al., 1987; Li et al., 2013). It was reported that several individual GAs had important biological and pharmacological activities, such as antitumor, antimetastasis and anti‐HIV activities (Li et al., 2013; Bishop et al., 2015; Gill et al., 2016; Wu et al., 2019). As a result, the Ganoderma bioactive substances are consumed worldwide nowadays as a kind of health tonic and dietary supplement, and resulted in a boom of commercial market needs (Xu et al., 2008; Wang et al., 2018).
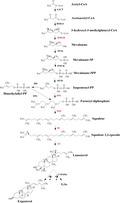
Ganoderic acid biosynthesis could be divided into two modules in G. lucidum: lanosterol and GA biosynthesis. As shown in Fig. 1, lanosterol is synthesized via the mevalonate/isoprenoid pathway (MVA) from acetyl‐CoA (Xu et al., 2010b). There are 11 enzymes encoded by 13 genes in lanosterol biosynthetic pathway in G. lucidum (Chen et al., 2012), for that acetyl‐CoA C‐acetyltransferase (AACT) and farnesyl diphosphate synthases (FPS) each are encoded by two genes in the G. lucidum genome. The genes involved in the lanostane skeleton biosynthesis pathway, such as encoding AACT, hydroxymethylglutaryl‐CoA (HMGS), 3‐hydroxy‐3‐methylglutaryl coenzyme A reductase (HMGR), mevalonate pyrophosphate decarboxylase (MVD), isopentenyl diphosphate isomerase (IDI), FPS, squalene synthase (SQS) and lanosterol synthase (LS), were cloned from G. lucidum (Zhao et al., 2007; Ding et al., 2008; Shang et al., 2008, 2010; Shi et al., 2012; Fang et al., 2013; Ren et al., 2013; Wu et al., 2013). Overexpression of genes encoding HMGR, FPS, SQS, squalene epoxidase (SE) and LS, which are considered as the major regulatory point, could enhance GA production (Xu et al., 2012; Zhou et al., 2014; Zhang et al., 2017a, b; Fei et al., 2019). Nevertheless, details regarding the later steps to biosynthesize the individual GAs, including the cyclization, oxidation and reduction reactions, are unclear. In addition, ergosterol, an important component of fungal membranes, is also synthesized from lanosterol (Dupont et al., 2012). However, to the best of our knowledge, the mechanism of lanosterol flux regulation had not been reported in G. lucidum, and the elucidation of this mechanism would be an important development in GA research.
Fig. 1.
Lanosterol biosynthetic pathways and the major regulatory point in Ganoderma lucidum. The enzymes with red font were reported that overexpression of genes encoding these enzymes could enhance GA production. So they are considered as the major regulatory point.
Cytochrome P450 monooxygenases (CYP450s) are considered to be responsible for the cyclization step from lanosterol to biosynthesize the individual GAs (Wang et al., 2018). A total of 219 CYP450 genes were identified in the released genome information, and 78 CYP450 genes were coexpressed with LS during different developmental stages in G. lucidum (Chen et al., 2012). CYP5150L8 was considered as the first CYP450 that related to the biosynthesis of GA in G. lucidum, and it could catalyse lanosterol to form 3‐hydroxy‐lanosta‐8,24‐dien‐26‐al (HLDA) by three successive steps of C‐26 oxidation (Wang et al., 2018; Lan et al., 2019). Yang et al. (2018) cloned and characterized the CYP512U6 gene from G. lucidum, and found CYP512U6 could hydroxylate the GAs DM and TR at the C‐23 position to produce hainanic acid A and GA Jc respectively. Recently, Xu et al. (2019) reported that CYP5150L8, CYP512A2, CYP512V2 and CYP512A13 genes were associated with the oxidative modification of the lanostane skeleton in GA biosynthesis and that the transcription levels of these genes were increased in a GA high‐yielding strain.
As a powerful tool to analyse differentially expressed genes (DEGs), transcriptome sequencing, or RNA‐Seq, has been used widely in studying specific biological processes of G. lucidum, such as heat stress response, nitric oxide response, copper‐induced and L‐phenylalanine enhancer effects (Gu et al., 2017; Tan et al., 2018; Ma et al., 2019; Jain et al., 2020). In addition, many studies also focused on the triterpenoid biosynthesis analysis through transcriptome sequencing in G. lucidum and other mushrooms (Xu et al., 2013; Gu et al., 2017; Wang et al., 2019). However, the transcriptome dynamic behaviour during G. lucidum growth, which could reflect specific phenomenon for triterpenoid and GA biosynthesis, was largely unknown. To get deeper insight into GA biosynthesis, here GAs and transcriptomic differences were investigated under liquid superficial‐static culture (LSSC) and submerged culture (SC) in G. lucidum. The GAs were identified by UPLC‐QTOF‐MS. The candidate genes and regulatory mechanisms of GA biosynthesis were performed by transcriptome dynamic analysis under the two culture methods.
Results
Effect of culture methods on triterpenoid and ergosterol production in G. lucidum
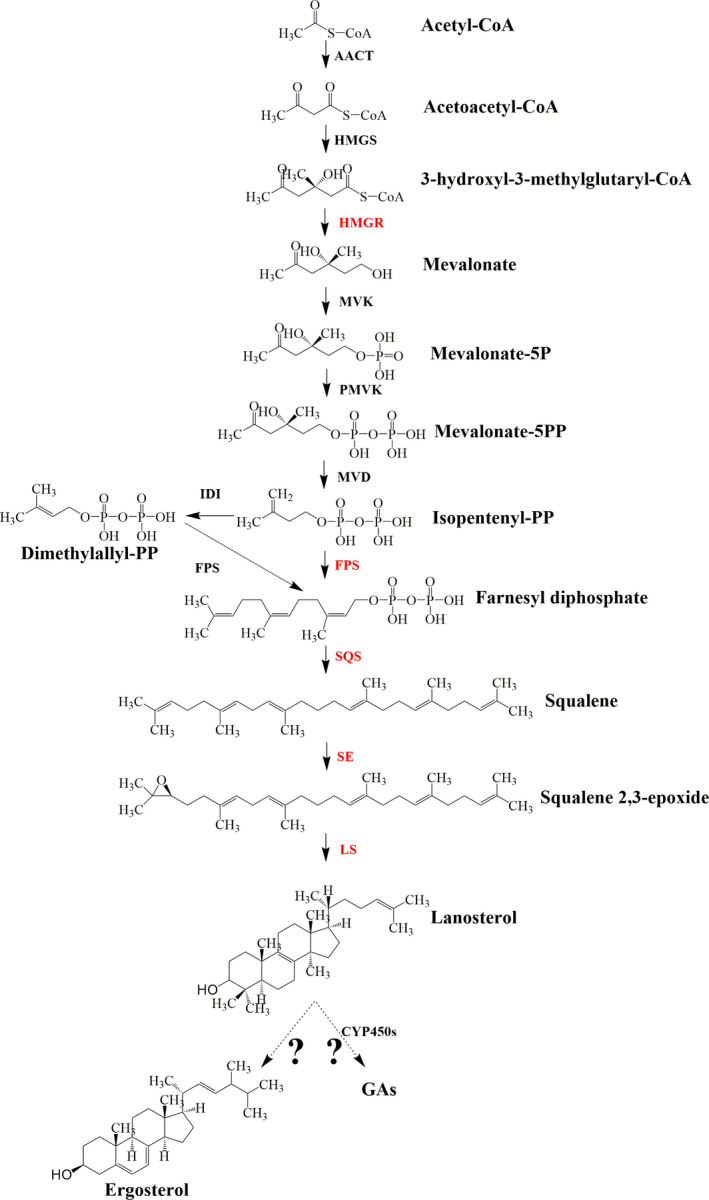
Liquid superficial‐static culture and SC were compared by measuring biomass, triterpenoid and ergosterol production during the culture time (Fig. 2). The mycelia grew faster in LSSC than in SC. The maximal triterpenoid production of 23.75 ± 0.60 mg g−1 was obtained in LSSC on the eighth day, which was 1.87‐fold higher than the maximum in SC on the fifth day. The ergosterol content in SC was higher than in LSSC, and the maximum was 9.48 ± 0.2 mg g−1 on the sixth day. The peak value of ergosterol in LSSC was 5.91 ± 0.15 mg g−1 on the fifth day.
Fig. 2.
Effect of the culture method on Ganoderma lucidum biomass (A), triterpenoid (B) and ergosterol (C) production.
GA identification and analysis
To compare the metabolic profiles of G. lucidum in different culture methods, six samples at three time points, namely the 4th, 6th and 8th days, in SC (SC‐4, SC‐6, SC‐8) and LSSC (LSSC‐4, LSSC‐6, LSSC‐8) were designated and characterized by UPLC‐QTOF‐MS analysis (Fig. S1). VIP values were calculated for each altered metabolite and set as the cut‐off points for all metabolites obtained from the UPLC‐QTOF‐MS analysis. The metabolites that had VIP values > 2 and P‐value < 0.05 were considered the most relevant ones for the two culture methods. In this study, 13 different GAs were detected and identified based on the observed molecular and fragment ions, retention times and UV characteristics (Table 1). Then, these GAs were further confirmed according to the databases and references (Table S2). Among the 13 GAs, there were 10 type I GAs and 3 type II GAs. All 13 GAs were significantly enriched in LSSC mycelia according to the base peak intensity (BPI), VIP and P‐value (Table 1).
Table 1.
Identification, BPI, VIP values and P‐values of GAs under the two culture methods of Ganoderma lucidum.
| NO. | Ret. Time | [M‐H]‐ m/z | UV (254 nm) | BPI | VIP pred | P‐value | Identification | Type | |||||
|---|---|---|---|---|---|---|---|---|---|---|---|---|---|
| SC‐4 | SC‐6 | SC‐8 | LSSC‐4 | LSSC‐6 | LSSC‐8 | ||||||||
| 1 | 14.25 | 629.2894 | + | 43.88 | 2.17 | 31.41 | 322.88 | 197.76 | 182.01 | 5.87 | 1.08E‐02 | Ganoderic acid Mb/Mc a | I |
| 2 | 15.47 | 571.2916 | + | 2.53 | 0.00 | 0.00 | 173.47 | 180.28 | 157.52 | 5.52 | 1.53E‐05 | Ganoderic acid Ma/W a | I |
| 3 | 14.71 | 643.3068 | + | 2.74 | 0.00 | 1.09 | 185.25 | 148.72 | 122.02 | 5.14 | 1.20E‐03 | 7‐O‐methyl ganoderic acid O | I |
| 4 | 14.93 | 569.2788 | + | 0.00 | 0.00 | 0.00 | 125.27 | 157.62 | 148.38 | 5.07 | 1.17E‐04 | Ganoderic acid Q | II |
| 5 | 14.41 | 587.2913 | + | 1.22 | 0.00 | 0.00 | 141.82 | 128.48 | 123.70 | 4.85 | 1.76E‐05 | Ganoderic acid Mh | I |
| 6 | 15.65 | 571.3004 | + | 0.00 | 0.00 | 0.00 | 94.93 | 133.16 | 125.56 | 4.56 | 5.43E‐04 | Ganoderic acid Ma/W a | I |
| 7 | 14.47 | 629.3060 | + | 0.00 | 0.00 | 1.00 | 103.77 | 120.29 | 115.16 | 4.50 | 2.10E‐05 | Ganoderic acid Mb/Mc a | I |
| 8 | 15.30 | 611.2816 | + | 15.91 | 28.11 | 4.46 | 250.62 | 193.31 | 169.07 | 4.26 | 1.70E‐03 | Ganoderic acid T | II |
| 9 | 15.97 | 585.3181 | + | 0.00 | 0.00 | 0.00 | 75.90 | 103.45 | 89.40 | 3.99 | 3.54E‐04 | Ganoderic acid Md | I |
| 10 | 16.50 | 553.2908 | + | 0.00 | 14.87 | 0.00 | 68.01 | 110.97 | 114.65 | 3.98 | 4.15E‐03 | Ganoderic acid R | II |
| 11 | 14.58 | 527.2855 | + | 0.00 | 0.00 | 0.00 | 53.15 | 85.30 | 72.61 | 3.50 | 1.67E‐03 | Ganoderic acid V | I |
| 12 | 12.44 | 543.2775 | + | 0.00 | 0.00 | 0.00 | 36.84 | 62.04 | 51.93 | 2.95 | 2.36E‐03 | Ganoderic acid Mi | I |
| 13 | 14.59 | 601.3106 | + | 0.00 | 0.00 | 0.00 | 86.85 | 66.85 | 22.44 | 2.60 | 1.10E‐02 | Ganoderic acid Mg | I |
BPI, base peak intensity; VIP, variable importance for the projection.
The two ganoderic acids were indistinguishable, but it did not affect the analysis of the result.
Transcriptome sequencing and gene expression dynamic analysis of G. lucidum in LSSC and SC
To reveal the candidate genes and regulatory mechanism of GA biosynthesis under the two culture methods, transcriptome sequencing was performed from the 4th to 8th days in LSSC (samples LSSC‐4 to LSSC‐8) and SC (samples SC‐4 to SC‐8). Because of a low‐quality RNA, the LSSC‐6 had only two biological replicates. After redundant and short reads were filtered out, the number of reads per library ranged from 40 356 482 to 46 577,572 and from 42 954 950 to 52 910 016 in LSSC and SC respectively (Table S3). All Q20 percentages for the sequences in the 29 libraries were over 98%. All GC levels were between 58.51 and 59.92%. Over 61% of the reads could be mapped to the genome of the G. lucidum strain 260125 for each sample.
Differentially expressed gene (DEG) dynamic analysis
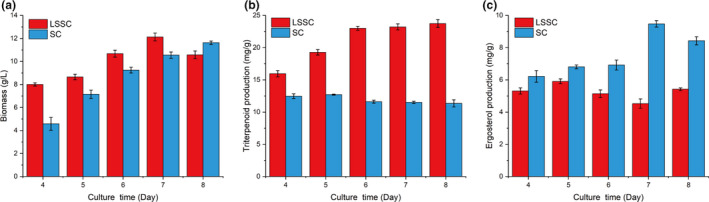
Comparative transcriptome analysis was performed to identify the differentially expressed genes (DEGs) between LSSC and SC at different cultural time. Under the threshold value of |log2 fold change| > 1 and q‐value < 0.005, the DEGs were identified and illustrated in Fig. 3A and Table S4. Comparisons of the samples showed that there were more upregulated DEGs in SC than in LSSC at the fourth and eighth days. However, more DEGs were upregulated in LSSC from day 5 to day 7 than SC, that was 647, 557 and 51 upregulated DEGs in LSSC. Overall, although the numbers of DEGs were different during the culture time, 303 DEGs were shared at each time point (Fig. 3B). Among all the DEGs, 438 DEGs were common under both conditions, and 2639 DEGs upregulated and 2125 DEGs downregulated in LSSC (Fig. 3C).
Fig. 3.
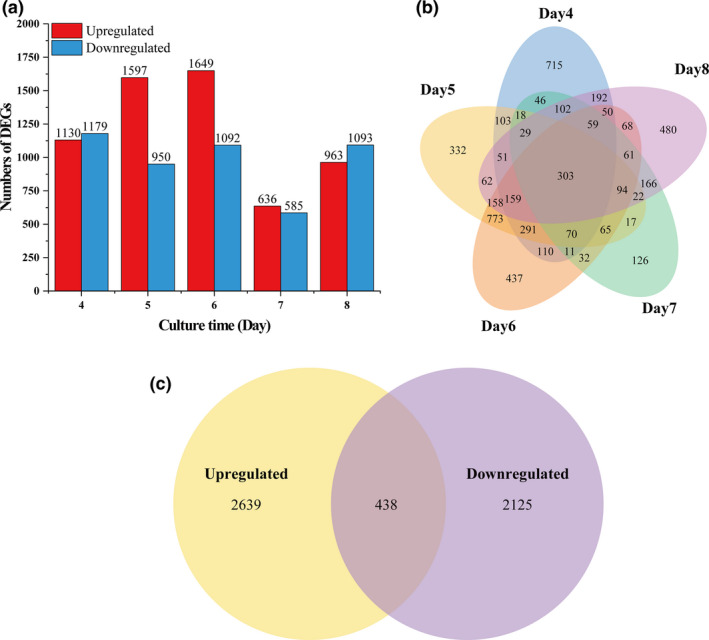
The differentially expressed genes (DEGs) between LSSC and SC. A: The number of DEGs from day 4 to day 8, B: Venn diagram of the DEG number from day 4 to day 8. C: Venn diagram of all DEG number during the culture time.
KEGG and GO enrichment analysis of the DEGs
All the DEGs were mapped to the KEGG database in order to further understand the putative active biological pathways. The top 20 enriched pathways are shown in Fig. 4. ‘Folate biosynthesis’ and ‘Amino sugar and nucleotide sugar metabolism’ pathways were both enriched in LSSC and SC. In addition, the enriched pathways in LSSC were mainly associated with the primary metabolism such as amino acid, sugar and fatty acid metabolism. However, nucleic acid metabolism pathways (including ‘Cell cycle ‐ yeast’, ‘DNA replication’, ‘Ribosome’, ‘Meiosis ‐ yeast’, ‘Aminoacyl‐tRNA biosynthesis’, ‘Mismatch repair’) were more active in SC. Interestingly, ‘Steroid biosynthesis’ pathway was associated with ergosterol biosynthesis.
Fig. 4.
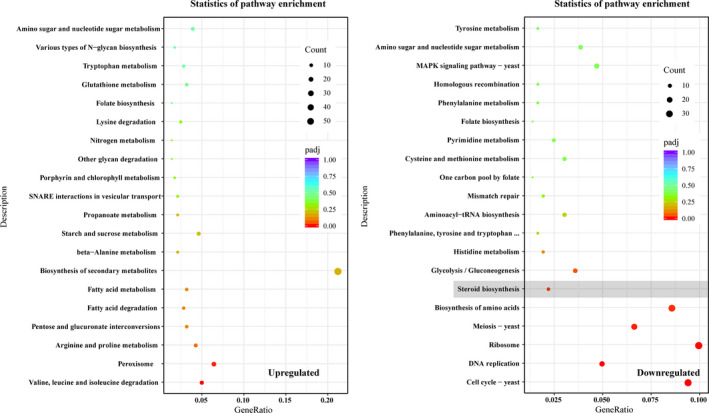
Statistics of KEGG pathway enrichment. The top 20 enriched pathways were shown. The left is the KEGG analysis of 2639 upregulated genes in LSSC. The right is the KEGG analysis of 2125 downregulated genes in LSSC.
In addition, the GO enrichment analysis was also performed. As shown in Fig. S2, the upregulated DEGs in LSSC were grouped into three functional categories: biological processes, cellular components and molecular functions. The most significantly enriched GO terms in three functional categories were ‘carbohydrate metabolic process’ (GO:0005975), ‘integral component of membrane’ (GO:0016021) and ‘hydrolase activity’ (GO:0004553) respectively. For downregulated DEGs, the enriched GO terms in three functional categories were ‘DNA replication’ (GO:0006260), ‘organelle’ (GO:0043226) and ‘DNA binding’ (GO:0003677). However, there were no enriched GO terms associated with ergosterol and GA biosynthesis.
DEGs involved in the ergosterol biosynthetic pathway
In fungi, lanosterol is an intermediate metabolite which could produce GAs and ergosterol. According to the gene functional annotation of the G. lucidum genome, there were 10 enzymes encoded by 11 genes to synthetize ergosterol from lanosterol. The DEGs involved in the ergosterol biosynthetic pathway during the culture time are shown in Fig. 5. In lanosterol biosynthetic pathway (Fig. 5 left), AACT is encoded by two genes in the G. lucidum genome. AACT‐1 was upregulated at days 5 and 6 in LSSC. The HMGR gene was upregulated on the fifth and sixth days and downregulated at the later stage. FPS were also encoded by two genes, and FPS‐1 genes were highly expressed in the LSSC; however, the FPKM (fragments per kilobase of transcript sequence per millions) value of FPS‐1 was lower than that of FPS‐2. In addition, there were four days when SE was downregulated in LSSC. In ergosterol biosynthetic pathway (Fig. 5 right), the first enzyme was ERG11 which is also encoded by two genes in the G. lucidum genome. In this study, ERG11‐2 was not expressed (FPKM < 1), and ERG11‐1 gene was higher expressed during the culture period in SC. In addition, ERG25 and ERG5 were upregulated at days 4, 7 and 8 in SC. The expression level of ERG3 was increased during SC process. ERG6, ERG3 and ERG4 were also upregulated at someday in SC. The other genes were not expressed differently under the two culture methods. The FPKM value of all the genes involved in the ergosterol biosynthetic pathway during culture time is shown in Table S5‐1.
Fig. 5.
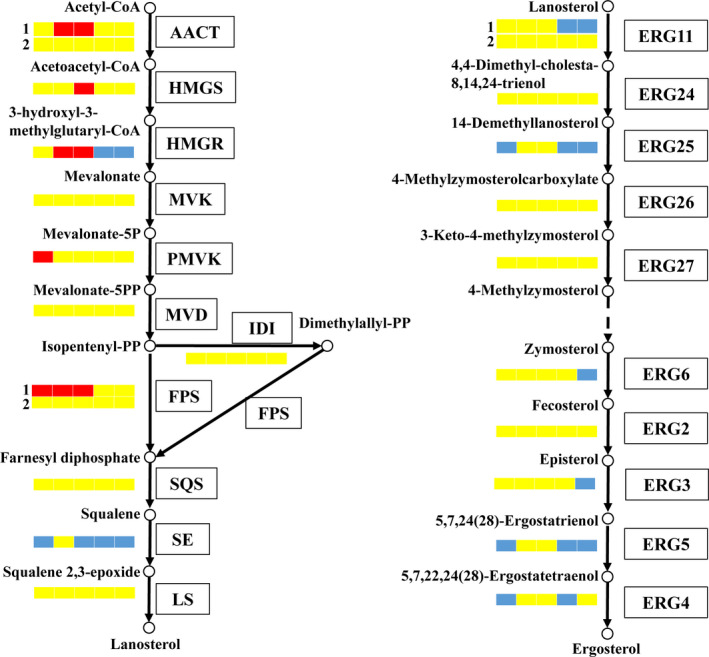
DEGs involved in the ergosterol biosynthetic pathway in Ganoderma lucidum (red: LSSC upregulated; yellow: not DEGs; and blue: LSSC downregulated).
DEGs of CYP450s associated with GA biosynthesis
Cytochrome P450 monooxygenases (CYP450s) were considered to be responsible for catalysing the conversion of lanosterol to GAs. According to the literature (Wang et al., 2018), 82 CYP450 genes were selected as candidates for the investigation. In this study, only one gene (CYP5035U1) was not expressed. The FPKM values of CYP450 genes associated with GA biosynthesis are shown in Table S5‐2. According the DEG numerical statement, twenty‐seven CYP450 genes were selected as the significant genes which were differentially expressed for at least three days during the culture time (Table 2). Based on the family classification (Syed et al., 2013), CYP512, CYP5150 and CYP5359 families had 7, 6 and 9 genes respectively. Further, among the twenty‐seven CYP450 genes, 10 genes (CYP5035L2, CYP512A13, CYP512U5, CYP5150J10, CYP5150L8, CYP5140A3, CYP5359A3, CYP5359L1, CYP5359Q1 and CYP5359W2) were upregulated, and 1 gene (CYP5151A4) was downregulated from day 4 to day 8 in LSSC. In addition, CYP5150J1, CYP5150K3, CYP512U4, CYP512U7, CYP512V2, CYP5359A5 and CYP5359L3 were significant upregulated genes in LSSC. CYP5150L4, CYP5035K1, CYP61A1, CYP512X1 and CYP5359R1 were significant downregulated genes in LSSC. Interestingly, CYP51F1 and CYP61A1 were also annotated as ERG11‐1 and ERG5 respectively.
Table 2.
The DEGs of CYP450s associated with GA biosynthesis under the two culture methods of Ganoderma lucidum.
| CYP450 Gene | Culture time (day) | ||||
|---|---|---|---|---|---|
| 4 | 5 | 6 | 7 | 8 | |
| CYP5150J1 | / | / | +1.36 | +2.62 | +1.74 |
| CYP5150J10 | +2.14 | +3.08 | +4.14 | +5.76 | +5.18 |
| CYP5150K3 | +1.30 | +2.89 | +2.94 | / | +1.12 |
| CYP5150L8 | +2.91 | +4.19 | +4.77 | +4.44 | +5.14 |
| CYP5035L2 | +1.73 | +2.06 | +2.03 | +1.24 | +1.44 |
| CYP512A13 | +1.19 | +2.25 | +3.98 | +1.95 | +1.02 |
| CYP512U4 | / | / | +1.09 | +1.11 | +1.24 |
| CYP512U5 | +1.89 | +1.89 | +3.35 | +2.82 | +2.99 |
| CYP512U7 | / | +1.81 | +2.29 | +2.37 | +1.85 |
| CYP512V2 | +4.10 | +3.47 | +4.68 | / | +3.04 |
| CYP5140A3 | +2.36 | +6.95 | +6.31 | +2.83 | +4.05 |
| CYP5359A3 | +1.70 | +2.91 | +2.92 | +4.53 | +3.98 |
| CYP5359A5 | +2.38 | +1.97 | +2.21 | / | +1.41 |
| CYP5359L1 | +1.28 | +1.48 | +1.63 | +2.27 | +2.75 |
| CYP5359L3 | +2.78 | +1.55 | / | / | +1.45 |
| CYP5359Q1 | +2.39 | +1.38 | +2.01 | +2.32 | +2.75 |
| CYP5359W2 | +1.98 | +1.85 | +2.29 | +2.58 | +3.44 |
| CYP5151A4 | −1.07 | −1.61 | −2.23 | −1.15 | −1.56 |
| CYP5035K1 | −2.38 | −2.67 | −2.38 | / | −1.05 |
| CYP5150L4 | −2.76 | / | / | −1.75 | −1.89 |
| CYP61A1 | −1.27 | / | / | −2.06 | −1.87 |
| CYP512X1 | / | −1.40 | −1.80 | −2.05 | −2.01 |
| CYP5359R1 | −1.06 | −1.30 | −1.24 | / | / |
| CYP5150L1 | −1.48 | +1.64 | +1.09 | / | / |
| CYP512A2 | −1.07 | / | / | +2.20 | +2.63 |
| CYP5359G1 | −1.18 | / | −1.04 | / | +1.05 |
| CYP5359T1 | 1.25 | / | −1.01 | / | +1.07 |
+, upregulated; −, downregulated; /, not DEG.
RT‐qPCR analysis
Lanosterol synthase could catalyse the biosynthesis of lanosterol, and reported it was a key gene for GA production (Shang et al., 2010; Xu et al., 2010a; Zhang et al., 2017b). However, the expression of LS was not different significantly under the two groups in transcriptome. ERG 11‐1 (CYP51F1) and CYP5150L8 are the first gene regulating lanosterol flux into ergosterol and GA biosynthesis respectively. ERG 11‐1 was downregulated on days 7 and 8 in LSSC. Notably, CYP5150L8 was upregulated from day 4 to day 8 in LSSC. The transcription levels of CYP512A2, CYP512V2 and CYP512A13 were increased in a GA high‐yield Ganoderma sp (Xu et al., 2019). CYP512V2 and CYP512A13 were significant upregulated genes in LSSC; however, CYP512A2 was downregulated on fourth day and upregulated on seventh and eighth day. To validate the transcriptome analysis, LS, ERG11‐1 (CYP51F1), CYP5150L8 and CYP512A2 were selected to assess the expression dynamic under the two culture methods by RT‐qPCR (Fig. 6). LS was upregulated on day 5, and the expression levels on other time points were not significant difference (P > 0.05). In addition, ERG11‐1 (CYP51F1) was downregulated on days 7 and 8 in LSSC, and CYP5150L8 was always upregulated during LSSC culture time. CYP512A2 was downregulated on the sixth day and upregulated on seventh and eighth day in LSSC. For LS, ERG11‐1 (CYP51F1), CYP5150L8 and CYP512A2, the transcriptional changes obtained by RT‐qPCR were in accordance with those obtained in the transcriptome.
Fig. 6.
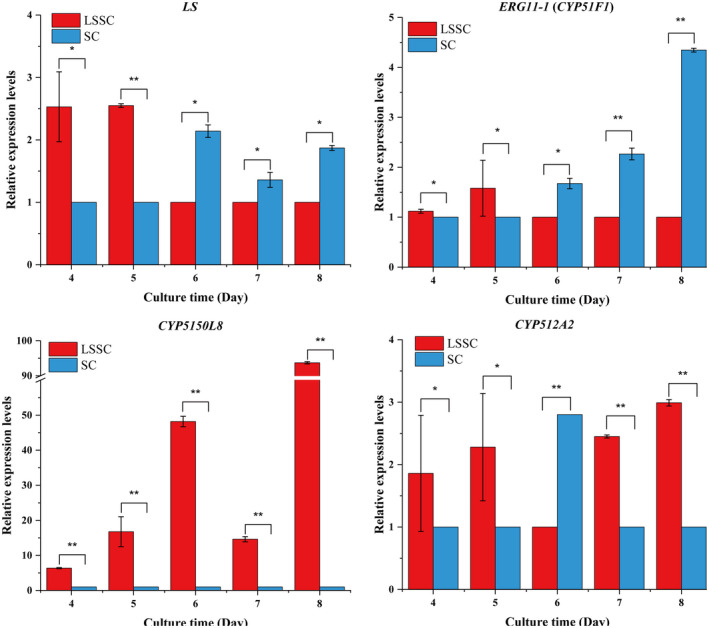
RT‐qPCR analysis of genes associated with GA biosynthesis in Ganoderma lucidum. The significantly analysis used the low‐expressed group as a reference (**: |log2fold change| > 1 and P < 0.05; *: no significance). The fold change is denoted the ratio of the transcription level in the high‐expressed group to that in the low‐expressed group.
Discussion
Liquid superficial‐static culture has been shown to be an efficient strategy to produce G. lucidum GAs and total triterpenoid. In SC, ergosterol was the major triterpenoid, and the content was higher than that in LSSC. However, the synthesis and regulation mechanisms of ergosterol and GAs remain elusive. In this study, 13 individual GAs were identified, and all of these GAs were accumulated in LSSC compared with SC. Additionally, transcriptome dynamics analysis revealed a set of key factors for ergosterol and GA synthesis and regulation.
Ganoderic acids are synthesized via the MVA pathway in G. lucidum. Lanosterol was the common cyclic intermediate of triterpenoids and ergosterol in G. lucidum, with different metabolic pathways diverging from this compound. In this study, we investigated the expression levels of the related genes in the lanosterol biosynthesis pathway. AACT played a fundamental role in the lanosterol biosynthesis pathway because it was the first step that AACT could catalyse the formation of acetoacetyl‐CoA (Fang et al., 2013). However, only AACT‐1 gene expressed differently on fifth and sixth days which was upregulated in LSSC that meant it may be a regulated gene for total triterpenoid biosynthesis. HMGR was also recognized as a key point for GA biosynthesis, because the transcription levels of HMGR were increased in a GA high‐yield Ganoderma sp (Xu et al., 2010a, 2019), and ganoderic triterpenoid content was increased in the HMGR overexpressed strain (Xu et al., 2012). In this study, HMGR gene was upregulated on days 5 and 6; however, it was downregulated in the next two days. Farnesyl diphosphate is located at the first multiple‐branch point in the isoprenoid biosynthetic pathway, and the changes of FPS activity could affect the flux of isoprenoid compounds through these various pathways (Ding et al., 2008). FPS was also encoded by two genes, and the FPKM value of FPS‐2 was higher than that of FPS‐1. In G. lucidum, FPS gene, actually it is FPS‐2 gene, overexpression was an effective strategy to improve the production of GAs (Fei et al., 2019). Although FPS‐1 gene had a low expression level, it was upregulated from day 4 to day 6 in LSSC which meant it need to be further study for the role in triterpenoid biosynthetic pathway. SE, also called squalene monooxygenase, can catalyse the first oxygenation step in lanosterol biosynthesis by converting squalene to 2,3‐oxidosqualene (Zhang et al., 2017a). In LSSC, the SE gene was downregulated during the culture time except for day 5; however, this did not affect triterpenoid production. An earlier reported had found the opposite that overexpression of the SE gene could produce approximately 2 times more GA than the wild type (Zhang et al., 2017a). In addition, SQS and LS genes are associated with GA production (Xu et al., 2010a). However, these genes did not show significant differences under the two culture methods. These results indicated that the GA synthesis and regulatory mechanism in LSSC were unlike in other reports, and the AACT‐1 gene and FPS‐1 genes may be the regulatory genes in the lanosterol biosynthetic pathway under the LSSC method to produce triterpenoid and GAs. In addition, the genetic editing with CRISPR has been reported in G. lucidum. Wang et al. (2020) constructed a CRISPR/CRISPR‐associated protein‐9 nuclease (Cas9) editing system and investigated the effect of different gRNA constructs with endogenous u6 promoter and self‐cleaving ribozyme HDVon ura3 disruption efficiency. Using this genome editing platform, CYP5150L8 and two CRZ genes were disrupted to reveal their function in GA biosynthetic pathway (Li and Zhong, 2020; Wang et al., 2020). Liu et al. (2020) improved the CRISPR/Cas9‐mediated gene disruption frequency in G. lucidum by adding an intron upstream of the Cas9 gene and achieved the genomic fragment deletions via a dual sgRNA‐directed CRISPR/Cas9 system in G. lucidum. So the detail regulatory mechanism of the key DEGs which obtained from this study needs to be further investigated by genetic editing.
Ergosterol is an important product of a long multistep biosynthetic pathway and is derived from lanosterol. However, few studies were focused on the ergosterol synthesis pathway in G. lucidum. In the G. lucidum genome, 11 genes encoding 10 enzymes were identified in the ergosterol biosynthetic pathway. Lanosterol 14‐demethylase is the first enzyme encoded by two ERG11 genes that catalysed the lanosterol to form ergosterol. The encoded protein is a cytochrome P450, which is also known as CYP51F1 (Ceita et al., 2014). In some pathogenic fungi, lanosterol 14‐demethylase, as a key enzyme in the ergosterol biosynthetic pathway in fungi, was used as a target for antifungals (Alcazar‐Fuoli and Mellado, 2013). Therefore, this protein plays a central role in the regulation of lanosterol flux. In this study, expression analysis of the two ERG11 genes showed diametrically different results that ERG‐2 gene was not expressed under the different culture methods. The FPKM value of ERG11‐1 was much higher in SC than in LSSC. Furthermore, the ERG11‐1 gene was upregulated in SC on days 7 and 8, and the transcript profile according to RT‐qPCR correlated with the transcriptome profiling data. These results indicated that ERG11‐1 was the key gene regulating lanosterol flux into ergosterol biosynthesis. The ERG25, ERG5 and ERG4 genes were also upregulated at last two days and ERG3 had a higher FPKM value in SC during the culture period. Like ERG11‐1, ERG5 is a CYP450 family gene (CYP61A1) and both of them require the hemoprotein Dap1 for full activity (Hughes et al., 2007). ERG25 and ERG3 encode oxodiiron enzymes of the fatty acid hydroxylase/sterol desaturase family (Shakoury‐Elizeh et al., 2010), indicating that the genes had similar regulatory mechanisms. Six of the ten expressed genes in ergosterol biosynthetic pathway shown upregulated at some time points in SC, and the results illustrated that SC was favourable to produce ergosterol.
CYP450s are considered responsible for catalysing the conversion of lanosterol to GA in G. lucidum (Wang et al., 2018; Yang et al., 2018). As the first characterized CYP450, the CYP5150L8 gene was highly expressed in G. lucidum in LSSC during the culture time, and it was also upregulated in RT‐qPCT analysis. In the case of a CYP5150L8 disruptant, amounts of four GAs were significantly reduced which indicated that the CYP5150L8 gene was essential for the overall pathway of GA biosynthesis from lanosterol in G. lucidum (Wang et al., 2018, 2020). Additionally, a high number of type I GAs were synthesized in LSSC. The results indicated that the upregulation of the CYP5150L8 gene directed lanosterol flux towards GA biosynthesis, especially type I GA. Syed et al. (2014) reported that CYP5150 family member P450s played a key role both in xenobiotic compound oxidation and fungal primary and secondary metabolism. In Thanatephorus cucumeris, CYP5150A family P450 enzymes were steroidal hydroxylases (Lu et al., 2019). In this study, CYP5150J1, CYP5150J10 and CYP5150K3 genes were also highly expressed in LSSC, which clearly suggested that these CYP450 genes in G. lucidum might also possess hydroxylase activity and associate with GA biosynthesis. In G. lucidum, CYP512 family enzymes were hypothesized to biosynthesize triterpenoids (Chen et al., 2012). The CYP512A2, CYP512V2 and CYP512A13 genes were upregulated in a high‐GA‐yield strain (Xu et al., 2019). Notably, the expression of the CYP512V2 and CYP512A13 genes was also higher in LSSC than in SC. Moreover, the CYP512U4, CYP512U5 and CYP512U7 genes were highly expressed in LSSC, which should be further studied. The differences in expression of CYP512 family genes in G. lucidum might explain the variety of individual GAs observed in this study. CYP5140 family has only 1 sequence (CYP5140A3) in Ganoderma (Kües et al., 2015). The CYP5359 family is a newly identified family in Ganoderma sp. and is exclusively present and highly enriched in Ganoderma sp (Syed et al., 2014). Although the detail functions of many CYP450s are unknown, our research narrowed the selections of GA biosynthesis associated CYP450s.
In this work, we identified thirteen GAs from G. lucidum mycelia by UPLC‐QTOF‐MS, and the content of all GAs was higher in LSSC than in SC. By combining the dynamic analysis of DEGs associated with GA biosynthesis, we found CYP5150L8 was the key gene regulating lanosterol flux into GA biosynthesis, and other sixteen CYP450 genes could be potential candidate genes associated with the biosynthesis of different GAs. In addition, ergosterol was accumulated during the SC process, and six of the ten expressed genes in ergosterol biosynthetic pathway shown upregulated at some time points in SC. This study not only provides a general picture of ergosterol and GA biosynthesis, but also highlights the key CYP450 genes associated with GA biosynthesis. However, the detail regulatory mechanism of the key DEGs obtained from this study needs to be further investigated in the future by gene disruption or chemical inhibitors. Meanwhile, for the utilization of LSSC at the industrial level is also need to use the low‐cost complex media. We believe the conclusion obtained from this study is helpful for understanding the GA profile in the future research.
Experimental procedures
Strains and medium
Ganoderma lucidum CGMCC5.26 was purchased from China General Microbiological Culture Collection Center (CGMCC) and maintained on potato dextrose agar (PDA) slants at 4 °C. In order to get consistent metabolites and transcriptome data, a semi‐synthetic media was selected in this study. The medium was composed of glucose 20 g l−1, yeast nitrogen base without amino acids (YNB) 5 g l−1, tryptone 5 g l−1, KH2PO4 4.5 g l−1 and MgSO4·7H2O 2 g l−1 at initial pH. Glucose, KH2PO4 and MgSO4·7H2O purchased from Sinopharm (Beijing, China), YNB purchased from BioDee Biotechnology Co., Ltd (Beijing, China), and tryptone purchased from OXOID (Hants, UK). The medium has been used many years to study the secondary metabolism of G. lucidium (Peng et al., 2015; Ma et al., 2018, 2019). The seed was in a 250‐ml flask containing 80 ml medium and kept at 30 °C on a rotary shaker (150 rpm) for ten days.
Liquid superficial‐static culture and submerged culture
For LSSC, medium was first mixed with G. lucidum seed which was homogenized by IKA T10 basic homogenizer (IKA, Königswinter, Germany) and then 4 ml of mixed fermentation medium was transferred into T25 rectangular canted‐neck cell culture flasks with a vent cap (Corning, Oneonta, USA) and cultured statically on an incubator. The control group was SC in a 500‐ml flask with 150 ml of medium and cultured on a rotary shaker at 150 rpm. Other culture conditions of LSSC and SC were the same, where the homogenized seed was centrifuged at 10 000 g for 5 min, and 3.5 g wet weight of cells l−1 was inoculated to the medium, and cultured at 30 °C for 8 days.
Sampling and analysis of biomass, triterpenoid and ergosterol
Mycelia were harvested by centrifugation (10 000 rpm) for 10 min. Because of evaporation, the culture broth volume was restored to the initial value by adding distilled water before centrifugation. The precipitate was washed three times with distilled water and dried by lyophilization. The biomass was determined by the gravimetric method of determining dry cell weight (DCW).
The total triterpenoid content was evaluated according to a protocol described by Oludemi et al., (2018). In brief, the lyophilized G. lucidum mycelia were dissolved in methanol and extracted for 2 h by ultrasonication. The extracts were centrifuged, and the supernatants were dried at 100 °C. Vanillin‐glacial acetic acid solution (5% w/v) and perchloric acid solution (70%) were added to the dry extracts. Then, the sample solutions were incubated at 60 °C for 20 min and cooled in an ice‐water bath. After adding glacial acetic acid, the sample was measured at 550 nm. Ursolic acid was used as a standard.
Ergosterol was analysed according to the methods of Xu et al., (2010a) with some modifications. The supernatant containing the total triterpenoid was evaporated to dryness under N2. The residue was saponified by a 10% (wt/vol) KOH–75% (vol/vol) ethanol solution at 50 °C for 2 h. The mixture was extracted with hexane three times. The hexane layer was collected and evaporated to dryness under N2. The residue was dissolved in methanol and subjected to high‐pressure liquid chromatography (HPLC) on a Thermo U3000 (Thermo Fisher Scientific, Germering, Germany) apparatus equipped with a Symmetry C18 5.0 column (4.6 mm × 250 mm, Waters, Milford Massachusetts, USA). Separation of ergosterol was achieved using a mobile phase of 100% methanol at a constant flow rate of 1.0 ml min−1. Ergosterol was monitored at a wavelength of 282 nm. Identification and quantification of ergosterol was performed based on retention time, UV spectra and external calibration graphs obtained for an ergosterol standard (Sigma‐Aldrich, St. Louis, MO, USA). For the analysis of biomass, triterpenoid and ergosterol, three biological replicates were performed.
UPLC‐QTOF‐MS conditions and statistical analysis
After extraction of the total triterpenoids, the samples were analysed by an ACQUITY UPLC system coupled with QTOF mass spectrometry (Waters, Milford, MA, USA). The UPLC column was a Waters BEH C‐18 column (50 × 2.1 mm, 1.7 μm, Massachusetts, USA). Gradients of solvent A (methanol) and solvent B (0.1% formic acid) were prepared as follows: (i) 0–20 min (A:B, 3:7, v/v), (ii) 20–25 min (A, 100, v/v) and (iii) 25–30 min (A:B, 3:7, v/v). The flow rate was 0.3 ml min−1. The injection volume was 2 μl, and the column temperature was maintained at 45 °C. The mass spectrometer was operated with a capillary voltage of 3.0 kV and a sampling cone of 20 V in negative mode. The other parameters used were as follows: nitrogen gas flow rate of the nebulizer of 50 L h−1; desolvation gas flow rate of 700 l h−1; desolvation temperature of 400 °C; and source temperature of 100 °C. Mass spectra were recorded across an m/z range of 50–1500 with a 0.5 s scan time. The collision energy spectrum was recorded at 6.0 and 35 eV. The scanning wavelength of the diode array detector ranged from 200 to 400 nm.
Masslynx (MarkerLynx XS) V4.1 software (Waters, Milford, USA) was used for alignment, deconvolution and data reduction. The basic operational steps were described by Lin et al., (2019). The differences were that the main parameters included a retention time range of 4 ~ 28 min, mass range of 50 ~ 1200 Da, mass tolerance of 0.05, mass window of 0.05, retention time window of 0.20 and noise elimination level of 6. Simca 15.0 software (Umetrics, Malmö, Sweden) was used to visualize the VIP (variable importance for the projection) analysis results.
Transcriptome sequence and assembly
RNA isolation, cDNA library construction, sequencing library preparation and high‐throughput sequencing were carried out by Novogene Bioinformatics Technology Co., Ltd. (Beijing, China, http://www.novogene.com). The procedure was summarized in the Supporting Information. The RNA‐seq data were obtained in three biological replicates and had been deposited in the NCBI Sequence Read Archive (SRA) database (BioProject: PRJNA643653 and Submission: SUB7707164).
Gene expression analysis by RT‐qPCR
RNA isolation and RT‐qPCR were performed as previously reported by Zhang et al. (2020). The primers were designed using NCBI Primer Blast and referring to previous research (Table S1) (Xu et al., 2010a, 2019). For each gene analysed by RT‐qPCR, three biological replicates were performed. The relative expression levels of target genes were calculated using the 2−ΔΔCt method.
Conflict of interest
None declared.
Supporting information
Supplementary Material
Fig. S1. The representative base peak intensity chromatograms (negative modes) of metabolites from G. lucidum in LSSC and SC.
Fig. S2. GO functional classification of differentially expressed genes.
Table S1. Oligonucleotide primers used in this study.
Table S2. The identification of GAs by databases and references.
Table S3. Summary of transcriptome sequencing results.
Table S4. The differentially expressed genes (DEGs) between LSSC and SC during the culture time.
Table S5‐1. The FPKM value of all the genes involved in the ergosterol biosynthetic pathway during culture time.
Table S5‐2. The FPKM values of CYP450 genes associated with GA biosynthesis.
Acknowledgements
This research was funded by the National Natural Science Foundation of China (31271918), Postgraduate Research & Practice Innovation Program of Jiangsu Province (KYCX18_1787), Qing Lan Project and National First‐class Discipline Program of Light Industry Technology and Engineering (LITE2018‐22).
Microbial Biotechnology (2021) 14(2), 600–613
Funding information
Postgraduate Research & Practice Innovation Program of Jiangsu Province (Grant/Award Number: KYCX18_1787). National Natural Science Foundation of China (Grant/Award Number: 31271918). National First‐Class Discipline Program of Light Industry Technology and Engineering (Grant/Award Number: LITE2018‐22).
References
- Alcazar‐Fuoli, L. , and Mellado, E. (2013) Ergosterol biosynthesis in Aspergillus fumigatus: its relevance as an antifungal target and role in antifungal drug resistance. Front Microbial 3: 439. [DOI] [PMC free article] [PubMed] [Google Scholar]
- Baby, S. , Johnson, A.J. , and Govindan, B. (2015) Secondary metabolites from Ganoderma . Phytochemistry 114: 66–101. [DOI] [PubMed] [Google Scholar]
- Bishop, K.S. , Kao, C.H. , Xu, Y. , Glucina, M.P. , Paterson, R.R. M. , and Ferguson, L.R. (2015) From 2000 years of Ganoderma lucidum to recent developments in nutraceuticals. Phytochemistry 114: 56–65. [DOI] [PubMed] [Google Scholar]
- Ceita, G.O. , Vilas‐Boas, L.A. , Castilho, M.S. , Carazzolle, M.F. , Pirovani, C.P. , Selbach‐Schnadelbach, A. , et al. (2014) Analysis of the ergosterol biosynthesis pathway cloning, molecular characterization and phylogeny of lanosterol 14α‐demethylase (ERG11) gene of Moniliophthora perniciosa . Genet Mol Boil 37: 683–693. [DOI] [PMC free article] [PubMed] [Google Scholar]
- Chen, S. , Xu, J. , Liu, C. , Zhu, Y. , Nelson, D.R. , Zhou, S. , et al. (2012) Genome sequence of the model medicinal mushroom Ganoderma lucidum . Nat Commun 3: 913. [DOI] [PMC free article] [PubMed] [Google Scholar]
- Ding, Y.‐X. , Ou‐Yang, X. , Shang, C.‐H. , Ren, A. , Shi, L. , Li, Y.‐X. , and Zhao, M.‐W. (2008) Molecular cloning, characterization, and differential expression of a farnesyl‐diphosphate synthase gene from the basidiomycetous fungus Ganoderma lucidum . Biosci Biotechnol Biochem 72: 1571–1579. [DOI] [PubMed] [Google Scholar]
- Dupont, S. , Lemetais, G. , Ferreira, T. , Cayot, P. , Gervais, P. , and Beney, L. (2012) Ergosterol biosynthesis: a fungal pathway for life on land? Evolution 66: 2961–2968. [DOI] [PubMed] [Google Scholar]
- Fang, X. , Shi, L. , Ren, A. , Jiang, A.‐L. , Wu, F.‐L. , and Zhao, M.‐W. (2013) The cloning, characterization and functional analysis of a gene encoding an acetyl‐CoA acetyltransferase involved in triterpene biosynthesis in Ganoderma lucidum . Mycoscience 54: 100–105. [Google Scholar]
- Fei, Y. , Li, N. , Zhang, D.‐H. , and Xu, J.‐W. (2019) Increased production of ganoderic acids by overexpression of homologous farnesyl diphosphate synthase and kinetic modeling of ganoderic acid production in Ganoderma lucidum . Microb cell fact 18: 115. [DOI] [PMC free article] [PubMed] [Google Scholar]
- Gill, B.S. , Navgeet , and Kumar, S. (2016) Ganoderic acid targeting multiple receptors in cancer: in silico and in vitro study. Tumor Biol 37: 14271–14290. [DOI] [PubMed] [Google Scholar]
- Gu, L. , Zhong, X. , Lian, D. , Zheng, Y. , Wang, H. , and Liu, X. (2017) Triterpenoid biosynthesis and the transcriptional response elicited by nitric oxide in submerged fermenting Ganoderma lucidum . Process Biochem 60: 19–26. [Google Scholar]
- Hirotani, M. , Asaka, I. , Ino, C. , Furuya, T. , and Shiro, M. (1987) Ganoderic acid derivatives and ergosta‐4,7,22‐triene‐3,6‐dione from Ganoderma lucidum . Phytochemistry 26: 2797–2803. [Google Scholar]
- Hughes, A.L. , Powell, D.W. , Bard, M. , Eckstein, J. , Barbuch, R. , Link, A.J. , and Espenshade, P.J. (2007) Dap1/PGRMC1 binds and regulates cytochrome P450 enzymes. Cell Metab 5: 143–149. [DOI] [PubMed] [Google Scholar]
- Jain, K.K. , Kumar, A. , Shankar, A. , Pandey, D. , Chaudhary, B. , and Sharma, K.K. (2020) De novo transcriptome assembly and protein profiling of copper‐induced lignocellulolytic fungus Ganoderma lucidum MDU‐7 reveals genes involved in lignocellulose degradation and terpenoid biosynthetic pathways. Genomics 112: 184–198. [DOI] [PubMed] [Google Scholar]
- Kües, U. , Nelson, D.R. , Liu, C. , Yu, G.‐J. , Zhang, J. , Li, J. , et al. (2015) Genome analysis of medicinal Ganoderma spp. with plant‐pathogenic and saprotrophic life‐styles. Phytochemistry 114: 18–37. [DOI] [PubMed] [Google Scholar]
- Lan, X. , Yuan, W. , Wang, M. , and Xiao, H. (2019) Efficient biosynthesis of antitumor ganoderic acid HLDOA using a dual tunable system for optimizing the expression of CYP5150L8 and a Ganoderma P450 reductase. Biotechnol Bioeng 116: 3301–3311. [DOI] [PubMed] [Google Scholar]
- Li, Y.‐B. , Wang, J.‐L. , and Zhong, J.‐J. (2013) Enhanced recovery of four antitumor ganoderic acids from Ganoderma lucidum mycelia by a novel process of simultaneous extraction and hydrolysis. Process Biochem 48: 331–339. [Google Scholar]
- Li, H. , and Zhong, J.‐J. (2020) Role of calcineurin‐responsive transcription factor CRZ1 in ganoderic acid biosynthesis by Ganoderma lucidum . Process Biochem 95: 166–173. [Google Scholar]
- Lin, H. , Zhu, H. , Tan, J. , Wang, C. , Dong, Q. , Wu, F. , et al. (2019) Comprehensive investigation on metabolites of wild‐simulated American Ginseng root based on ultra‐high performance liquid chromatography‐quadrupole time‐of‐flight mass spectrometry. J Agric Food Chem 67: 5801–5819. [DOI] [PubMed] [Google Scholar]
- Liu, K. , Sun, B. , You, H. , Tu, J.L. , Yu, X. , Zhao, P. , and Xu, J.W. (2020) Dual sgRNA‐directed gene deletion in basidiomycete Ganoderma lucidum using the CRISPR/Cas9 system. Microb Biotechnol 13: 386–396. [DOI] [PMC free article] [PubMed] [Google Scholar]
- Lu, W. , Feng, J. , Chen, X. , Bao, Y.‐J. , Wang, Y. , Wu, Q. , et al. (2019) Distinct regioselectivity of fungal P450 enzymes for steroidal hydroxylation. Appl Environ Microbiol 85: e01182‐01119. [DOI] [PMC free article] [PubMed] [Google Scholar]
- Ma, Z. , Xu, M. , Wang, Q. , Wang, F. , Zheng, H. , Gu, Z. , et al. (2019) Development of an efficient strategy to improve extracellular polysaccharides production of Ganoderma lucidum using L‐phenylalanine as enhancer. Front Microbial 10: 2306. [DOI] [PMC free article] [PubMed] [Google Scholar]
- Ma, Z. , Ye, C. , Deng, W. , Xu, M. , Wang, Q. , Liu, G. , et al. (2018) Reconstruction and analysis of a genome‐scale metabolic model of Ganoderma lucidum for improved extracellular polysaccharide production. Front Microbial 9: 3076. [DOI] [PMC free article] [PubMed] [Google Scholar]
- Nishitoba, T. , Sato, H. , and Sakamura, S. (1987) Novel mycelial components, ganoderic acid Mg, Mh, Mi, Mj and Mk, from the fungus Ganoderma lucidum . Agric Biol Chem 51: 1149–1153. [Google Scholar]
- Oludemi, T. , Barros, L. , Prieto, M. , Heleno, S.A. , Barreiro, M.F. , and Ferreira, I.C. (2018) Extraction of triterpenoids and phenolic compounds from Ganoderma lucidum: optimization study using the response surface methodology. Food Funct 9: 209–226. [DOI] [PubMed] [Google Scholar]
- Peng, L. , Qiao, S. , Xu, Z. , Guan, F. , Ding, Z. , Gu, Z. , et al. (2015) Effects of culture conditions on monosaccharide composition of Ganoderma lucidum exopolysaccharide and on activities of related enzymes. Carbohyd Polym 133: 104–109. [DOI] [PubMed] [Google Scholar]
- Pharmacopoeia Commission of People’s Republic of China (2015) Pharmacopoeia of the People’s Republic of China (Part 1). Beijing, China: Chinese Medical Science and Technology Press, p. 188. [Google Scholar]
- Ren, A. , Ouyang, X. , Shi, L. , Jiang, A.‐L. , Mu, D.‐S. , Li, M.‐J. , et al. (2013) Molecular characterization and expression analysis of GlHMGS, a gene encoding hydroxymethylglutaryl‐CoA synthase from Ganoderma lucidum (Ling‐zhi) in ganoderic acid biosynthesis pathway. World J Microb Biot 29: 523–531. [DOI] [PubMed] [Google Scholar]
- Shakoury‐Elizeh, M. , Protchenko, O. , Berger, A. , Cox, J. , Gable, K. , Dunn, T.M. , et al. (2010) Metabolic response to iron deficiency in Saccharomyces cerevisiae . J Biol Chem 285: 14823–14833. [DOI] [PMC free article] [PubMed] [Google Scholar]
- Shang, C.‐H. , Shi, L. , Ren, A. , Qin, L. , and Zhao, M.‐W. (2010) Molecular cloning, characterization, and differential expression of a lanosterol synthase gene from Ganoderma lucidum . Biosci Biotechnol Biochem 74: 974–978. [DOI] [PubMed] [Google Scholar]
- Shang, C.‐H. , Zhu, F. , Li, N. , Ou‐Yang, X. , Shi, L. , Zhao, M.‐W. , and Li, Y.‐X. (2008) Cloning and characterization of a gene encoding HMG‐CoA reductase from Ganoderma lucidum and its functional identification in yeast. Biosci Biotechnol Biochem 72: 1333–1339. [DOI] [PubMed] [Google Scholar]
- Shi, L. , Qin, L. , Xu, Y. , Ren, A. , Fang, X. , Mu, D. , et al. (2012) Molecular cloning, characterization, and function analysis of a mevalonate pyrophosphate decarboxylase gene from Ganoderma lucidum . Mol Boil Rep 39: 6149–6159. [DOI] [PubMed] [Google Scholar]
- Syed, K. , Nelson, D.R. , Riley, R. , and Yadav, J.S. (2013) Genomewide annotation and comparative genomics of cytochrome P450 monooxygenases (P450s) in the polypore species Bjerkandera adusta, Ganoderma sp. and Phlebia brevispora . Mycologia 105: 1445–1455. [DOI] [PubMed] [Google Scholar]
- Syed, K. , Shale, K. , Pagadala, N.S. , and Tuszynski, J. (2014) Systematic identification and evolutionary analysis of catalytically versatile cytochrome P450 monooxygenase families enriched in model basidiomycete fungi. PLoS One 9: e86683. [DOI] [PMC free article] [PubMed] [Google Scholar]
- Tan, X. , Sun, J. , Ning, H. , Qin, Z. , Miao, Y. , Sun, T. , and Zhang, X. (2018) De novo transcriptome sequencing and comprehensive analysis of the heat stress response genes in the basidiomycetes fungus Ganoderma lucidum . Gene 661: 139–151. [DOI] [PubMed] [Google Scholar]
- Wang, R. , Ma, P. , Li, C. , Xiao, L. , Liang, Z. , and Dong, J. (2019) Combining transcriptomics and metabolomics to reveal the underlying molecular mechanism of ergosterol biosynthesis during the fruiting process of Flammulina velutipes . BMC Genom 20: 1–12. [DOI] [PMC free article] [PubMed] [Google Scholar]
- Wang, W.F. , Xiao, H. , and Zhong, J.J. (2018) Biosynthesis of a ganoderic acid in Saccharomyces cerevisiae by expressing a cytochrome P450 gene from Ganoderma lucidum . Biotechnol Bioeng 115: 1842–1854. [DOI] [PubMed] [Google Scholar]
- Wang, P.‐A. , Xiao, H. , and Zhong, J.‐J. (2020) CRISPR‐Cas9 assisted functional gene editing in the mushroom Ganoderma lucidum . Appl Microbiol Biotechnol 104: 1661–1671. [DOI] [PubMed] [Google Scholar]
- Wu, Y.‐L. , Han, F. , Luan, S.‐S. , Ai, R. , Zhang, P. , Li, H. , and Chen, L.‐X. (2019) Triterpenoids from Ganoderma lucidum and their potential anti‐inflammatory effects. J Agric Food Chem 67: 5147–5158. [DOI] [PubMed] [Google Scholar]
- Wu, F.‐L. , Shi, L. , Yao, J. , Ren, A. , Zhou, C. , Mu, D. , and Zhao, M.‐W. (2013) The cloning, characterization, and functional analysis of a gene encoding an isopentenyl diphosphate isomerase involved in triterpene biosynthesis in the Lingzhi or reishi medicinal mushroom Ganoderma lucidum (higher Basidiomycetes). Int J Med Mushrooms 15: 223–232. [DOI] [PubMed] [Google Scholar]
- Xu, P. , Bhan, N. , and Koffas, M.A. (2013) Engineering plant metabolism into microbes: from systems biology to synthetic biology. Curr Opin Biotech 24: 291–299. [DOI] [PubMed] [Google Scholar]
- Xu, P. , Ding, Z.‐Y. , Qian, Z. , Zhao, C.‐X. , and Zhang, K.‐C. (2008) Improved production of mycelial biomass and ganoderic acid by submerged culture of Ganoderma lucidum SB97 using complex media. Enzyme Microb Tech 42: 325–331. [Google Scholar]
- Xu, J.‐W. , Xu, Y.‐N. , and Zhong, J.‐J. (2010a) Production of individual ganoderic acids and expression of biosynthetic genes in liquid static and shaking cultures of Ganoderma lucidum . Appl Microbiol Biotechnol 85: 941–948. [DOI] [PubMed] [Google Scholar]
- Xu, J.‐W. , Xu, Y.‐N. , and Zhong, J.‐J. (2012) Enhancement of ganoderic acid accumulation by overexpression of an N‐terminally truncated 3‐hydroxy‐3‐methylglutaryl coenzyme A reductase gene in the basidiomycete Ganoderma lucidum . Appl Environ Microbiol. 78: 7968–7976. [DOI] [PMC free article] [PubMed] [Google Scholar]
- Xu, J.W. , Yue, T.H. , Yu, X. , Zhao, P. , Li, T. , and Li, N. (2019) Enhanced production of individual ganoderic acids by integrating Vitreoscilla haemoglobin expression and calcium ion induction in liquid static cultures of Ganoderma lingzhi . Microb Biotechnol 12: 1180–1187. [DOI] [PMC free article] [PubMed] [Google Scholar]
- Xu, J.‐W. , Zhao, W. , and Zhong, J.‐J. (2010b) Biotechnological production and application of ganoderic acids. Appl Microbiol Biotechnol 87: 457–466. [DOI] [PubMed] [Google Scholar]
- Yang, C. , Li, W. , Li, C. , Zhou, Z. , Xiao, Y. , and Yan, X. (2018) Metabolism of ganoderic acids by a Ganoderma lucidum cytochrome P450 and the 3‐keto sterol reductase ERG27 from yeast. Phytochemistry 155: 83–92. [DOI] [PubMed] [Google Scholar]
- Zhang, D.‐H. , Jiang, L.‐X. , Li, N. , Yu, X. , Zhao, P. , Li, T. , and Xu, J.‐W. (2017a) Overexpression of the squalene epoxidase gene alone and in combination with the 3‐hydroxy‐3‐methylglutaryl coenzyme A gene increases ganoderic acid production in Ganoderma lingzhi . J Agric Food Chem 65: 4683–4690. [DOI] [PubMed] [Google Scholar]
- Zhang, D.‐H. , Li, N. , Yu, X. , Zhao, P. , Li, T. , and Xu, J.‐W. (2017b) Overexpression of the homologous lanosterol synthase gene in ganoderic acid biosynthesis in Ganoderma lingzhi . Phytochemistry 134: 46–53. [DOI] [PubMed] [Google Scholar]
- Zhang, Q. , Zhao, L. , Li, Y. , Wang, F. , Li, S. , Shi, G. , and Ding, Z. (2020) Comparative transcriptomics and transcriptional regulation analysis of enhanced laccase production induced by co‐culture of Pleurotus eryngii var. ferulae with Rhodotorula mucilaginosa . Appl Microbiol Biotechnol 104: 241–255. [DOI] [PubMed] [Google Scholar]
- Zhao, M. , Liang, W. , Zhang, D. , Wang, N. , Wang, C. , and Pan, Y. (2007) Cloning and characterization of squalene synthase (SQS) gene from Ganoderma lucidum . J Microbiol Biotechn 17: 1106. [PubMed] [Google Scholar]
- Zhou, J.‐S. , Ji, S.‐L. , Ren, M.‐F. , He, Y.‐L. , Jing, X.‐R. , and Xu, J.‐W. (2014) Enhanced accumulation of individual ganoderic acids in a submerged culture of Ganoderma lucidum by the overexpression of squalene synthase gene. Biochem Eng J 90: 178–183. [Google Scholar]
Associated Data
This section collects any data citations, data availability statements, or supplementary materials included in this article.
Supplementary Materials
Supplementary Material
Fig. S1. The representative base peak intensity chromatograms (negative modes) of metabolites from G. lucidum in LSSC and SC.
Fig. S2. GO functional classification of differentially expressed genes.
Table S1. Oligonucleotide primers used in this study.
Table S2. The identification of GAs by databases and references.
Table S3. Summary of transcriptome sequencing results.
Table S4. The differentially expressed genes (DEGs) between LSSC and SC during the culture time.
Table S5‐1. The FPKM value of all the genes involved in the ergosterol biosynthetic pathway during culture time.
Table S5‐2. The FPKM values of CYP450 genes associated with GA biosynthesis.