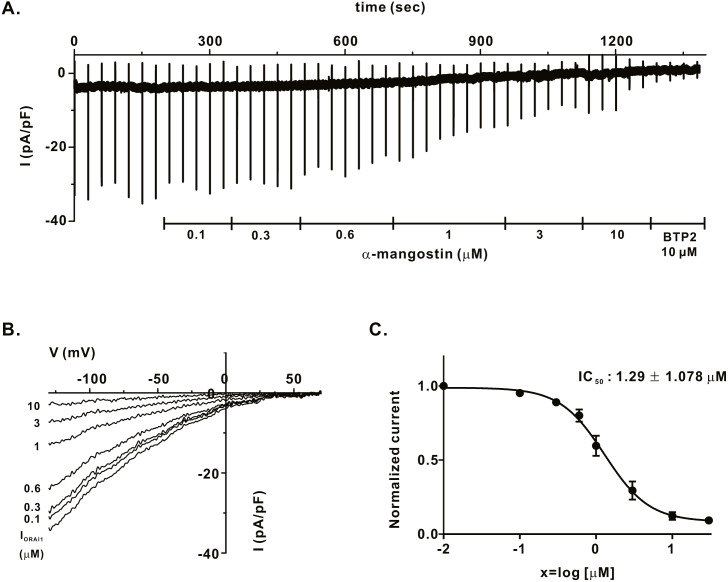
Figure 1. Inhibitory effects of α-mangostin on ORAI1 current (IORAI) in HEK293T cells co-expressed with ORAI1 and STIM1.
(A) Representative chart trace documenting IORAI1 inhibition of α-mangostin. Inhibitory effects of 0.1–10 µM α-mangostin and BTP2. (B) The current (I)-voltage (V) relationship curve of IORAI1 suppressed by varying concentrations of α-mangostin. (1) control, (2) α-mangostin at 0.1 µM, (3) 0.3 µM, (4) 0.6 µM, (5) 1 µM, (6) 3 µM, (7) 10 µM (n £ 8). (C) Concentration-dependent IORAI1 inhibition by α-mangostin at −120 mV, and fitted dose-response curves. Data are expressed as the mean ± SEM.

