

Abstract
Background and Aim
Studies have found that gadolinium‐ethoxybenzyl‐diethylenetriamine pentaacetic acid (Gd‐EOB‐DTPA)‐enhanced T1 mapping magnetic resonance imaging (MRI) could assess liver fibrosis, cirrhosis, and function with high effectiveness. The aim of this study is to explore the efficacy of MRI in predicting the safety of hepatectomy.
Methods
Forty‐nine patients who underwent liver resection were recruited. Gd‐EOB‐DTPA‐enhanced MRI examination was performed 1 week before surgery, and the rate of T1 relaxation time reduction (ΔT120min%) of liver parenchyma was calculated. Posthepatectomy liver failure (PHLF) was defined by the “50–50 criteria” and International Study Group of Liver Surgery (ISGLS) classification, respectively, and posthepatectomy complications (PHC) were defined by the Clavien‐Dindo grading system. The effectiveness of ΔT120min% in predicting the occurrence of PHLF and PHC was analyzed.
Results
The area under the curve (AUC) for ΔT120min% predicting PHLF meeting “50–50 criteria” was 0.957, with a cutoff value of 0.497, sensitivity of 100%, and specificity of 89.1%. The AUC for predicting ISGLS grade B/C (severe) PHLF was 0.84, with a cutoff value of 0.5232, sensitivity of 63.6%, and specificity of 92.6%. The AUC for predicting PHC of Clavien‐Dindo grades 3–5 (severe) was 0.882, with a cutoff value of 0.5646, sensitivity of 87.5%, and specificity of 75.8%. Univariate and multivariate analyses showed that ΔT120min% < 0.4970 (P < 0.01) was an independent risk factor for the development of PHLF (50–50 criteria). Univariate and multivariate analyses showed that liver stiffness measurement and ΔT120min% were risk factors for severe PHLF and severe PHC.
Conclusions
Gd‐EOB‐DTPA‐enhanced T1 mapping MRI accurately predicts the safety of hepatectomy.
Keywords: gadolinium‐ethoxybenzyl‐diethylenetriamine pentaacetic acid‐enhanced T1 mapping magnetic resonance imaging, hepatectomy, posthepatectomy complications, posthepatectomy liver failure
We designed a preliminary study to find a new method to predict the safety of hepatectomy. Our study results proved that gadolinium‐ethoxybenzyl‐diethylenetriamine pentaacetic acid‐enhanced T1 mapping MRI could effectively predict the incidence of posthepatectomy liver failure and posthepatectomy complications.
Introduction
Hepatectomy is the first treatment choice for liver tumors. However, many patients with liver tumors also have chronic liver diseases such as cirrhosis, leading to inadequate remnant liver function, and are prone to posthepatectomy liver failure (PHLF) and posthepatectomy complications (PHC), leading to death. 1 Therefore, accurate preoperative assessment of remnant liver function is the key to reducing PHLF and PHC. 2
The current methods for assessing remnant liver function include blood biochemical function tests, Child‐Pugh score, liver stiffness measurement (LSM), and the indocyanine green (ICG) clearance test. 3 , 4 The first two methods are economical and convenient but have low sensitivity. LSM by ultrasound is noninvasive, convenient, and repeatable but is easily influenced by some factors, 5 such as the active phase of hepatitis, body mass index, and peritoneal ascites. 6 The ICG metabolic test can more accurately assess remnant liver function, but its results are easily influenced by hepatic hemodynamics, biliary obstruction, and other factors. 3 , 5 , 6 Currently, the safety of perioperative resection of liver tumors can be predicted by computed tomography (CT), magnetic resonance imaging (MRI), and other imaging examinations and three‐dimensional images for liver volume determination and calculation of the expected remaining liver volume, but the limitation is that the morphological changes in the liver cannot accurately determine the degree of liver fibrosis and other underlying pathologies, and the remaining liver volume is not completely consistent with the remnant liver function. 3 , 7
Gadolinium‐ethoxybenzyl‐diethylenetriamine pentaacetic acid (Gd‐EOB‐DTPA) (Bayer HealthCare) is a hepatocyte‐specific MRI contrast agent. Following intravenous injection into the body, gadoxetic acid disodium is taken up by hepatocytes. Optimal hepatobiliary phase‐specific imaging can be obtained 20 min after intravenous injection of gadoxetic acid disodium, 8 , 9 , 10 which presents an increase in the signal intensity of liver parenchyma on T1‐weighted images and forms a characteristic contrast with nonhepatocyte focal lesions. Therefore, Gd‐EOB‐DTPA is now widely used in clinical practice to detect focal lesions in the liver. 11 , 12 Furthermore, because cirrhosis and hepatitis can lead to a decrease in the expression of organic anion‐transporting polypeptide 1 on the surface of hepatocytes and an upregulation of multidrug resistance protein, this reduces the uptake of Gd‐EOB‐DTPA by hepatocytes and promotes its excretion, which is manifested by the prolongation of T1 relaxation time. Therefore, the uptake of Gd‐EOB‐DTPA by hepatocytes can also be used to assess the degree of underlying pathologies such as liver fibrosis and remnant liver function. 13 , 14 , 15 Pan et al. 16 applied T1 mapping MRI to record the decrease in the rate of T1 relaxation time (ΔT120min%) before and 20 min after Gd‐EOB‐DTPA administration and confirmed that the degree of liver enhancement following the uptake of Gd‐EOB‐DTPA was correlated with liver function.
Due to the limited treatment options, if the risk of liver failure can be predicted at an early stage, before its occurrence, timely intervention can be carried out to stop the progression of the disease with a safer outcome after hepatectomy. In this study, we retrospectively analyzed the clinical data of hepatectomized patients, analyzed the risk factors for PHLF and PHC, and assessed the application value of Gd‐EOB‐DTPA‐enhanced T1 mapping MRI in predicting adverse events.
Methods
Patients
Patients who underwent hepatectomy due to liver tumors at the Hepatobiliary Surgery Department of Shanghai Public Health Clinical Center from June 2018 to June 2020 were reviewed. The inclusion criteria were: (i) age 16–80 years and (ii) complete resection of liver tumor; primary liver cancer, which met the Guidelines for Diagnosis and Treatment of Primary Liver Cancer in China (2017 Edition) stages I–IIb 17 ; and metastatic liver cancer being the only liver tumor without extrahepatic lesions (gallbladder cancer with focal liver invasion was permitted). The exclusion criteria were: (i) age younger than 16 and greater than 80 years; (ii) patients who had later than stage IIb disease according to the Chinese norms for primary liver cancer 17 ; (iii) patients treated with nonhepatic resection therapy, such as intraoperative radiofrequency ablation; and (iv) patients with incomplete examination data. All patients underwent Gd‐EOB‐DTPA‐enhanced MRI scanning, liver ultrasound, LSM, and other imaging examinations, as well as routine blood tests, within 1 week prior to surgery. Forty‐nine patients, including 42 males and 7 females, with an average age of 60.20 ± 11.18 years, were recruited to this study. Postoperative pathology confirmed 44 cases of hepatocellular carcinoma, 1 case of intrahepatic cholangiocarcinoma, 1 case of gallbladder cancer liver metastasis, 1 case of colon cancer liver metastasis, 1 case of hepatic adenoma, and 1 case of hepatic hemangioma (Table 1).
Table 1.
Clinical characteristics
| Characteristic | |
|---|---|
| Gender (male/female)† | 42/7 |
| Age (years)‡ | 60.20 ± 11.18 |
| Child‐Pugh Score (A/B)† | 43/6 |
| HP (+/−)† | 16/33 |
| DM (+/−)† | 15/34 |
| BMI (kg/m2)‡ | 24.21 ± 3.14 |
| Tumor size (cm) | 5.85 ± 4.90 |
| Tumor number (1/2/3) | 35/9/5 |
| Hepatic inflow occlusion (min) | 19.55 ± 15.74 |
| Minor/major hepatectomy (<3/≥3 segments) | 30/19 |
| Bleeding volume (mL) | 1180.61 ± 1044.42 |
| Blood transfusion (mL, median) | 0 (0, 2000) |
| Operation time (min) | 161.29 ± 52.50 |
| ISGLS (None+A/B/C) | 27/13/9 |
| “50–50 Criteria” (N/Y) | 46/3 |
| Clavien‐Dindo (0–2/3–5) | 40/9 |
| HBV (+/−)‡ | 40/9 |
| ALT (U/L, median) | 30 (11 254) |
| AST (U/L)‡ | 44.76 ± 35.21 |
| ALB (g/L)‡ | 39.81 ± 4.80 |
| PAB (mg/L)‡ | 180.74 ± 69.82 |
| TBil (μmol/L)‡ | 26.96 ± 26.48 |
| INR‡ | 1.11 ± 0.11 |
| PTA (100%)‡ | 84.58 ± 13.61 |
| PT (s)‡ | 13.73 ± 1.57 |
| eGFR (mL/[min*1.73m2])‡ | 104.56 ± 27.04 |
| PLT (*109/L)‡ | 140.70 ± 86.65 |
| LSM (kPa)‡ | 17.87 ± 12.70 |
| ΔT120min%‡ | 0.58 ± 0.11 |
Mean ± SD.
Number of patients.
ALB, albumin; ALT, alanine transaminase; AST, aspartate transaminase; BMI, body mass index; DM, diabetes mellitus; eGFR, estimated glomerular filtration rate; HBV, hepatitis B virus; HP, hypertension; INR, international normalized ratio; LSM, liver stiffness measurement; PAB, prealbumin; PLT, platelet count; PT, prothrombin time; PTA, prothrombin activity; TBil, total bilirubin.
Imaging methods
Preparation for the MRI examination complied with the Shanghai Public Health Clinical Center MRI safety scan specification
Patients abstained from food for 8 h and drink for 4 h before the scan. A 3.0 T MR scanner (Philips Ingenia, The Netherlands) and a dS Torso Coil MR coil were used. The contrast agent Gd‐EOB‐DTPA was injected at a flow rate of 2.0 mL/s (0.025 mmol/kg), followed by an infusion of 20 mL of saline. The T1 mapping images were acquired twice near the hepatic portal layer using the Look‐Locker sequence; one was immediately before enhancement, and the other was 20 min after enhancement. The scanning parameters were repetition time (TR) 5.0 ms, echo time (TE) 1.7 ms, inversion time (TI) 47.0 ms, layer thickness 8.0 mm, spacing‐free scan, field of view (FOV) 380 mm × 380 mm, inversion angle 7°, stimulus times 1, and scan time 20 s.
T1 mapping image acquisition and processing
The images were postprocessed using MR Map software (ITT Visual Information Solutions, Boulder CO, USA) and measured using Image J software (National Institutes of Health, Bethesda, MD, USA). Two physicians with more than 15 years of experience in diagnostic radiology performed the measurements independently without knowing the clinical data of the patients. Ten regions of interest (ROIs) were placed roughly uniformly on the liver, covering an area of approximately 100 mm2, avoiding blood vessels, bile ducts, artifacts, and foci. The ROIs of the same patient before and 20 min after enhancement were placed in the same anatomical site as far as possible. The average of 10 ROI T1 relaxation times was calculated, as shown in Figure S1. The average of the measurements of two physicians was calculated as the final T1 relaxation time of the liver in each patient. The T1 relaxation times before and 20 min after enhancement were recorded as T1plain and T120min, respectively. The T1 relaxation time reduction rate (ΔT120 min%) was calculated using the formula 14 : ΔT120 min% = (T1plain − T120min)/T1plain.
Liver stiffness measurement
The LSM was performed by an ultrasonographer using a Fibrotouch probe. The patient was placed in the supine position, and a normal ultrasound probe was used to examine the thicker part of the liver tissue by avoiding the tumor. The LSM was measured at the intercostal space with the Fibrotouch probe. The median value from at least 10 measurements was recorded automatically by the built‐in computer system, and a report was generated.
Liver resection
The operations were performed by the same surgeon. Hepatectomy was performed by laparotomy or laparoscopy. The liver parenchyma was detached through the ultrasonic knife or clamp method. If there was a large duct, it was closed by Prolene suture or Hem‐O‐Lok clamping. The cross‐sectional surface was sufficiently hemostatic, and a low‐negative‐pressure abdominal drainage tube was routinely left in the abdominal cavity, which was removed when the drainage volume significantly decreased after surgery.
Postoperative management
Postoperatively, liver care and nutritional support were routinely given. Patients with hepatitis B continued to be treated with oral antiviral drugs according to the preoperative protocol. If liver function abnormalities or surgery‐related complications occurred, doctors in the relevant disciplines were consulted regarding appropriate treatment in a timely manner.
Definition of PHLF and PHC
The PHLF classification criteria of the International Study Group of Liver Surgery (ISGLS) 18 and the “50–50 criteria” 19 were used to define PHLF. The former classified PHLF into A, B, and C grades. In general, grade A was defined as mild PHLF because grade A PHLF does not require treatment adjustment. In this study, patients without PHLF were combined with grade A patients, and grades B and C were defined as severe PHLF. The Clavien‐Dindo classification was also used to define the severity of PHC, 20 with grades 1 and 2 defined as mild PHC (grades for no complications were combined with grades 1 and 2 in this study), and grades 3, 4 and 5 were defined as severe PHC.
Statistical analysis
Statistical analysis was performed using SPSS 23.0 software. Intraclass correlation coefficient (ICC) was used to evaluate the variabilities of MRI examination results (T1plain and T120min) between two physicians. The effectiveness of ΔT120min% in predicting PHLF and PHC was evaluated using the receiver operating characteristic (ROC) curve and quantified by the area under the curve (AUC). The ΔT120min% cutoff point for predicting PHLF and PHC was calculated using the Jordon index, and its sensitivity and specificity were also calculated. The t‐test was used for the comparison of normally distributed measures, and the χ2 test or Fisher's exact probability was used for the comparison of nonnormally distributed measures and single‐factor analysis. Univariate analysis was used to analyze the factors that influenced PHLF and PHC, and the variables with P < 0.1 in the univariate analysis were included in the logistic regression model for multivariate analysis (step forward) to calculate the risk factors influencing PHLF and PHC. P < 0.05 was defined as statistically significant.
Results
The clinical data of the included patients are shown in Table 1. The 49 patients had a mean ΔT120min% of 0.5785 ± 0.11 (0.1676–0.7870). Three cases (6.12%) met the “50–50 criteria” for PHLF, 22 cases (44.90%) met the ISGLS classification for severe PHLF, and 16 cases (32.65%) developed severe PHC. The variabilities of MRI examination results (T1plain and T120min) between two physicians (ICC) were 0.883 (95% confidence interval [CI]: 0.761–0.939) and 0.766 (95% CI: 0.620–0.861), respectively.
“50–50 criteria”
ΔT120min% predicted an AUC of 0.957 (95% CI: 0.887–1, P < 0.01) for PHLF, with a cutoff value of 0.4970, sensitivity of 100%, and specificity of 89.1% (Fig. 1). Univariate and multivariate analyses suggested that ΔT120min% <0.497 (P < 0.01) was an independent risk factor affecting the occurrence of PHLF (Table 2).
Figure 1.
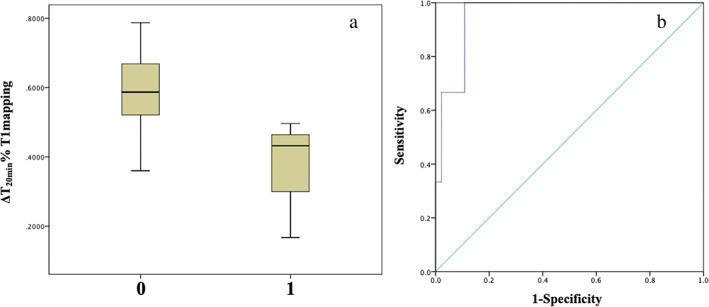
Posthepatectomy liver failure (PHLF) on “50–50 criteria.” (a) Distribution of ΔT120min% (0.3652 ± 0.17 vs 0.5924 ± 0.10, P < 0.001) with or without the occurrence of PHLF (1 for yes, 0 for none); (b) predicted receiver operating characteristic curve for ΔT120min% with PHLF, and area under the curve is 0.957.
Table 2.
Analysis of correlations between preoperative clinically relevant parameters and posthepatectomy liver failure (“50–50 criteria”)
| Univariate | Multivariate | |||
|---|---|---|---|---|
| Characteristic | Chi‐square | P value | OR (95% CI) | P value |
| Gender (male/female) | 0.947 | 0.331 | — | — |
| Age (<60/≥60 years) | 2.604 | 0.107 | — | — |
| HBV (+/−) | 1.681 | 0.195 | — | — |
| HP (+/−) | 0.719 | 0.396 | — | — |
| DM (+/−) | 1.956 | 0.162 | — | — |
| BMI (<24/≥24 kg/m2) | 0.499 | 0.48 | — | — |
| ALT (<40/≥40 U/L) | 0.001 | 0.979 | — | — |
| AST (<40/≥40 U/L) | 1.442 | 0.23 | — | — |
| ALB (<40/≥40 g/L) | 2.604 | 0.107 | — | — |
| PAB (<180/≥180 mg/L) | 0.04 | 0.842 | — | — |
| TBil (<20/≥20 μmol/L) | 0.612 | 0.434 | — | — |
| INR (<1.2/≥1.2) | 0.135 | 0.713 | — | — |
| PTA (<70/≥70%) | 0.624 | 0.43 | — | — |
| PT (<14.3/≥14.3 s) | 0.001 | 0.979 | — | — |
| Child‐Pugh Score (A/B) | 0.446 | 0.504 | — | — |
| PLT (<100/≥100 × 109/L) | 0.04 | 0.842 | — | — |
| eGFR (<90/≥90 mL/[min*1.73m2]) | 1.956 | 0.162 | — | — |
| LSM (<21.3/≥21.3 kPa) | 0.4 | 0.527 | — | — |
| ΔT120min% (<0.4970/≥0.4970) | 6.591 | 0.01 | — | — |
All the factors with a significance level (P < 0.1) in the univariate analysis were included in a logistic (forward stepwise) regression method for multivariate analysis. In the multivariate analysis, P < 0.05 was considered statistically significant. Values in bold indicate statistical significance.
ALB, albumin; ALT, alanine transaminase; AST, aspartate transaminase; BMI, body mass index; CI, confidence interval; DM, diabetes mellitus; eGFR, estimated glomerular filtration rate; HBV, Hepatitis B virus; HP, hypertension; INR, international normalized ratio; LSM, liver stiffness measurement; OR, odds ratio; PAB, prealbumin; PLT, platelet count; PT, prothrombin time; PTA, prothrombin activity; TBil, total bilirubin.
ISGLS classification
ΔT120min% predicted severe PHLF with an AUC value of 0.84 (95% CI: 0.73–0.95, P < 0.01); the cutoff value was 0.5232, sensitivity was 63.6%, and specificity was 92.6% (Fig. 2). Univariate analysis showed that diabetes mellitus, preoperative albumin (ALB) level, prealbumin (PAB) level, prothrombin time (PT), LSM, and ΔT120min% significantly influenced the occurrence of severe PHLF; multivariate analysis showed that LSM ≥14.8 kPa and ΔT120min% <0.5232 were risk factors for severe PHLF (Table 3).
Figure 2.
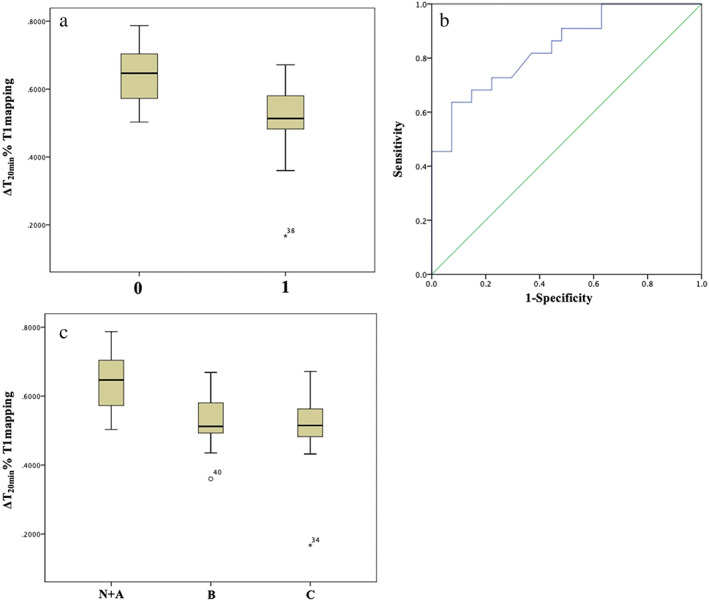
Posthepatectomy liver failure (PHLF) on International Study Group of Liver Surgery classification. (a) Distribution of ΔT120min% (0.5105 ± 0.11 vs 0.6338 ± 0.08, P < 0.001) with or without the occurrence of severe PHLF (1 for yes, 0 for none). (b) Predicted receiver operating characteristic curve for ΔT120min% with severe PHLF, and area under the curve is 0.84. (c) Distribution of ΔT120min% with the occurrence of different PHLF grades.
Table 3.
Correlation analysis of preoperative clinically relevant parameters with severe posthepatectomy liver failure in International Study Group of Liver Surgery classification
| Characteristic | Univariate | Multivariate | ||
|---|---|---|---|---|
| Chi‐square | P value | OR (95% CI) | P value | |
| Gender (male/female) | 2.323 | 0.127 | — | — |
| Age (<60/≥60 years) | 1.175 | 0.278 | — | — |
| HBV (+/−) | 0.25 | 0.617 | — | — |
| HP (+/−) | 2.291 | 0.13 | — | — |
| DM (+/−) | 4.141 | 0.042 | — | — |
| BMI (<24/≥24 kg/m2) | 2.367 | 0.124 | — | — |
| ALT (<40/≥40 U/L) | 0.526 | 0.468 | — | — |
| AST (<40/≥40 U/L) | 2.523 | 0.112 | — | — |
| ALB (<40/≥40 g/L) | 7.933 | 0.005 | — | — |
| PAB (<180/≥180 mg/L) | 10.629 | 0.001 | — | — |
| TBil (<20/≥20 μmol/L) | 1.175 | 0.278 | — | — |
| INR (<1.2/≥1.2) | 3.044 | 0.081 | — | — |
| PTA (<70/≥70%) | 1.197 | 0.274 | — | — |
| PT (<14.3/≥14.3 s) | 12.69 | <0.0001 | — | — |
| Child‐Pugh Score (A/B) | 0.072 | 0.789 | — | — |
| PLT (<100/≥100 x 109/L) | 2.119 | 0.145 | — | — |
| eGFR (<90/≥90 mL/[min*1.73m2]) | 0.622 | 0.43 | — | — |
| LSM (<14.8/≥14.8 kPa) | 12.79 | <0.0001 | 23.421 (2.604–210.628) | 0.005 |
| ΔT120min% (<0.5232/≥0.5232) | 17.429 | <0.0001 | 0.02 (0.002–0.221) | 0.001 |
All the factors with a significance level (P < 0.1) in the univariate analysis were included in a logistic (forward stepwise) regression method for multivariate analysis. In the multivariate analysis, P < 0.05 was considered statistically significant. Values in bold indicate statistical significance.
ALB, albumin; ALT, alanine transaminase; AST, aspartate transaminase; BMI, body mass index; CI, confidence interval; DM, diabetes mellitus; eGFR, estimated glomerular filtration rate; HBV, Hepatitis B virus; HP, hypertension; INR, international normalized ratio; LSM, liver stiffness measurement; OR, odds ratio; PAB, prealbumin; PLT, platelet count; PT, prothrombin time; PTA, prothrombin activity; TBil, total bilirubin.
Clavien‐Dindo complication classification
ΔT120min% predicted severe PHC with an AUC of 0.882 (95% CI: 0.777–0.986, P < 0.01); the cutoff value was 0.5646, sensitivity was 87.5%, and specificity was 75.8% (Fig. 3). Univariate analysis suggested that diabetes, preoperative ALB level, PAB level, PT level, LSM, and ΔT120min% significantly influenced the occurrence of serious PHC. Multivariate analysis showed that LSM ≥14.8 kPa and ΔT120min% <0.5646 were risk factors for severe PHC (Table 4).
Figure 3.
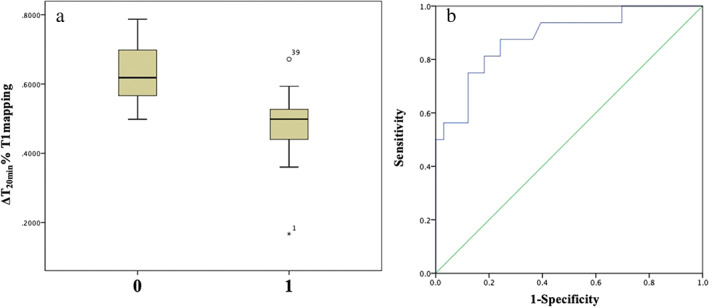
Posthepatectomy complications (PHC) on Clavien‐Dindo grading system. (a) Distribution of ΔT120min% (0.4831 ± 0.11 vs 0.6247 ± 0.08, P < 0.001) with or without the occurrence of severe PHC (1 for yes, 0 for none). (b) Predicted receiver operating characteristic curve for ΔT120min% with severe PHC, and area under the curve is 0.882.
Table 4.
Correlation analysis of preoperative clinically relevant indicators with the occurrence of severe posthepatectomy complications
| Characteristic | Univariate | Multivariate | ||
|---|---|---|---|---|
| Chi‐square | P value | OR (95% CI) | P value | |
| Gender (male/female) | 2.227 | 0.136 | — | — |
| Age (<60/≥60 years) | 0.526 | 0.468 | — | — |
| HBV (+/−) | 1.33 | 0.249 | — | — |
| HP (+/−) | 0.545 | 0.46 | — | — |
| DM (+/−) | 4.204 | 0.04 | — | — |
| BMI (<24/≥24 kg/m2) | 0.827 | 0.363 | — | — |
| ALT (<40/≥40 U/L) | 0.254 | 0.614 | — | — |
| AST (<40/≥40 U/L) | 0.124 | 0.724 | — | — |
| ALB (<40/≥40 g/L) | 6.566 | 0.01 | — | — |
| PAB (<180/≥180 mg/L) | 6.909 | 0.009 | — | — |
| TBil (<20/≥20 μmol/L) | 0.526 | 0.468 | — | — |
| INR (<1.2/≥1.2) | 2.175 | 0.14 | — | — |
| PTA (<70/≥70%) | 1.308 | 0.253 | — | — |
| PT (<14.3/≥14.3 s) | 9.624 | 0.002 | — | — |
| Child‐Pugh Score (A/B) | 0.795 | 0.373 | — | — |
| PLT (<100/≥100 x 109/L) | 0.248 | 0.619 | — | — |
| eGFR (<90/≥90 mL/[min*1.73m2]) | 1.93 | 0.165 | — | — |
| LSM (<14.8/≥14.8 kPa) | 9.9 | 0.002 | 18.435 (1.881–180.692) | 0.012 |
| ΔT120min% (<0.5646/≥0.5646) | 19.373 | <0.0001 | 0.024 (0.003–0.224) | 0.001 |
All the factors with a significance level (P < 0.1) in the univariate analysis were included in a logistic (forward stepwise) regression method for multivariate analysis. In the multivariate analysis, P < 0.05 was considered statistically significant. Values in bold indicate statistical significance.
ALB, albumin; ALT, alanine transaminase; AST, aspartate transaminase; BMI, body mass index; CI, confidence interval; DM, diabetes mellitus; eGFR, estimated glomerular filtration rate; HBV, Hepatitis B virus; HP, hypertension; INR, international normalized ratio; LSM, liver stiffness measurement; OR, odds ratio; PAB, prealbumin; PT, prothrombin time; PTA, prothrombin activity; PLT, platelet count; TBil, total bilirubin.
According to the ΔT120min% results, the patients were classified into two groups, one group with ΔT120min% <0.5232 and the other group with ΔT120min% ≥0.5232. The incidence of severe PHLF in the ΔT120min% <0.5232 group and the ΔT120min% ≥0.5232 group was 87.5 and 24.24% (P < 0.01), respectively; the incidence of severe PHC was 75 and 12.12% (P < 0.01), respectively (Table S1).
Discussion
Hepatectomy is the main treatment for benign and malignant liver tumors, and PHLF is the main cause of perioperative mortality. Therefore, an accurate assessment of the preoperative remnant liver function is crucial for the selection of treatment modality.
Currently, liver function laboratory tests, metabolic tests, and residual liver volume measurements are commonly used in clinical practice for the preliminary assessment of remnant liver function and the prediction of surgical safety. However, there are still some shortcomings with these methods, so we need more accurate predictions for the safety of hepatectomy.
Gd‐EOB‐DTPA‐enhanced MRI has become a widely used imaging technique in recent years, which greatly improves the effectiveness of liver cancer diagnosis and is recommended as the preferred imaging technique in several liver cancer guidelines. 17 , 21 , 22 Gd‐EOB‐DTPA‐enhanced T1 mapping MRI is not influenced by MRI parameters; thus, the T1 mapping technique can accurately assess the degree of liver fibrosis and other underlying liver lesions. 8 , 16 A recent study by Yoon et al. 23 demonstrated that the uptake rate of Gd‐EOB‐DTPA by hepatocytes was correlated with ICG‐15R (ICG 15‐min serum residual rate), which reflected the liver reserve function well. Therefore, Gd‐EOB‐DTPA‐enhanced MRI has a more extensive application in the diagnosis of liver tumors, the assessment of underlying liver lesions, and the assessment of liver functional reserve. We speculated that it can also be used to predict the safety of hepatectomy. 24
No studies have confirmed that T1 mapping can be used to predict the risk of PHLF and PHC. The above‐mentioned studies mostly used 1.5‐T MRI, while the present study used 3.0‐T MRI, which has higher image quality and is more helpful for later imaging and image processing.
In this study, the decay rate of the relaxation time (ΔT120min%) 20 min after Gd‐EOB‐DTPA injection was obtained and calculated separately for statistical analysis of the occurrence of PHLF and PHC as defined by ISGLS classification, “50–50 criteria,” and the Clavien‐Dindo classification. We found that ΔT120min% accurately predicted the risk of PHLF and PHC. Based on the results of this study, we suggest that if the ΔT120min% is below 0.5232, hepatectomy should be carried out carefully, or patients without a history of diabetes should be selected, and the preoperative ALB, PT and PAB levels should be within the normal range to reduce the risk of severe PHLF and PHC. Hepatectomy should be avoided when the ΔT120min% is below 0.497.
LSM has also been widely used to evaluate the extent of underlying liver disease in recent years. 25 Some studies have suggested that LSM can also assess remnant liver function and predict the safety of hepatectomy. 26 Therefore, the present study also collected patient data and compared these data with ΔT120min%. The results suggested that the safety cutoff value of LSM was 14.8 kPa, but the predictive power of ΔT120min% was significantly better for PHLF and PHC (the AUC of LSM did not exceed 0.8).
According to our study, patients with higher ΔT120min% (≥0.5232) could achieve a better economic outcome (shorter hospitalization duration and less cost), as well as higher safety after hepatectomy (Table S1). Considering that MRI is superior to ultrasound and enhanced CT scan in diagnosing liver tumors, we suggest that Gd‐EOB‐DTPA‐enhanced MRI is preferred for diagnosis and surgical safety assessment.
There are also some limitations in this study. First, the relatively high cost of the examination (many patients had undergone routine enhanced MRI before being admitted to the hospital and refused to undergo the more expensive Gd‐EOB‐DTPA‐enhanced MRI) and other factors led to the relatively small number of cases in the present study and the possibility of sample size bias. Second, the present study is a retrospective observational study, with a lower level of clinical evidence than a prospective study. Finally, the T1 mapping images and data obtained from different manufacturers' detection equipment and imaging systems may be different at a later stage. In the future, prospective, large sample studies will be carried out, and patients will be scanned and imaged multiple times, and measures such as 3D quantitative T1 mapping can be adopted to optimize the detection results as much as possible.
Supporting information
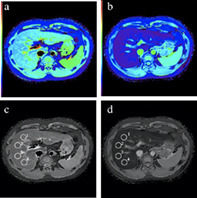
Figure S1. Examples of region of interest (ROI) placement in T1 maps. The same area of the liver parenchyma on (A) precontrast and (B) hepatobiliary phase images in color‐coded T1 maps. Images show calculated T1 maps before (C) and 20 min after administration of Gd‐EOB‐DTPA (D) in a patient with liver fibrosis. Four ROIs are placed in the same area of the liver parenchyma on (C) precontrast and (D) hepatobiliary phase images to measure the T1 relaxation time.
Table S1. Comparison of ΔT120min% < 0.5232 and ΔT120min% ≥ 0.5232 in the two groups of patients.
Qingtao Li contributed equal to Jiao Liu.
Declaration of conflict of interest: None.
References
- 1. Schreckenbach T, Liese J, Bechstein WO, Moench C. Posthepatectomy liver failure. Dig. Surg. 2012; 29: 79–85. [DOI] [PubMed] [Google Scholar]
- 2. Guglielmi A, Ruzzenente A, Conci S, Valdegamberi A, Iacono C. How much remnant is enough in liver resection? Dig. Surg. 2012; 29: 6–17. [DOI] [PubMed] [Google Scholar]
- 3. Bennett JJ, Blumgart LH. Assessment of hepatic reserve prior to hepatic resection. J. Hepatobiliary Pancreat. Surg. 2005; 12: 10–15. [DOI] [PubMed] [Google Scholar]
- 4. Castera L, Forns X, Alberti A. Non‐invasive evaluation of liver fibrosis using transient elastography. J. Hepatol. 2008; 48: 835–47. [DOI] [PubMed] [Google Scholar]
- 5. Stockmann M, Lock JF, Riecke B et al. Prediction of postoperative outcome after hepatectomy with a new bedside test for maximal liver function capacity. Ann. Surg. 2009; 250: 119–25. [DOI] [PubMed] [Google Scholar]
- 6. Hoekstra LT, de Graaf W, Nibourg GA et al. Physiological and biochemical basis of clinical liver function tests: a review. Ann. Surg. 2013; 257: 27–36. [DOI] [PubMed] [Google Scholar]
- 7. Schindl MJ, Redhead DN, Fearon KC, Garden OJ, Wigmore SJ. The value of residual liver volume as a predictor of hepatic dysfunction and infection after major liver resection. Gut. 2005; 54: 289–96. [DOI] [PMC free article] [PubMed] [Google Scholar]
- 8. Motosugi U, Ichikawa T, Sou H et al. Liver parenchymal enhancement of hepatocytephase images in Gd‐EOB‐DTPA‐enhanced MR imaging: which biological markers of the liver function affect the enhancement? J. Magn. Reson. Imaging. 2009; 30: 1042–6. [DOI] [PubMed] [Google Scholar]
- 9. Dahlqvist Leinhard O, Dahlström N, Kihlberg J et al. Quantifying differences in hepatic uptake of the liver specific contrast agents Gd‐EOB‐DTPA and Gd‐BOPTA: a pilot study. Eur. Radiol. 2012; 22: 642–53. [DOI] [PubMed] [Google Scholar]
- 10. Sheng RF, Wang HQ, Yang L et al. Assessment of liver fibrosis using T1 mapping on Gd‐EOB‐DTPA‐enhanced magnetic resonance. Dig. Liver Dis. 2017; 49: 789–95. [DOI] [PubMed] [Google Scholar]
- 11. Kobayashi S, Matsui O, Gabata T et al. Relationship between signal intensity on hepatobiliary phase of gadolinium ethoxybenzyl diethylenetriaminepentaacetic acid (Gd‐EOBDTPA)‐enhanced MR imaging and prognosis of borderline lesions of hepatocellular carcinoma. Eur. J. Radiol. 2012; 81: 3002–9. [DOI] [PubMed] [Google Scholar]
- 12. Purysko AS, Remer EM, Veniero JC. Focal liver lesion detection and characterization with GD‐EOB‐DTPA. Clin. Radiol. 2011; 66: 673–84. [DOI] [PubMed] [Google Scholar]
- 13. Tsuda N, Harada K, Matsui O. Effect of change in transporter expression on gadolinium‐ethoxybenzyl‐diethylenetriamine‐pentaacetic acid‐enhanced magnetic resonance imaging during hepatocarcinogenesis in rats. J. Gastroenterol. Hepatol. 2011; 26: 568–76. [DOI] [PubMed] [Google Scholar]
- 14. Verloh N, Haimerl M, Zeman F et al. Assessing liver function by liver enhancement during the hepatobiliary phase with Gd‐EOB‐DTPA‐enhanced MRI at 3 Tesla. Eur. Radiol. 2014; 24: 1013–19. [DOI] [PubMed] [Google Scholar]
- 15. Feier D, Balassy C, Bastati N, Stift J, Badea R, Ba‐Ssalamah A. Liver fibrosis: histopathologic and biochemical influences on diagnostic efficacy of hepatobiliary contrast‐enhanced MR imaging in staging. Radiology. 2013; 269: 460–8. [DOI] [PubMed] [Google Scholar]
- 16. Pan S, Wang XQ, Guo QY. Quantitative assessment of hepatic fibrosis in chronic hepatitis B and C: T1 mapping on Gd‐EOB‐DTPA‐enhanced liver magnetic resonance imaging. World J. Gastroenterol. 2018; 24: 2024–35. [DOI] [PMC free article] [PubMed] [Google Scholar]
- 17. Zhou J, Sun HC, Wang Z et al. Guidelines for Diagnosis and Treatment of Primary Liver Cancer in China (2017 Edition). Liver Cancer. 2018; 7: 235–60. [DOI] [PMC free article] [PubMed] [Google Scholar]
- 18. Rahbari NN, Garden OJ, Padbury R et al. Posthepatectomy liver failure: a definition and grading by the International Study Group of Liver Surgery (ISGLS). Surgery. 2011; 149: 713–24. [DOI] [PubMed] [Google Scholar]
- 19. Balzan S, Belghiti J, Farges O et al. The “50‐50 criteria” on postoperative day 5: an accurate predictor of liver failure and death after hepatectomy. Ann. Surg. 2005; 242: 824–9. [DOI] [PMC free article] [PubMed] [Google Scholar]
- 20. Dindo D, Demartines N, Clavien PA. Classification of surgical complications: a new proposal with evaluation in a cohort of 6336 patients and results of a survey. Ann. Surg. 2004; 240: 205–13. [DOI] [PMC free article] [PubMed] [Google Scholar]
- 21. Omata M, Cheng AL, Kokudo N et al. Asia‐Pacific clinical practice guidelines on the management of hepatocellular carcinoma: a 2017 update. Hepatol. Int. 2017; 11: 317–70. [DOI] [PMC free article] [PubMed] [Google Scholar]
- 22. Kokudo N, Takemura N, Hasegawa K et al. Clinical practice guidelines for hepatocellular carcinoma: the Japan Society of Hepatology 2017 (4th JSH‐HCC guidelines) 2019 update. Hepatol. Res. 2019; 49: 1109–13. [DOI] [PubMed] [Google Scholar]
- 23. Yoon JH, Lee JM, Kang HJ et al. Quantitative assessment of liver function by using gadoxetic acid‐enhanced MRI: hepatocyte uptake ratio. Radiology. 2019; 290: 125–33. [DOI] [PubMed] [Google Scholar]
- 24. Cho SH, Kang UR, Kim JD, Han YS, Choi DL. The value of gadoxetate disodium‐enhanced MR imaging for predicting posthepatectomy liver failure after major hepatic resection: a preliminary study. Eur. J. Radiol. 2011; 80: e195–200. [DOI] [PubMed] [Google Scholar]
- 25. Eddowes PJ, Sasso M, Allison M et al. Accuracy of FibroScan controlled attenuation parameter and liver stiffness measurement in assessing steatosis and fibrosis in patients with nonalcoholic fatty liver disease. Gastroenterology. 2019; 156: 1717–30. [DOI] [PubMed] [Google Scholar]
- 26. Chong CC, Wong GL, Chan AW et al. Liver stiffness measurement predicts high‐grade post‐hepatectomy liver failure: a prospective cohort study. J. Gastroenterol. Hepatol. 2019; 32: 506–14. [DOI] [PubMed] [Google Scholar]
Associated Data
This section collects any data citations, data availability statements, or supplementary materials included in this article.
Supplementary Materials
Figure S1. Examples of region of interest (ROI) placement in T1 maps. The same area of the liver parenchyma on (A) precontrast and (B) hepatobiliary phase images in color‐coded T1 maps. Images show calculated T1 maps before (C) and 20 min after administration of Gd‐EOB‐DTPA (D) in a patient with liver fibrosis. Four ROIs are placed in the same area of the liver parenchyma on (C) precontrast and (D) hepatobiliary phase images to measure the T1 relaxation time.
Table S1. Comparison of ΔT120min% < 0.5232 and ΔT120min% ≥ 0.5232 in the two groups of patients.