Abstract
Purpose
Colorectal cancer (CRC) is one of the most common types of malignancies, and radiochemotherapy (RCT) followed by surgery is the recommended approach for CRC treatment. However, some cases do not respond to first-line conventional chemotherapy or even progress further after treatment. Moreover, there is a risk of severe side effects, such as radiodermatitis. Therefore, identifying predictors for RCT sensitivity is an essential step toward predicting and eventually overcoming resistance.
Materials and Methods
We used integrative bioinformatics analysis and experimental validation to show that regenerating family member 4 (REG4) may be a potential biomarker for RCT sensitivity in CRC.
Results
REG4, whose expression is upregulated in some CRC tissues and downregulated in RCT-sensitive CRC cells, was identified as a potential genetic marker for RCT sensitivity in CRC. Immunohistochemistry-based tissue microarray of human CRC was used to experimentally validate REG4 data obtained from the bioinformatics analysis.
Conclusion
Collectively, these results indicate that REG4 may be a potential biomarker for RCT sensitivity in CRC.
Keywords: radiochemotherapy resistance, regenerating family member 4, immunohistochemistry microarray, colon cancer transcriptome
Introduction
Colorectal cancer (CRC), a challenging malignancy to treat, is responsible for approximately 10% of diagnosed cancers and cancer-related deaths annually worldwide.1 Bimodal therapy consisting of surgical resection and adjuvant radiochemotherapy (RCT) has been the preferred option to optimize clinical outcomes for patients with CRC; approximately one-third of CRC patients respond favorably, whereas the rest respond poorly.1,2 However, with respect to RCT, two undesirable adverse effects commonly arise in non-responders: (1) complications that threaten long-term quality of life, such as radiodermatitis, neuropathy, and liver toxicity; and (2) unpredictable tumor spread resulting from delayed surgical resection due to ineffective RCT.2 This evidence highlights the lack of clinically useful biomarkers that can help forecast therapeutic responses in patients receiving RCT. Such biomarkers would enable effective personalized treatment instead of long and ineffective procedures.
Biomarker screening based on high-throughput platforms has been stressed as a promising approach for multiple diseases.3–5 By adopting integrative bioinformatics and experimental analyses, this approach is helpful in identifying potential genetic biomarkers to accurately predict the RCT response.6,7 For instance, a non-invasive blood-based test, the ColonSentry® test, is commercially available to stratify the risk for patients with CRC.3 Previously, we also identified TIMP1 as a molecule potentially highly correlated with the prognosis of ulcerative colitis-associated CRC using this strategy.5
In this study, by combining multiple bioinformatics methods and experimental validations, we identified regenerating family member 4 (REG4) as a potential biomarker for predicting the response to RCT in patients with CRC.
Materials and Methods
Clinical Tissue Specimens
From May 2012 to February 2017, 146 CRC patients were enrolled from the Department of Colorectal Surgery, Shanghai East Hospital. All procedures were approved by the hospital ethics committee in accordance with the Declaration of Helsinki. All patients agreed to the study procedure and signed consent forms. The average age of patients was 55.1 ± 12.5 years, with no other history of malignancies history. All patients underwent an imaging examination and clinical stages were defined based on the results of this examination. Before receiving preoperative neoadjuvant RCT, cancerous and normal tissue samples were collected from these patients through colonoscopy and developed into tissue microarrays. Sensitivity to RCT was assessed based on these tissues samples. The clinical response of tumors to RCT was evaluated according to National Comprehensive Cancer Network guidelines (2011 edition) with four-level evaluation criteria. Grade 0 indicated no cancer cell residue; Grade 1 indicated only a single cell or cellular cluster residue; Grade 2 indicated a fibrosis reaction that exceeds the cancer cell residue; Grade 3 indicated large tumor tissue residue with no fibrosis. Patients with Grade 0 to 1 were regarded as the RCT-sensitive group (n = 80 cases). Patients with Grade 2 to 3 were regarded as the RCT-resistant group (n = 66 cases).
Data Processing
The following gene expression profiles were retrieved from Gene Expression Omnibus (http://www.ncbi.nlm.nih.gov/geo): GSE8671, GSE110224, and GSE15781. The GSE8671 dataset contained 32 colorectal adenomas and paired normal mucosa from the same individuals.8 The GSE110224 dataset consisted of 17 colorectal adenocarcinomas and paired normal mucosa from the same individuals.9 The GSE15781 dataset contained 21 patients with CRC, of which 11 patients received only surgery, while the other 10 patients received RCT preoperatively followed by surgery.10 Colorectal tissues and the corresponding normal tissues were collected from the same individuals. We compared the microarray data from tumor tissues of patients receiving RCT with those from patients receiving surgery only. These datasets were analyzed using GEO2R (http://www.ncbi.nlm.nih.gov/geo/geo2r/) as introduced previously.5 P < 0.05 and |log2FC| ≥ 1 were considered significant.
Expression Analyses
The mRNA and protein levels of REG4 were validated using Gene Expression Profiling Interactive Analysis (http://gepia.cancer-pku.cn/) and The Human Protein Atlas (https://www.proteinatlas.org/), respectively.11 Exosomal expression of REG4 was downloaded from exoRBase (http://www.exorbase.org/).12
Functional Enrichment Analyses
Database for Annotation, Visualization and Integrated Discovery (https://david-d.ncifcrf.gov/) was used to perform Gene Ontology and Kyoto Encyclopedia of Genes and Genomes analyses.13
Protein-Protein Interaction (PPI) Analysis
To generate a PPI network, the genes were mapped to Search Tool for the Retrieval of Interacting Genes (http://string-db.org) with a confidence score > 0.4. Two modules were then obtained using loaded Molecular Complex Detection in Cytoscape.14
Receiver Operating Characteristic (ROC) Curve Analysis
To evaluate the association between REG4 expression and RCT sensitivity, MedCalc statistical software (version 19.2.6, https://www.medcalc.org/) was employed to calculate the ROC curve. Additionally, the 95% confidence intervals and log rank p values were calculated.
Western Blotting
Collected tissues were lysed in lysis buffer (Cell Signaling Technology, USA) supplemented with protease inhibitors (Calbiochem, USA) at 4 °C for at least 30 min. Protein samples were quantified using a bicinchoninic acid assay kit (Pierce, USA). Western blotting was performed as described previously.15 Bands were captured using the LI-COR system (Odyssey, USA). Primary antibodies against β-actin (cat#ab8227, 1:1000) and REG4 (cat#ab255820, 1:1000) were purchased from Abcam (Cambridge, UK).
Tissue Microarray Analysis
Clinical tumor tissues were fixed with 4% paraformaldehyde for at least 24 h. Dehydration and paraffin embedding included following treatments: 75% ethanol (4 h), 85% ethanol (2 h), 90% ethanol (2 h), 95% ethanol (1 h), 100% ethanol (0.5 h), 100% ethanol (0.5 h), ethanol and xylene mix (5–10 min), xylene I (5–10 min), xylene II (5–10 min), paraffin I (65 °C, 1 h), paraffin II (65 °C, 1 h), and paraffin III (65 °C, 1 h). Tissues microarray slides were then generated based on these paraffin-embedded samples. Deparaffinization included following treatments: xylene I (3 min), xylene II (3 min), xylene and ethanol (100%) mix (3 min), 100% ethanol I (3 min), 100% ethanol II (3 min), 95% ethanol (3 min), 70% ethanol (3 min), and 50% ethanol (3 min). Antigen retrieval and blocking of endogenous peroxidase with 3% H2O2 were then conducted. After incubation with 10% normal serum in phosphate-buffered saline for 1 h, slides were incubated with the primary antibody against REG4 (1:500) overnight at 4 °C, followed by incubated with the secondary antibody. Slides were then developed with a 3,3-diaminobenzidine tetrahydrochloride solution and counterstained with hematoxylin. Dehydration included following treatments: 75% ethanol (3 min), 85% ethanol (3 min), 100% ethanol I (5 min), 100% ethanol II (5 min), xylene I (10 min), and xylene II (10 min). Slides were then mounted; images were scanned by the Pannoramic MIDI scanner (3D HISTECH) and analyzed with the Quant center by calculating the H-Score.16
Statistical Analyses
Data are expressed as means ± standard deviation. Paired groups were compared using a two-tailed Student’s t-test. P < 0.05 was considered significant. Statistical analyses were performed using the Prism 7 software (GraphPad, USA).
Results
Generation and Functional Analysis of Differentially Expressed Genes (DEGs) Upregulated in CRC
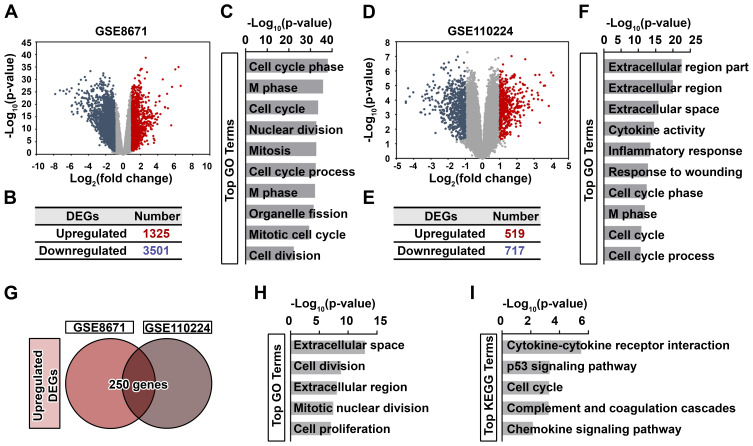
To obtain the functionally important genes in CRC, the GSE8671 dataset was retrieved (Figure 1A); 1325 significantly upregulated DEGs in CRC tissues were identified (Figure 1B). The potential functions of these genes were then predicted by performing Gene Ontology (Figure 1C) and Kyoto Encyclopedia of Genes and Genomes (Figure S1A) analyses. As expected, these upregulated DEGs were highly enriched in cell cycle-related biological processes.2 Additionally, the GSE110224 dataset comprising 17 paired normal and CRC tissues, was downloaded (Figure 1D); 519 significantly upregulated DEGs were obtained (Figure 1E). These genes were also highly enriched in cell cycle-related biological processes (Figure 1F and S1B). To acquire more reliable data on functional genes in CRC, upregulated DEGs in both the GSE8671 and GSE110224 datasets were intersected to reduce the number of candidates (Figure 1G). The overlapped DEGs were highly enriched in cell proliferation- and cell cycle-related biological processes (Figure 1H and I). Taken together, these bioinformatics-based results highlighted 250 potential functional candidate genes in CRC.
Figure 1.
Generation and functional analysis of DEGs upregulated in CRC. Volcano plot (A) and the distribution (B) of DEGs in CRC tissues based on GSE8671 dataset. Red dots, significantly upregulated DEGs; blue dots, significantly downregulated DEGs; gray dots, no significant difference. P < 0.05 and fold change > 2 were considered as significant. (C) Top 10 enriched GO terms of significantly upregulated DEGs are indicated. Volcano plot (D) and the distribution (E) of DEGs in CRC tissues based on GSE110224 dataset. Red dots, significantly upregulated DEGs; blue dots, significantly downregulated DEGs; gray dots, no significant difference. P < 0.05 and fold change > 2 were considered as significant. (F) Top 10 enriched GO terms of significantly upregulated DEGs are indicated. (G) Venn diagram of significantly upregulated DEGs between GSE8671 and GSE110224 datasets. Top 5 enriched GO terms (H) and KEGG pathways (I) of these 250 genes are indicated.
Identification of REG4 as a Highly Susceptible Gene in Response to RCT in CRC
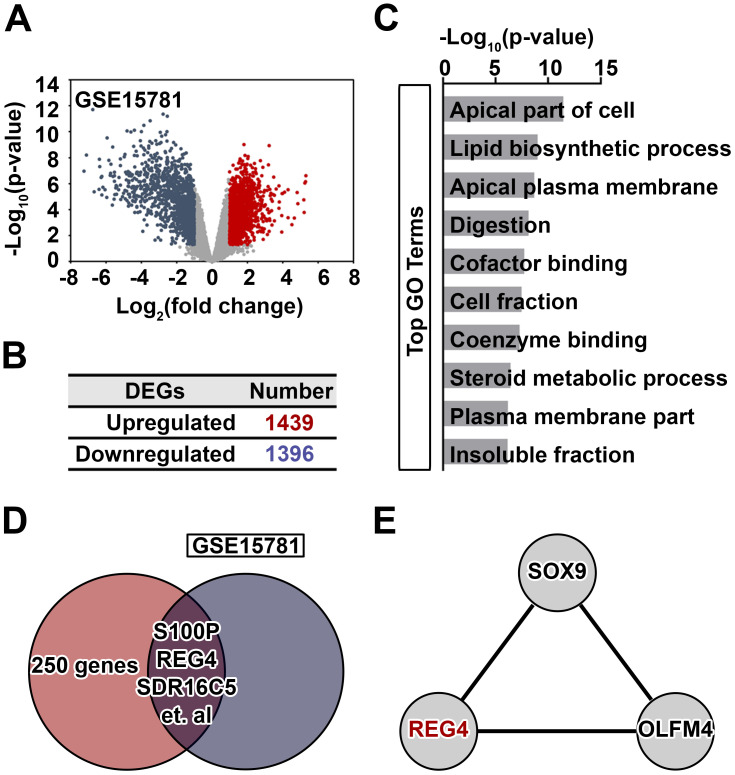
It is imperative to identify reliable biomarkers to identify patients that will benefit from RCT, avoiding long, costly, and ineffective procedures in favor of treatments with precision medicine. Accordingly, we retrieved the GSE15781 dataset consisting of CRC samples receiving RCT and paired control samples (Figure 2A); 1396 downregulated DEGs were obtained (Figure 2B). These downregulated DEGs were significantly enriched in the apical part of the cell (Figure 2C) and aldosterone-regulated sodium reabsorption (Figure S2). To decrease the number of potential candidates, the identified oncogenes (Figure 1G) were intersected with the 1396 downregulated DEGs, 26 genes were identified (Figure 2D). The top three RCT-responsive genes included S100P, REG4, and SDR16C5 (Figure S3A), suggesting that REG4 might be a predictive biomarker for RCT response in CRC patients. To identify the hub genes, a PPI network was constructed based on these 26 overlapping genes. Two modules with high scores were exported after using Molecular Complex Detection in Cytoscape (Figure 2E and S3B). We found that REG4 was a highly RCT-responsive hub gene. Therefore, our results suggest that REG4 can be regarded as a potentially essential gene for RCT sensitivity in CRC patients.
Figure 2.
Identification of REG4 as a highly susceptible gene in response to RCT treatment in CRC. Volcano plot (A) and the distribution (B) of DEGs in tissues collected from patients receiving RCT treatment based on GSE15781 dataset. Red dots, significantly upregulated DEGs; blue dots, significantly downregulated DEGs; gray dots, no significant difference. P < 0.05 and fold change > 2 were considered as significant. (C) Top 10 enriched GO terms of significantly downregulated DEGs are indicated. (D) Venn diagram showing the shared genes between 250 identified genes and significantly downregulated DEGs obtained from GSE15781 dataset. (E) Module#2 exported from PPI network generated based on the shared genes.
REG4 is a Potential Predictor for RCT Sensitivity in CRC Patients
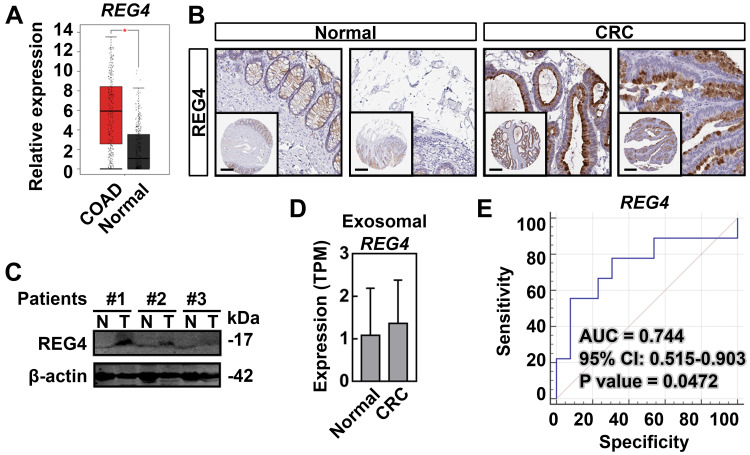
Several bioinformatics and experimental methods were adopted to verify the expression of REG4 in CRC tissues as well as its prognostic value for RCT. As shown in Figure 3A, the mRNA expression of REG4 was significantly increased in CRC tissues based on the results from Gene Expression Profiling Interactive Analysis. By using the Human Protein Atlas, we found that REG4 was highly expressed in CRC tissues and rarely detected in non-malignant tissues (Figure 3B). Three patients with CRC were enrolled, and malignant and adjacent non-malignant tissues were collected; levels of REG4 were also significantly increased in CRC tissues (Figure 3C and S5). There was no significant difference in the expression of REG4 in serum exosomes collected from control and CRC patients (Figure 3D). To evaluate the potential diagnostic value of REG4, an ROC curve analysis was performed based on the GSE15781 dataset. The area under the curve value was 0.744 (p = 0.0472), highlighting the sensitivity and specificity of REG4 in distinguishing RCT-responsive samples from the control (Figure 3E). Altogether, these results suggest that REG4 is a potential RCT-responsive biomarker in CRC patients.
Figure 3.
Experimental validation of the expression of REG4 in CRC. (A) REG4 is significantly upregulated in CRC tissues compared with normal colorectal tissues based on GEPIA. *, significantly different from normal tissues (p < 0.05). (B) The protein expression of REG4 in normal and CRC tissues, respectively. Representative immunohistochemistry staining images are obtained from the Human Protein Atlas online database (magnification, x40). (C) Western blot analysis of REG4 in tumor (T) and non-tumor (N) tissues collected from CRC patients. (D) The relative expression of REG4 in serum exosomes downloaded from exoRBase. (E) ROC curve analysis of REG4 based on GSE15781 dataset.
Immunohistochemistry-Based Validation of REG4 as a Potential Biomarker for RCT Sensitivity in CRC
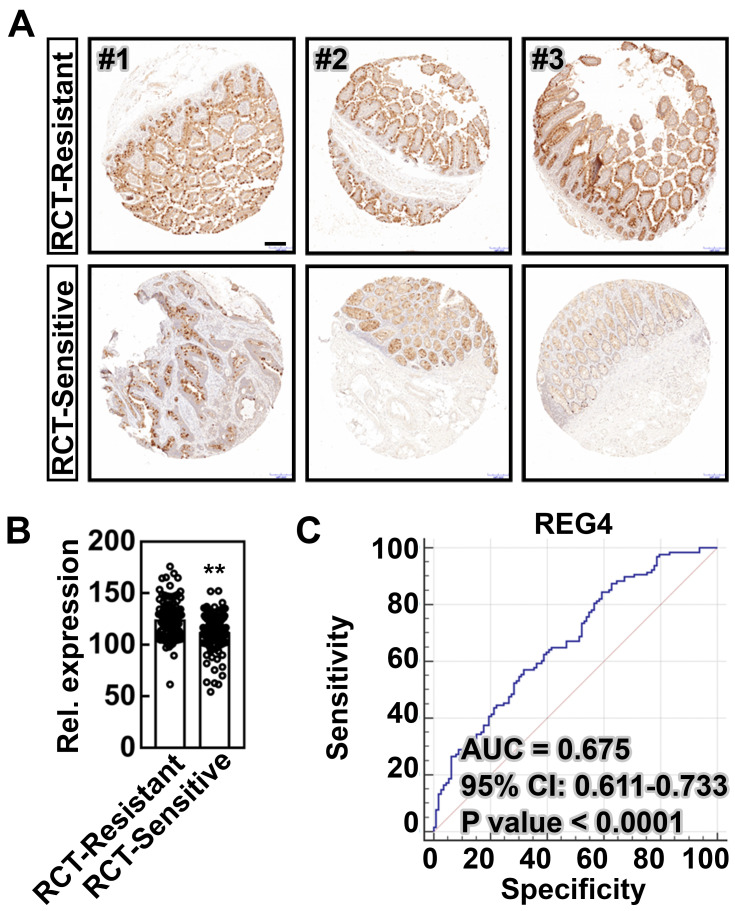
To verify the role of REG4 in the response to RCT, a clinical specimen-based histological analysis of patients with CRC was conducted (Figure S4). These CRC patients with lower REG4 expression responded efficiently to RCT (Figure 4A and B). To quantify the potential value of REG4 for RCT sensitivity in CRC, an ROC curve analysis was conducted. As shown in Figure 4C, the area under the curve value was 0.675 (p < 0.0001), highlighting the sensitivity and specificity of REG4 expression in distinguishing RCT-sensitive from resistant samples (Table S1). Collectively, our data verify that CRC patients with an reduce expression of REG4 is more sensitive to RCT in the clinic.
Figure 4.
Immunohistochemistry-based validation of REG4 as a potential biomarker for RCT sensitivity in CRC. (A) Representative immunohistochemical images of REG4 in RCT-resistant and RCT-sensitive CRC tissues collected from the clinic. Scale bar, 200 μm. (B) Quantification of REG4. **, significantly different from RCT-resistant CRC samples (p < 0.01). (C) ROC curve analysis of REG4 based on the microarray.
Discussion
In this study, REG4 was initially identified as a highly expressed gene in CRC. Moreover, a significant decrease in the expression of REG4 was found in CRC patients receiving RCT. This reduction has shown favorable diagnostic value regarding whether the patient has received effective RCT. Furthermore, RCT-resistant and -sensitive clinical specimen-based immunohistochemical validation of REG4 indicated that it was a potential biomarker for RCT sensitivity in CRC.
CRC is one of the most common malignancies worldwide; genetic alterations and pathological characteristics collaboratively mark the malignant transformation from early to invasive neoplasia.1,17,18 In this study, by combining multiple bioinformatics methods and experimental validation, REG4 was identified as a marker to assess RCT sensitivity in CRC patients; patients with low REG4 expression were more likely to benefit from RCT. A previous study also suggested that high expression of REG4 was associated with a poor therapeutic response, adverse outcome, and an aggressive phenotype in rectal cancer patients treated with adjuvant RCT, justifying REG4 as a surrogate marker to predict RCT resistance.19
REGs are a group of small secretory proteins that perform important functions during cell regeneration and proliferation. Within the REG family, REG4, the most recently discovered member, is involved in cell proliferation and regeneration and has been identified as being critical in the pathogenesis of gastroenterological cancers.20 Consistently, two previous reports revealed that REG4 expression was markedly increased in CRC tissues.21,22 Collectively, findings from the current and previous studies suggest that REG4 can be a predictor of treatment response, and CRC patients with downregulated REG4 expression may benefit from RCT. Specifically, several previous studies highlighted that REG4 might be a double-edged sword during the occurrence and/or progression of CRC. Survival data retrieved from the Human Protein Atlas showed that CRC patients with high REG4 expression exhibit increased survival (Figure S3C), whereas targeting REG4 resulted in remarkably decreased tumor growth in experimental CRC models.23,24 However, the underlying mechanism has not yet been determined, making this a worthwhile topic for future studies. Targeting REG4 in CRC patients with high levels of REG4 may reinforce the clinical efficacy of RCT.
Conclusions
In summary, we demonstrated that REG4 is a potential biomarker for RCT sensitivity in CRC using integrative bioinformatics and experimental analyses. However, further investigations designed to elucidate the RCT resistance mechanisms of REG4 in RCT-resistant CRC models are still urgently required.
Acknowledgments
We would like to thank Editage (www.editage.cn) for English language editing.
Funding Statement
This study was supported by the Fundamental Research Funds for the Central Universities (WK9110000162).
Data Sharing Statement
The datasets used and/or analyzed during the present study are available from Dr. Kaijing Wang upon reasonable request.
Ethics Approval and Informed Consent
All procedures were approved by the ethics committee of Shanghai East Hospital in accordance with the Declaration of Helsinki. All patients agreed to the study procedure and signed consent forms.
Author Contributions
All authors made substantial contributions to conception and design, acquisition of data, or analysis and interpretation of data; took part in drafting the article or revising it critically for important intellectual content; agreed to submit to the current journal; gave final approval of the version to be published; and agree to be accountable for all aspects of the work.
Disclosure
The authors report no conflicts of interest in this work.
References
- 1.Bray F, Ferlay J, Soerjomataram I, Siegel RL, Torre LA, Jemal A. Global cancer statistics 2018: GLOBOCAN estimates of incidence and mortality worldwide for 36 cancers in 185 countries. CA Cancer J Clin. 2018;68(6):394–424. doi: 10.3322/caac.21492 [DOI] [PubMed] [Google Scholar]
- 2.Dekker E, Tanis PJ, Vleugels JLA, Kasi PM, Wallace MB. Colorectal cancer. Lancet (London, England). 2019;394(10207):1467–1480. doi: 10.1016/S0140-6736(19)32319-0 [DOI] [PubMed] [Google Scholar]
- 3.Marshall KW, Mohr S, Khettabi FE, et al. A blood-based biomarker panel for stratifying current risk for colorectal cancer. Int J Cancer. 2010;126(5):1177–1186. doi: 10.1002/ijc.24910 [DOI] [PubMed] [Google Scholar]
- 4.You S, Gao L. Identification of NMU as a potential gene conferring alectinib resistance in non-small cell lung cancer based on bioinformatics analyses. Gene. 2018;678:137–142. doi: 10.1016/j.gene.2018.08.032 [DOI] [PubMed] [Google Scholar]
- 5.Huang R, Wang K, Gao L, Gao W. TIMP1 is a potential key gene associated with the pathogenesis and prognosis of ulcerative colitis-associated colorectal cancer. Onco Targets Ther. 2019;12:8895–8904. doi: 10.2147/OTT.S222608 [DOI] [PMC free article] [PubMed] [Google Scholar]
- 6.Ghadimi BM, Grade M, Difilippantonio MJ, et al. Effectiveness of gene expression profiling for response prediction of rectal adenocarcinomas to preoperative chemoradiotherapy. J Clin Oncol. 2005;23(9):1826–1838. doi: 10.1200/JCO.2005.00.406 [DOI] [PMC free article] [PubMed] [Google Scholar]
- 7.Chauvin A, Wang CS, Geha S, et al. The response to neoadjuvant chemoradiotherapy with 5-fluorouracil in locally advanced rectal cancer patients: a predictive proteomic signature. Clin Proteomics. 2018;15:16. doi: 10.1186/s12014-018-9192-2 [DOI] [PMC free article] [PubMed] [Google Scholar]
- 8.Sabates-Bellver J, Van der Flier LG, de Palo M, et al. Transcriptome profile of human colorectal adenomas. Mol Cancer Res. 2007;5(12):1263–1275. doi: 10.1158/1541-7786.MCR-07-0267 [DOI] [PubMed] [Google Scholar]
- 9.Vlachavas EI, Pilalis E, Papadodima O, et al. Radiogenomic analysis of F-18-fluorodeoxyglucose positron emission tomography and gene expression data elucidates the epidemiological complexity of colorectal cancer landscape. Comput Struct Biotechnol J. 2019;17:177–185. doi: 10.1016/j.csbj.2019.01.007 [DOI] [PMC free article] [PubMed] [Google Scholar]
- 10.Snipstad K, Fenton CG, Kjaeve J, Cui G, Anderssen E, Paulssen RH. New specific molecular targets for radio-chemotherapy of rectal cancer. Mol Oncol. 2010;4(1):52–64. doi: 10.1016/j.molonc.2009.11.002 [DOI] [PMC free article] [PubMed] [Google Scholar]
- 11.Tang Z, Li C, Kang B, Gao G, Li C, Zhang Z. GEPIA: a web server for cancer and normal gene expression profiling and interactive analyses. Nucleic Acids Res. 2017;45(W1):W98–w102. doi: 10.1093/nar/gkx247 [DOI] [PMC free article] [PubMed] [Google Scholar]
- 12.Li S, Li Y, Chen B, et al. exoRBase: a database of circRNA, lncRNA and mRNA in human blood exosomes. Nucleic Acids Res. 2018;46(D1):D106–d112. doi: 10.1093/nar/gkx891 [DOI] [PMC free article] [PubMed] [Google Scholar]
- 13.da Huang W, Sherman BT, Lempicki RA. Systematic and integrative analysis of large gene lists using DAVID bioinformatics resources. Nat Protoc. 2009;4(1):44–57. doi: 10.1038/nprot.2008.211 [DOI] [PubMed] [Google Scholar]
- 14.Shannon P, Markiel A, Ozier O, et al. Cytoscape: a software environment for integrated models of biomolecular interaction networks. Genome Res. 2003;13(11):2498–2504. doi: 10.1101/gr.1239303 [DOI] [PMC free article] [PubMed] [Google Scholar]
- 15.Gao L, Zhang H, Cui J, et al. Single-cell transcriptomics of cardiac progenitors reveals functional subpopulations and their cooperative crosstalk in cardiac repair. Protein Cell. 2020. [DOI] [PMC free article] [PubMed] [Google Scholar]
- 16.Azim HA Jr, Peccatori FA, Brohée S, et al. RANK-ligand (RANKL) expression in young breast cancer patients and during pregnancy. Breast Cancer Res. 2015;17(1):24. doi: 10.1186/s13058-015-0538-7 [DOI] [PMC free article] [PubMed] [Google Scholar]
- 17.Nguyen LH, Goel A, Chung DC. Pathways of colorectal carcinogenesis. Gastroenterology. 2020;158(2):291–302. doi: 10.1053/j.gastro.2019.08.059 [DOI] [PMC free article] [PubMed] [Google Scholar]
- 18.Stintzing S. Management of colorectal cancer. F1000Prime Rep. 2014;6:108. doi: 10.12703/P6-108 [DOI] [PMC free article] [PubMed] [Google Scholar]
- 19.He HL, Lee YE, Shiue YL, et al. Overexpression of REG4 confers an independent negative prognosticator in rectal cancers receiving concurrent chemoradiotherapy. J Surg Oncol. 2014;110(8):1002–1010. doi: 10.1002/jso.23764 [DOI] [PubMed] [Google Scholar]
- 20.Numata M, Oshima T. Significance of regenerating islet-derived type IV gene expression in gastroenterological cancers. World J Gastroenterol. 2012;18(27):3502–3510. doi: 10.3748/wjg.v18.i27.3502 [DOI] [PMC free article] [PubMed] [Google Scholar]
- 21.Zhang Y, Lai M, Lv B, et al. Overexpression of Reg IV in colorectal adenoma. Cancer Lett. 2003;200(1):69–76. doi: 10.1016/S0304-3835(03)00460-9 [DOI] [PubMed] [Google Scholar]
- 22.Violette S, Festor E, Pandrea-Vasile I, et al. Reg IV, a new member of the regenerating gene family, is overexpressed in colorectal carcinomas. Int J Cancer. 2003;103(2):185–193. doi: 10.1002/ijc.10788 [DOI] [PubMed] [Google Scholar]
- 23.Sasaki N, Sachs N, Wiebrands K, et al. Reg4+ deep crypt secretory cells function as epithelial niche for Lgr5+ stem cells in colon. Proc Natl Acad Sci U S A. 2016;113(37):E5399–5407. doi: 10.1073/pnas.1607327113 [DOI] [PMC free article] [PubMed] [Google Scholar]
- 24.Kawasaki Y, Matsumura K, Miyamoto M, et al. REG4 is a transcriptional target of GATA6 and is essential for colorectal tumorigenesis. Sci Rep. 2015;5:14291. doi: 10.1038/srep14291 [DOI] [PMC free article] [PubMed] [Google Scholar]


