

Abstract
Background
Computerized methodologies standardize the myocardial perfusion imaging (MPI) interpretation process.
Methods
To develop an automated relative perfusion quantitation approach for 18F-flurpiridaz, PET MPI studies from all phase III trial participants of 18F-flurpiridaz were divided into 3 groups. Count distributions were obtained in n=40 normal patients undergoing pharmacological or exercise stress. Then, n=90 additional studies were selected in a derivation group. Following receiver operating characteristic curve analysis, various standard deviations below the mean were used as cutoffs for significant CAD, and interobserver variability determined. Finally, diagnostic performance was compared between blinded visual readers and blinded derivations of automated relative quantitation in the remaining n=548 validation patients.
Results
Both approaches yielded comparable accuracies for the detection of global CAD, reaching 71% and 72% by visual reads, and 72% and 68% by automated relative quantitation, when using CAD ≥70% or ≥50% stenosis for significance, respectively. Similar results were observed when analyzing individual coronary territories. In both pharmacological and exercise stress, automated relative quantitation demonstrated significantly more interobserver agreement than visual reads.
Conclusions
Our automated method of 18F-flurpiridaz relative perfusion analysis provides a quantitative, objective, and highly reproducible assessment of PET MPI in normal and CAD subjects undergoing either pharmacological or exercise stress.
Keywords: Flurpiridaz, PET MPI, Automated Relative Quantitation, Diagnostic Performance, Interobserver Variability
INTRODUCTION
In patients with apparently stable coronary artery disease (CAD), myocardial perfusion imaging (MPI) is a critical component in the determination of the hemodynamic significance of stenotic epicardial lesions and patient risk stratification.1,2 Despite multiple studies suggesting superior accuracy of positron emission tomography (PET) over single photon emission computed tomography (SPECT) MPI,3,4 particularly in female5,6 or obese7 patients, and in addition to lower radiation exposure,8 the widespread use of PET has been hampered by limitations of currently available radiopharmaceuticals.1 In this context, flurpiridaz, a novel 18F-based PET radiopharmaceutical with a half-life of 109 minutes available to imaging centers as unit doses, has undergone phase I-III multicenter clinical investigation.9–11
Relative perfusion assessed visually by radiotracer count distribution in regional myocardial tissue following image reconstruction remains the mainstay of MPI interpretation.12 To help standardize image interpretation and reduce intra- and interobserver variability, automated approaches to MPI have been developed for SPECT and PET radiotracers.13 Extraction of these quantitative parameters of cardiac radionuclide distribution assist the interpreting physician14 and have been derived for 13N-ammonia15,16 and 82Rb-chloride.17,18
In the present study, we developed an automated method for relative quantitation of 18F-flurpiridaz MPI. First, using a reference group we determined a normal database of flurpiridaz count distribution in individual coronary territories and in the global left ventricular myocardium. Then, using a derivation group we developed the lower limits of normal count distribution and the cutoffs for assessment of significant CAD in both pharmacological and exercise stress testing. Subsequently, we assessed the interobserver variability in the automated and visual approaches. Finally, we validated this method in a large group of patients from the phase III clinical trial of 18F-flurpiridaz by comparing performance metrics of automation with expert blinded visual reads using invasive coronary angiography as the reference standard.
MATERIAL AND METHODS
Patient population
PET MPI studies from all evaluable patients in the phase III trial of 18F-flurpiridaz11 (Lantheus Medical Imaging, ClinicalTrials.gov identifier: NCT01347710) suitable for quantitative analysis were included (n=678) (Fig. 1). All the patients signed an informed consent approved by the local institutional review boards. Patients were divided into 3 groups (Fig. 1 and Table 1). Group 1: n=40 normal patients to determine normal count distributions. Group 2: n=90 derivation patients to establish i) the lower limits of normal flurpiridaz count distributions in each coronary territory by determining the standard deviations below mean normal counts associated with the highest receiver operating characteristic (ROC) area under the curve (AUC) for CAD ≥50% and CAD ≥70% detection in both pharmacological (n=45) and exercise stress (n=45), ii) the abnormality cutoff values to detect CAD by re-deriving activity maps for repeat ROC analyses, i.e. the % perfusion deficit displaying abnormal tracer distribution below normal limits leading to the best sensitivity/specificity tradeoff for CAD diagnosis, and iii) the interpretation variability. Group 3: n=548 validation patients used to calculate the diagnostic performance of the automated perfusion quantitation approach and compare performance metrics with majority visual reads.
Figure 1.
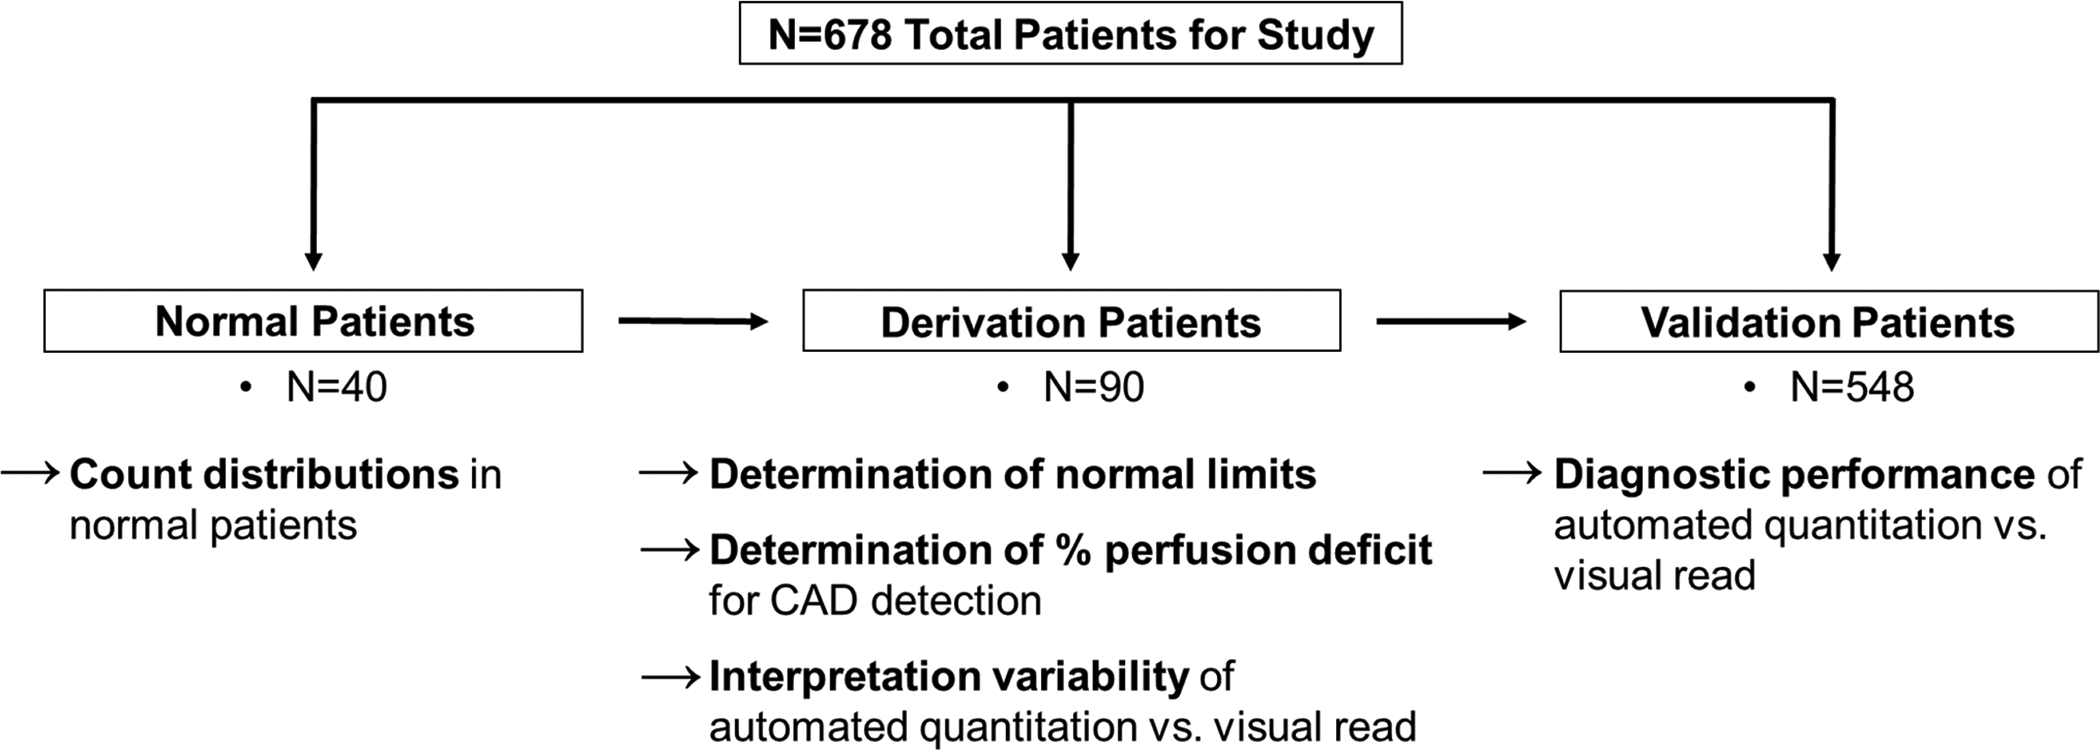
Study Patients.
Table 1.
Patient Characteristics.
| Normal Patients | Derivation Patients | Validation Patients | ||||
|---|---|---|---|---|---|---|
| Pharm (n=20) | Exercise (n=20) | Pharm (n=45) | Exercise (n=45) | Pharm (n=404) | Exercise (n=144) | |
| Age, years | 61 ± 7 | 58 ± 11 | 63 ± 11 | 63 ± 11 | 62 ± 9 | 62 ± 10 |
| Gender, male | 10 (50) | 11 (55) | 31 (69) | 34 (76) | 266 (66) | 115 (80) |
| Hypertension | 0 (0) | 0 (0) | 20 (44) | 16 (36) | 350 (87) | 115 (80) |
| Dyslipidemia | 16 (80) | 13 (65) | 39 (87) | 40 (89) | 357 (88) | 120 (83) |
| Diabetes mellitus | 0 (0) | 0 (0) | 13 (29) | 19 (42) | 155 (38) | 43 (30) |
| Tobacco use history | 12 (60) | 11 (55) | 26 (58) | 21 (47) | 245 (61) | 92 (64) |
| Family history of CAD | 10 (50) | 15 (75) | 22 (49) | 25 (56) | 242 (60) | 78 (54) |
| BMI | 31 ± 8 | 29 ± 5 | 31 ± 7 | 29 ± 6 | 32 ± 7 | 30 ± 6 |
| LVEF, % | 63 ± 7 | 60 ± 5 | 59 ± 11 | 61 ± 7 | 58 ± 11 | 58 ± 11 |
| No CAD * | 20 (100) | 20 (100) | 20 (44) | 20 (44) | 201 (50) | 82 (57) |
| 1-vessel CAD | — | — | 12 (27) | 11 (25) | 99 (24) | 37 (26) |
| 2-vessel CAD | — | — | 7 (16) | 8 (18) | 52 (13) | 10 (7) |
| 3-vessel CAD | — | — | 6 (13) | 6 (13) | 52 (13) | 15 (10) |
Patient characteristics according to study group and mode of stress. Values are presented as mean ± standard deviation or n (%). CAD defined as stenosis ≥ 50% by invasive angiography.
No CAD defined as <35% stenosis in normal patients, and <50% stenosis in the derivation and validation patients.
Legend. BMI: body mass index expressed as kg/m2. CAD: coronary artery disease. LVEF: left ventricular ejection fraction. Pharm: pharmacological.
Automated relative perfusion quantitation
LV myocardial perfusion distributions were represented using polar maps.19,20 Transaxial data was automatically resized to cubic voxels and a 3D isotropic Gaussian filter with 8.0mm full width at half-maximum (FWHM) and a 7-pixel slice thickness optimized for the automated process was applied. Then, transaxial data was manually reoriented into short axis data by specifying the two reorientation angles (transaxial and reference vertical long axis) on the ungated filtered transaxial data. These angles were then automatically applied to the gated filtered transaxial data. The resultant gated and ungated data were then imported into the Emory Cardiac Toolbox v4, where the automatic processing parameters (center, radius-of-search, apex and base) were quality controlled and modified when necessary. The 3-dimensional maximal LV count distribution was synthesized onto a single 2-dimensional polar map.14 Each study was processed and sampled using a 3-dimensional hybrid sampling scheme to extract myocardial tracer distribution and search for maximal counts along a radius perpendicular to the myocardial wall.20 Normal distributions (mean, standard deviation) were determined for rest, pharmacological stress, and exercise stress myocardial perfusion.19 Profile normalization for normal limit comparison was performed only on the stress images by determining a scale factor that normalizes the mean of the most normal area of the patient’s profiles to the mean of the same area in the normal limit database. In the derivation group, areas under the curve from ROC analyses were determined using 2.0, 2.5, or 3.0 standard deviations below the mean normal as the threshold for significant CAD for all pixels in the myocardium. Automated relative quantitation was performed by 2 independent nuclear cardiology processing personnel in a blinded manner who could override the default automatic parameters.
Diagnostic analyses and interpretation variability
Accuracy, sensitivity, and specificity were compared between visual reads and automated relative quantitation in the validation group. For visual reads, the majority blinded read from the phase III clinical trial core was used. For automated relative quantitation, one derivation of the data (Observer 1) was used. Analyses were compared to quantitative invasive coronary angiography in all the validation patients and in the pharmacological stress and exercise stress only patients. Interobserver agreement was assessed in the derivation group separately for pharmacological and exercise stress, further subdivided into normal, CAD ≥70% or ≥50% stenosis conditions. Interobserver agreements were determined for visual reads and for independent derivations of automated relative quantitation. Degrees of agreement based on the Kappa or AC1 value were defined as previous: 0–0.2 =slight, 0.2–0.4 =fair, 0.4–0.6 =moderate, 0.6–0.8 =substantial, and 0.8–1.0 =almost perfect.
See online Supplements for additional information on patient selection, stress protocol, PET image processing, and statistical analyses.
RESULTS
Normal flurpiridaz count distribution and determination of CAD thresholds
In normal patients undergoing either pharmacological stress or treadmill exercise (Fig. 2), flurpiridaz myocardial counts were reduced in the basal septum due to the membranous septum, and in the apex due to apical thinning. In the remaining LV segments, count distributions were uniform. In the derivation group, we then determined the standard deviation (SD) thresholds below mean normal counts leading to the highest ROC AUC for CAD detection in both pharmacological stress (Table 2A) and treadmill exercise (Table 2B). Our results indicate that for both pharmacological and exercise stress, the highest sensitivity/specificity tradeoff was achieved with the criterion of ≥8% LV myocardium displaying abnormal counts for CAD ≥50% stenosis, and ≥12% of the LV myocardium for CAD ≥70. The above criteria for abnormality were true both for global CAD and individual territory CAD detection.
Figure 2. Polar Maps of Flurpiridaz in Normal Patients.
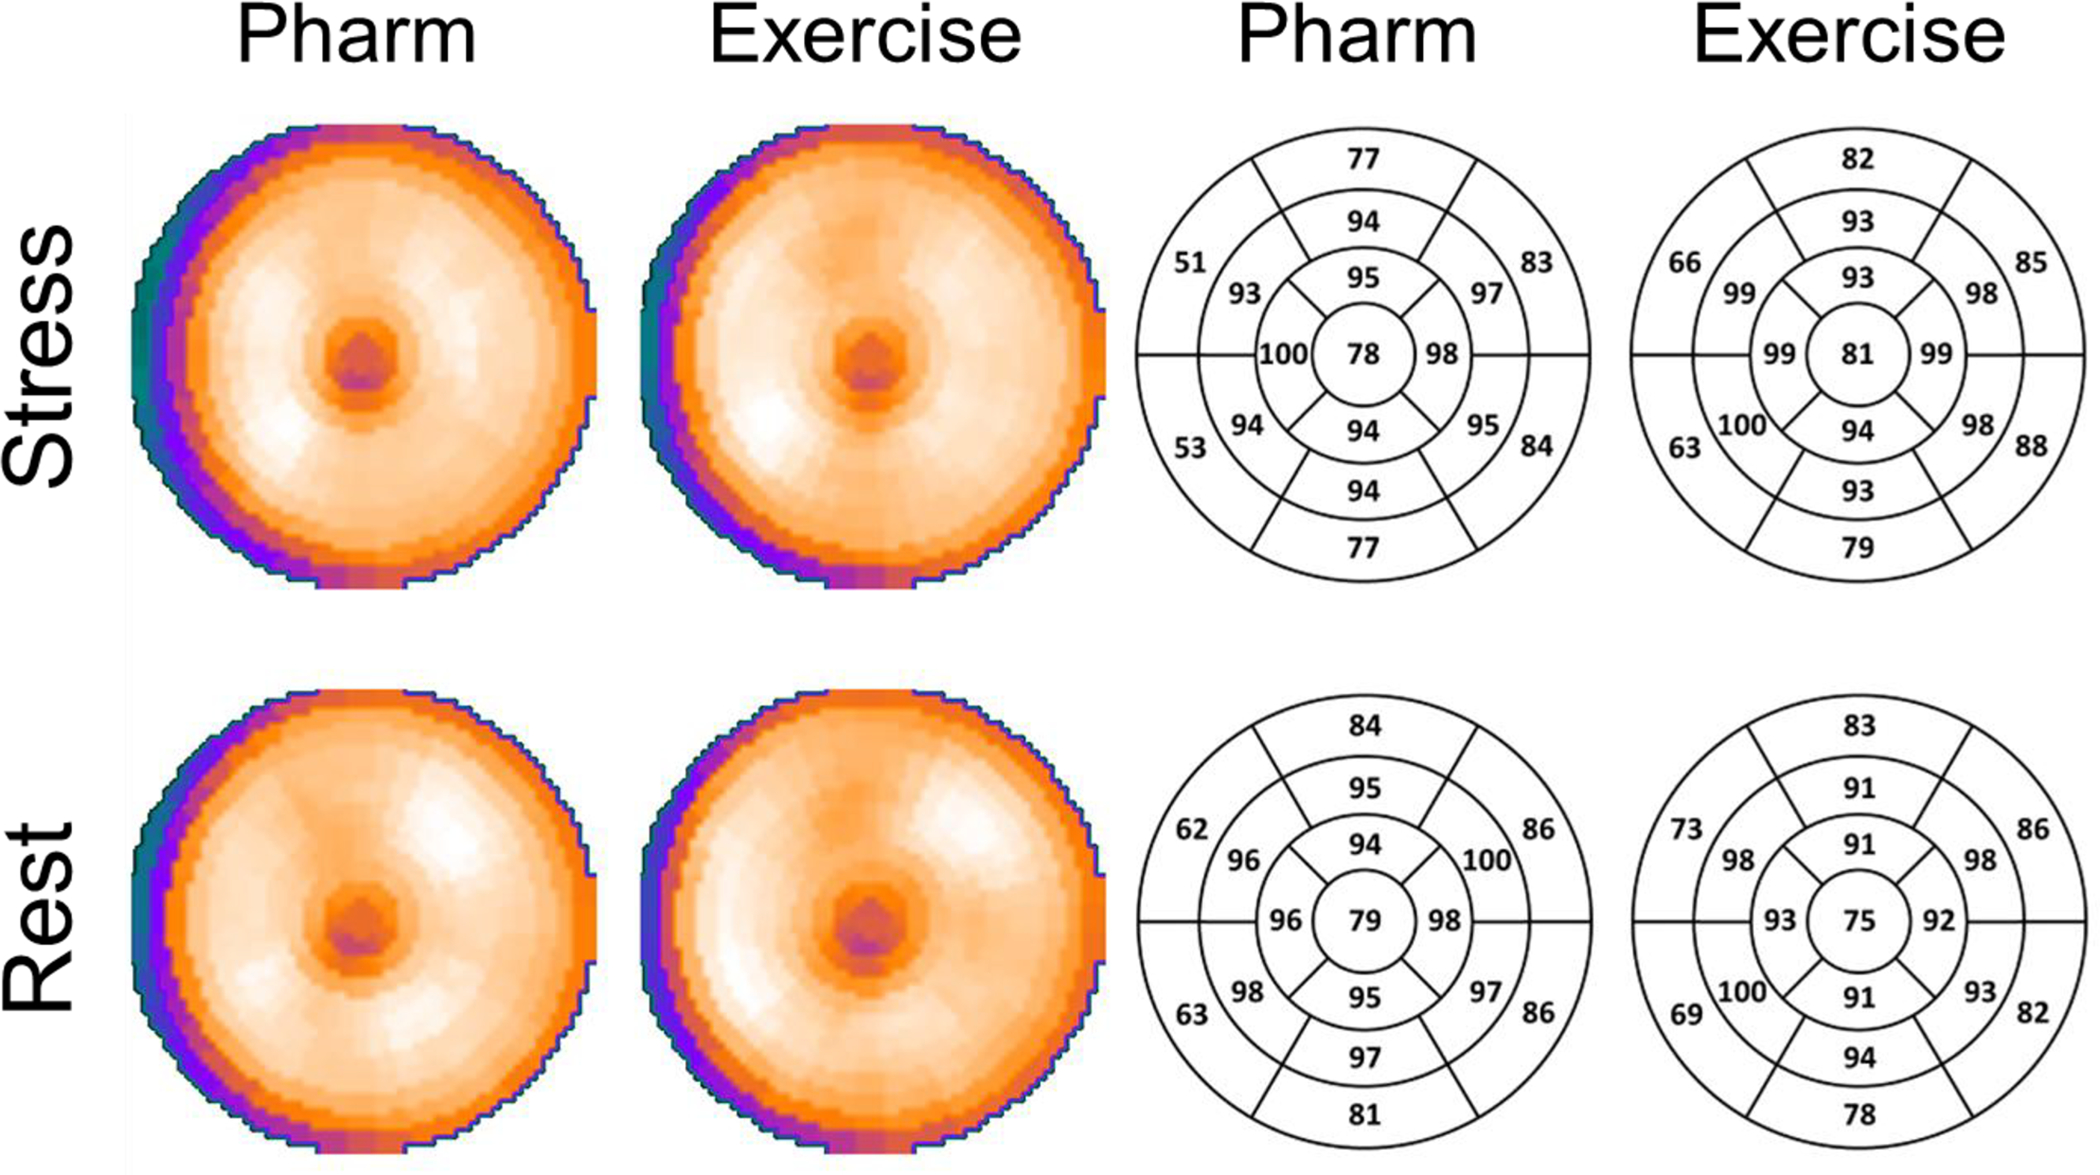
Polar maps of the mean flurpiridaz count distribution with relative color intensity and corresponding numerical values in a 17-segment model. Results at rest and with pharmacological and exercise stress in normal patients are presented. The Rest row depicts results obtained from the rest studies of the same patients who underwent either pharmacological or exercise stress. Flurpiridaz myocardial counts were reduced in the basal septum due to the membranous septum. The distal apex demonstrates lower intensity values, reflecting the ability of flurpiridaz to provide images with high resolution in this anatomically thin segment. Flurpiridaz count distributions were uniform in the remaining segments.
Table 2A.
Receiver Operating Characteristic - Areas Under the Curve with Confidence Intervals of Automated Perfusion Quantitation in Pharmacological Stress Patients.
| LAD | LCx | RCA | ||||
|---|---|---|---|---|---|---|
| SD Below Mean Normal Counts | CAD ≥ 50% | CAD ≥ 70% | CAD ≥ 50% | CAD ≥ 70% | CAD ≥ 50% | CAD ≥ 70% |
| 2.0 | 0.739 (0.572–0.906) |
0.889 (0.750–1.000) |
0.759
(0.599–0.919) |
0.853
(0.700–1.000) |
0.848 (0.710–0.986) |
0.912 (0.819–1.000) |
| 2.5 | 0.762 (0.607–0.917) |
0.902 (0.779–1.000) |
0.705 (0.527–0.884) |
0.787 (0.593–0.981) |
0.853
(0.726–0.980) |
0.912 (0.819–1.000) |
| 3.0 |
0.800
(0.661–0.938) |
0.929
(0.822–1.000) |
0.713 (0.550–0.876) |
0.796 (0.615–0.976) |
0.850 (0.720–0.981) |
0.926
(0.845–1.000) |
The numerically highest ROC AUC’s are highlighted in bold.
Legend. CAD: coronary artery disease. LAD: left anterior descending artery. LCx: left circumflex artery. RCA: right coronary artery. SD: standard deviation.
Table 2B.
Receiver Operating Characteristic - Areas Under the Curve with Confidence Intervals of Automated Perfusion Quantitation in Exercise Stress Patients.
| LAD | LCx | RCA | ||||
|---|---|---|---|---|---|---|
| SD Below Mean Normal Counts | CAD ≥ 50% | CAD ≥ 70% | CAD ≥ 50% | CAD ≥ 70% | CAD ≥ 50% | CAD ≥ 70% |
| 2.0 | 0.802 (0.668–0.935) |
0.869 (0.739–0.999) |
0.868
(0.732–1.000) |
0.903
(0.768–1.000) |
0.833 (0.685–0.981) |
0.958
(0.873–1.000) |
| 2.5 |
0.829
(0.707–0.950) |
0.880
(0.750–1.000) |
0.810 (0.650–0.970) |
0.869 (0.709–1.000) |
0.827 (0.672–0.982) |
0.916 (0.750–1.000) |
| 3.0 | 0.775 (0.649–0.902 |
0.810 (0.646–0.974) |
0.820 (0.673–0.967) |
0.883 (0.734–1.000) |
0.853
(0.720–0.987) |
0.921 (0.775–1.000) |
Diagnostic performance of visual read vs. automated quantitation
For the detection of global CAD in the combined pharmacological and exercise stress groups (n=548), visual reads yielded a diagnostic accuracy of 71% for CAD ≥70%, and 72% for CAD ≥50% stenosis (Fig. 3A, Suppl. Table 1). Automated relative quantitation achieved a similar accuracy of 72% for CAD ≥70%, and 68% for CAD ≥50% identification (Fig. 3A, Suppl. Table 1) (P-values not significant). In the pharmacological stress subroup (n=404), the diagnostic accuracy for global CAD was 72% for CAD ≥70%, and 74% for CAD ≥50% by visual reads (Fig. 3B, Suppl. Table 2). The accuracy of automated quantitation in the pharmacological stress subgroup was 73% for CAD ≥70%, and 68% for CAD ≥50% (Fig. 3B, Suppl. Table 2) (P-values not significant). In the treadmill exercise subgroup (n=144), the diagnostic accuracy of visual reads was 66% for CAD ≥70%, and 65% for CAD ≥50% (Fig. 3C, Suppl. Table 3). The diagnostic accuracy of automated quantitation in this subgroup was 68% for CAD ≥70%, and 65% for CAD ≥50% (Fig. 3C, Suppl. Table 3) (P-values not significant). Similarly, there were no significant differences in diagnostic performance between visual reads and automated relative perfusion quantitation when analyzing individual coronary territories (P-values not significant for all comparisons other than left circumflex sensitivity and specificity in combined stress or pharmacological only stress, however only in CAD ≥50% analyses).
Figure 3A. Diagnostic Performance in Pharmacological and Exercise Stress.
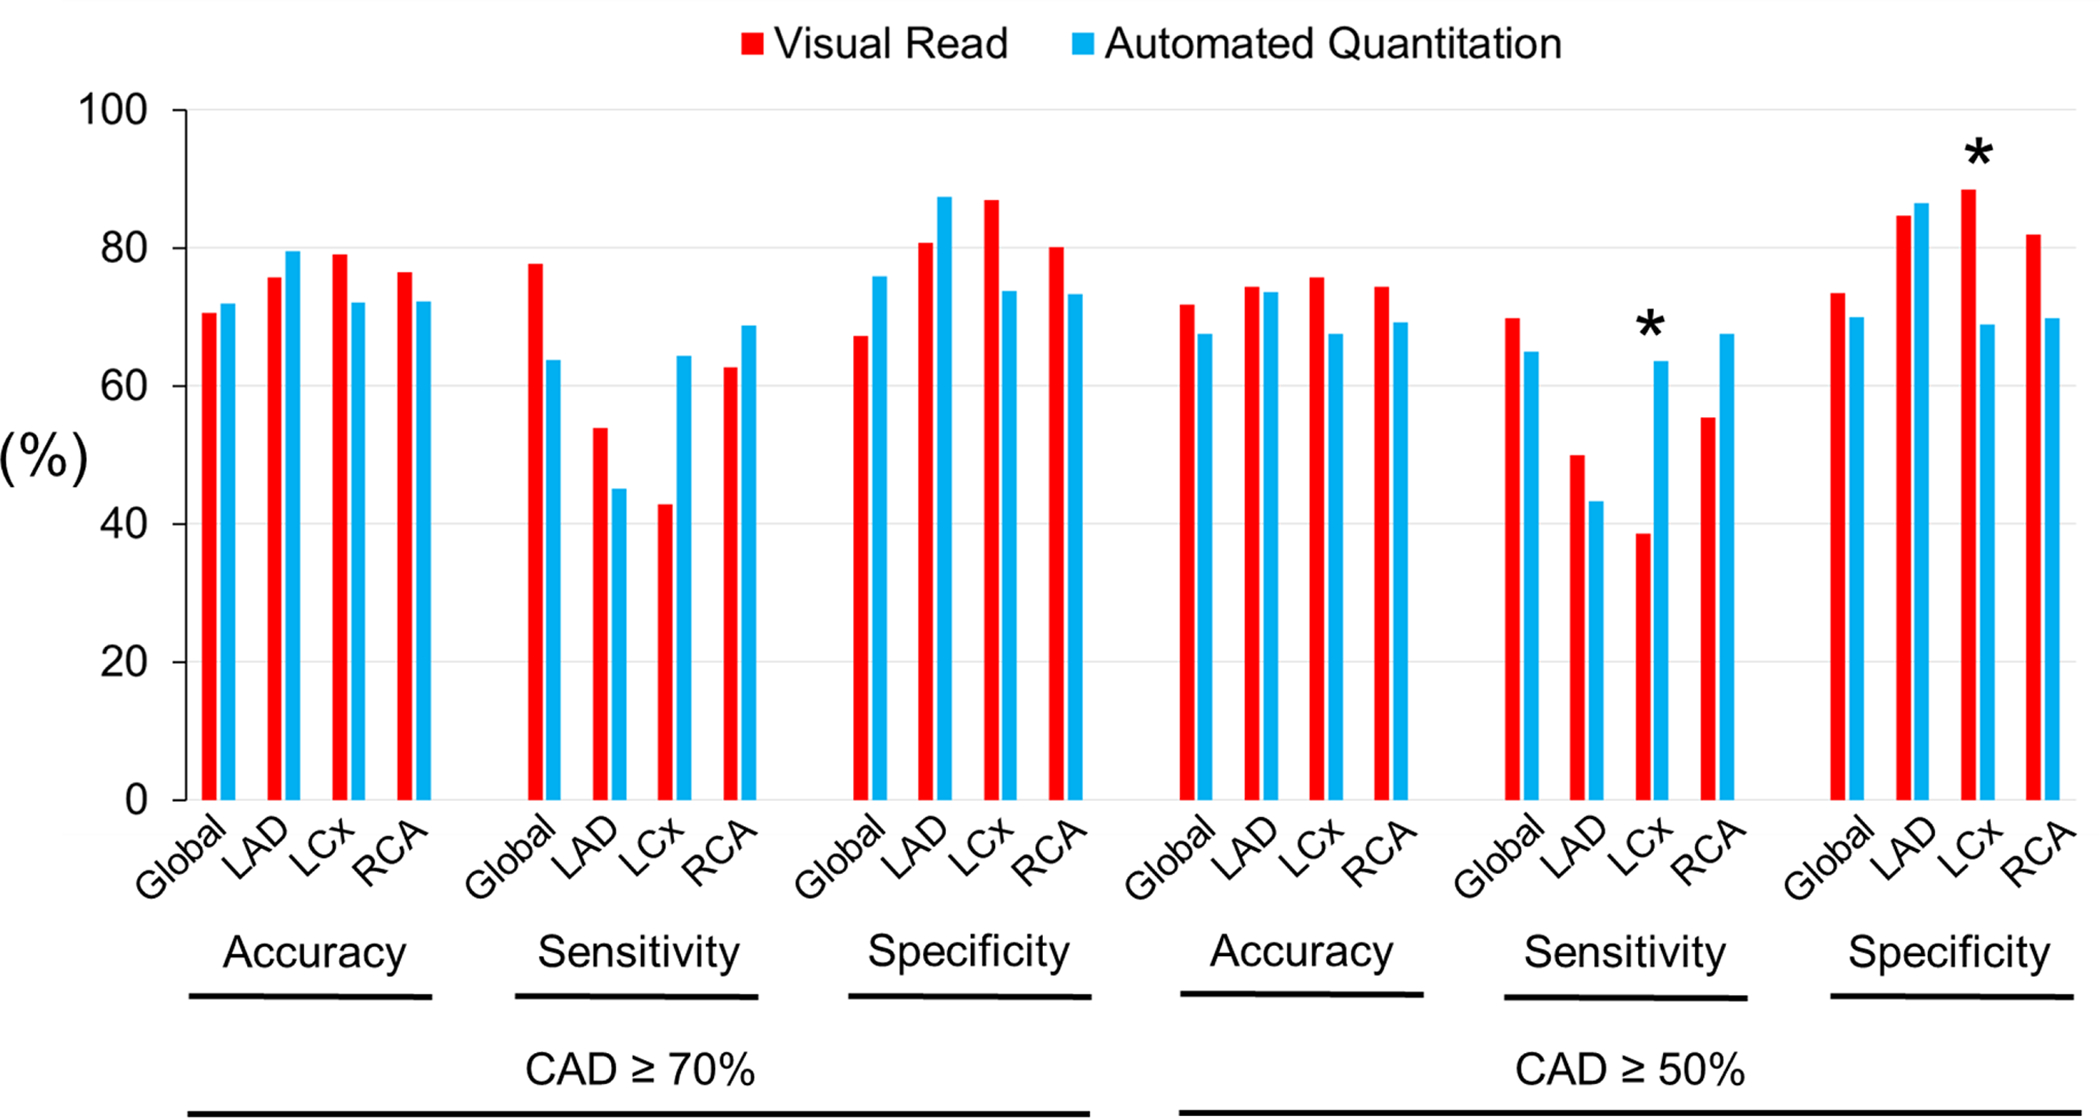
Comparison of performance metrics of visual reads vs. automated relative quantitation with the reference standard of angiographically determined CAD. * P <0.05.
Figure 3B. Diagnostic Performance in Pharmacological Stress.
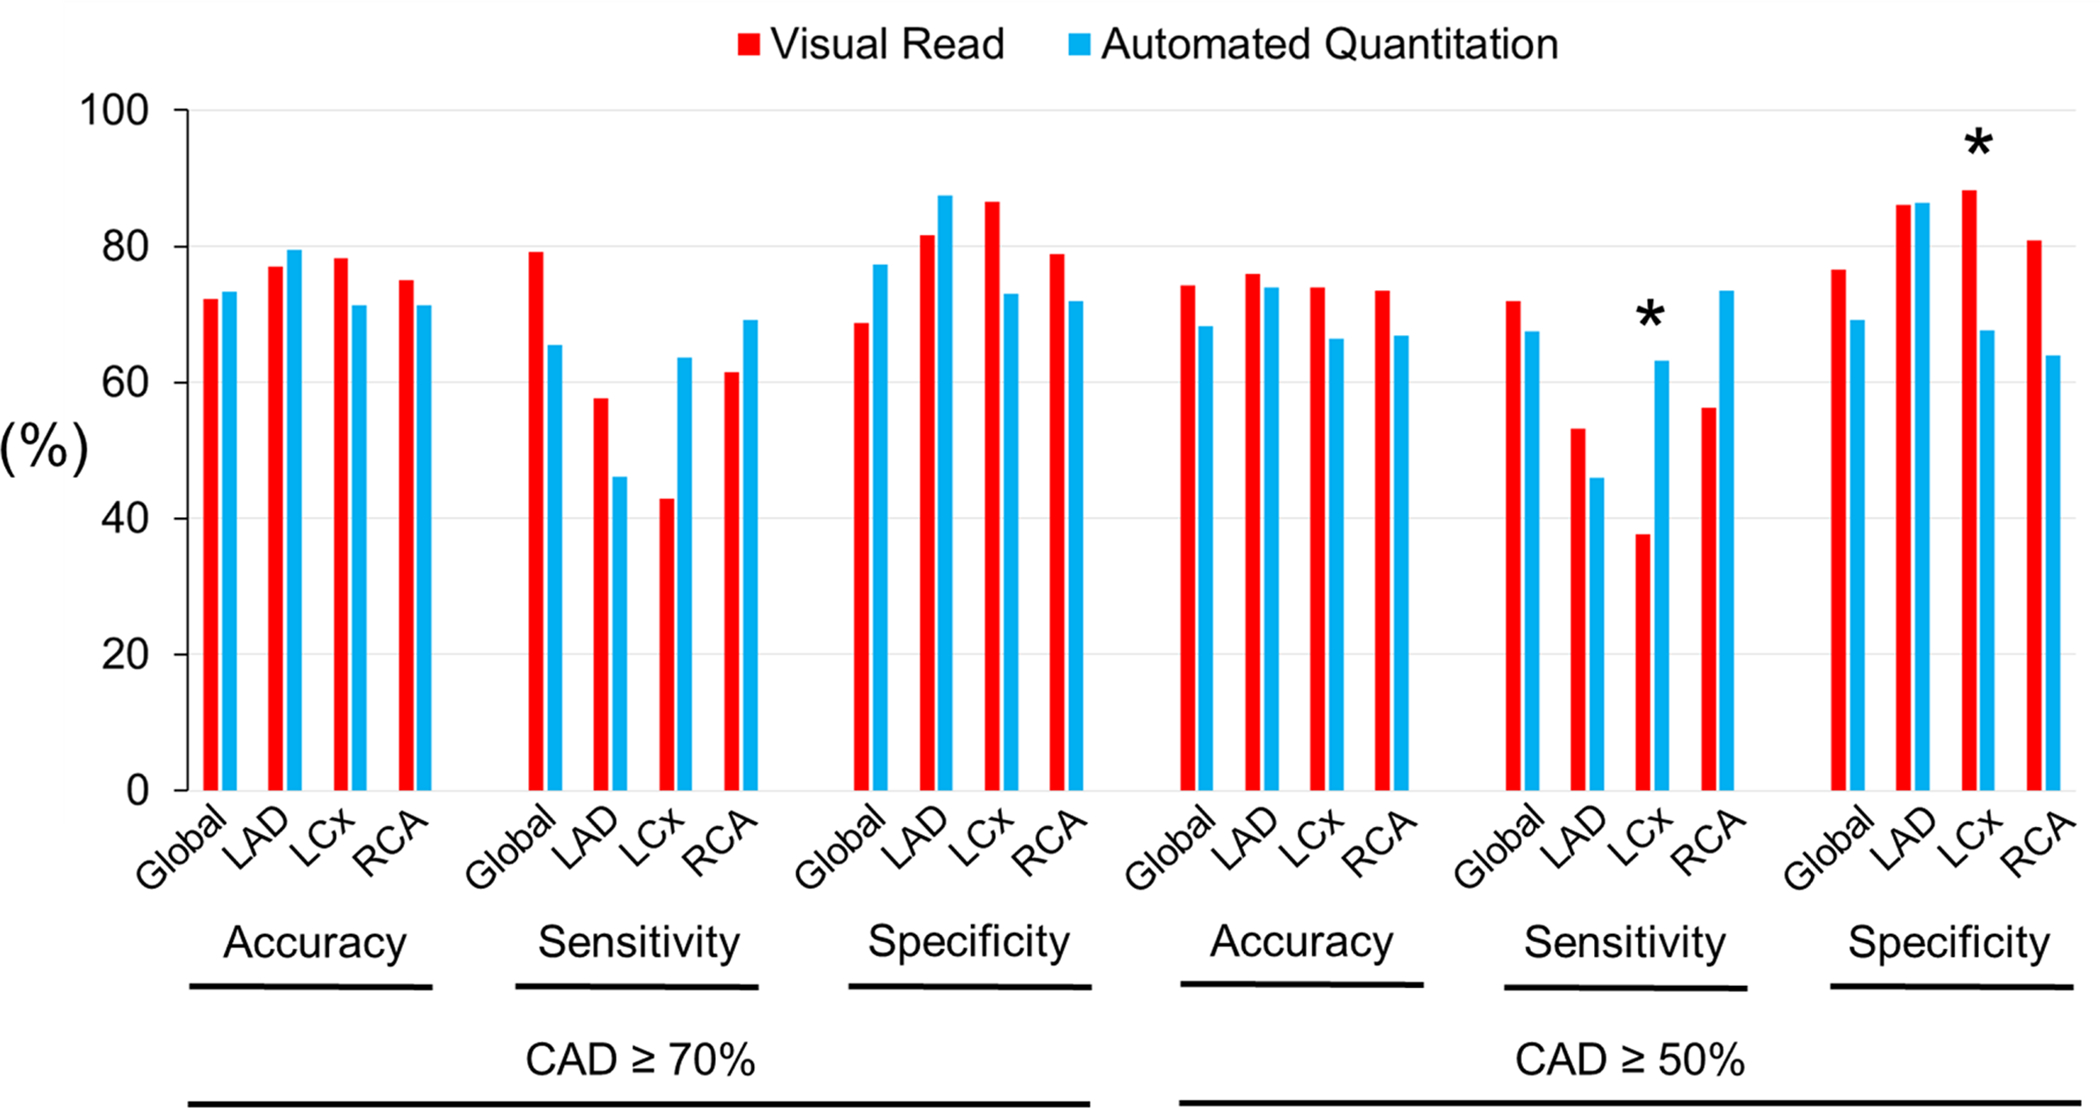
* P <0.05.
Figure 3C.
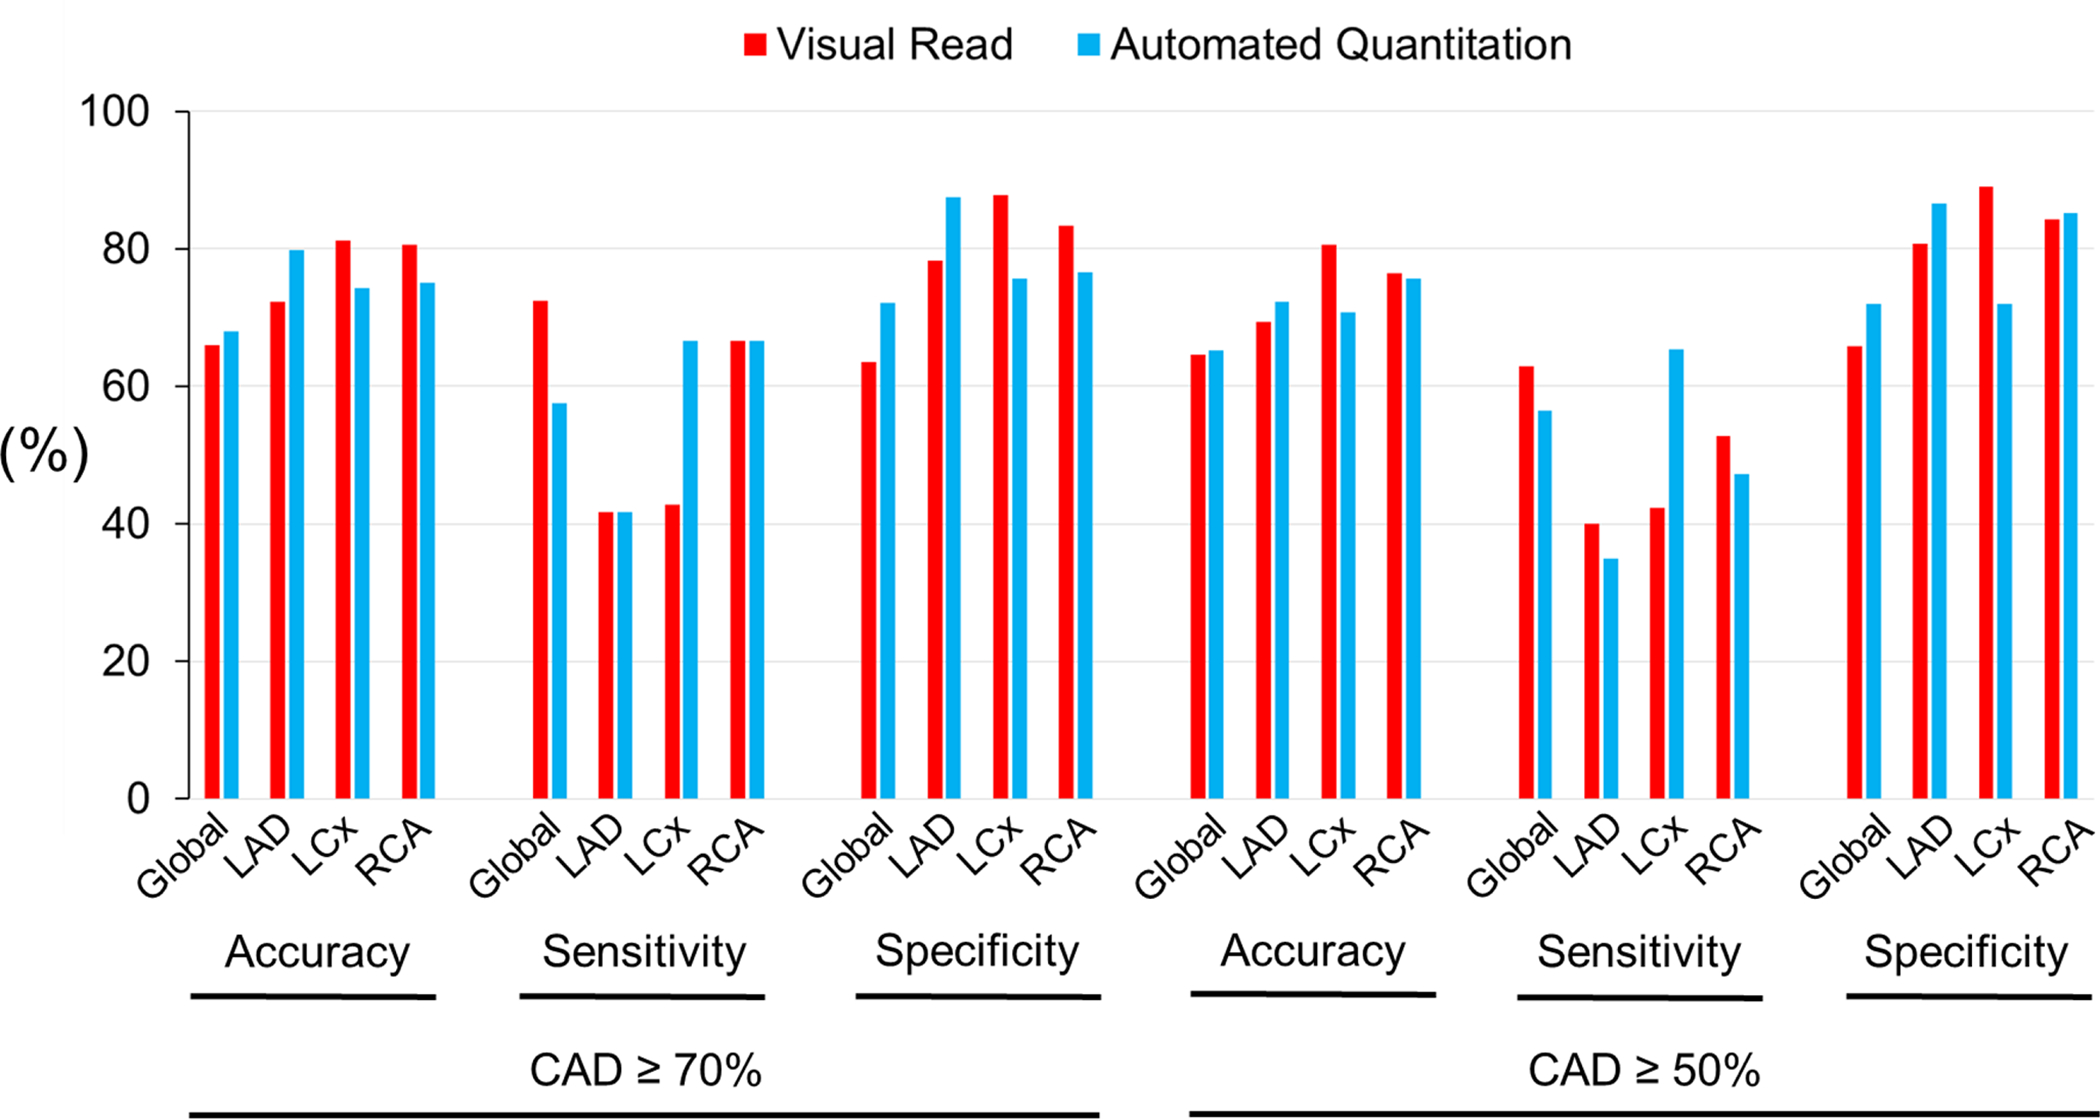
Diagnostic Performance in Exercise Stress.
Interpretation variability of visual reads vs. automated quantitation
In the pharmacological stress subgroup, interobserver agreement for automated relative quantitation was ‘almost perfect’ (0.80–1.00) in global and in individual territories, regardless of whether studies were categorized as normal or as CAD (Fig. 4A, Suppl. Table 4). On the other hand, interobserver agreement in visual reads were ‘moderate’ (0.40–0.60) to ‘substantial’ (0.60–0.80) (Fig. 4A, Suppl. Table 4). In the treadmill exercise subgroup, automated relative quantitation achieved an ‘almost perfect’ degree of agreement across the spectrum of analyses, i.e. normal, CAD ≥70% or ≥50% stenosis, ranging from 0.91 to 1.00 (Fig. 4B, Suppl. Table 5). However, the interobserver agreement for visual analysis was ‘fair’ (0.20–0.40) to ‘moderate’ (0.400.60) in normal territories, and ‘moderate-substantial’ (0.40–0.80) in CAD territories (Fig. 4B, Suppl. Table 5). Overall, automated relative quantitation demonstrated significantly less variability than visual reads in both the pharmacological and treadmill exercise subgroups.
Figure 4A. Interobserver Agreement in Pharmacological Stress.
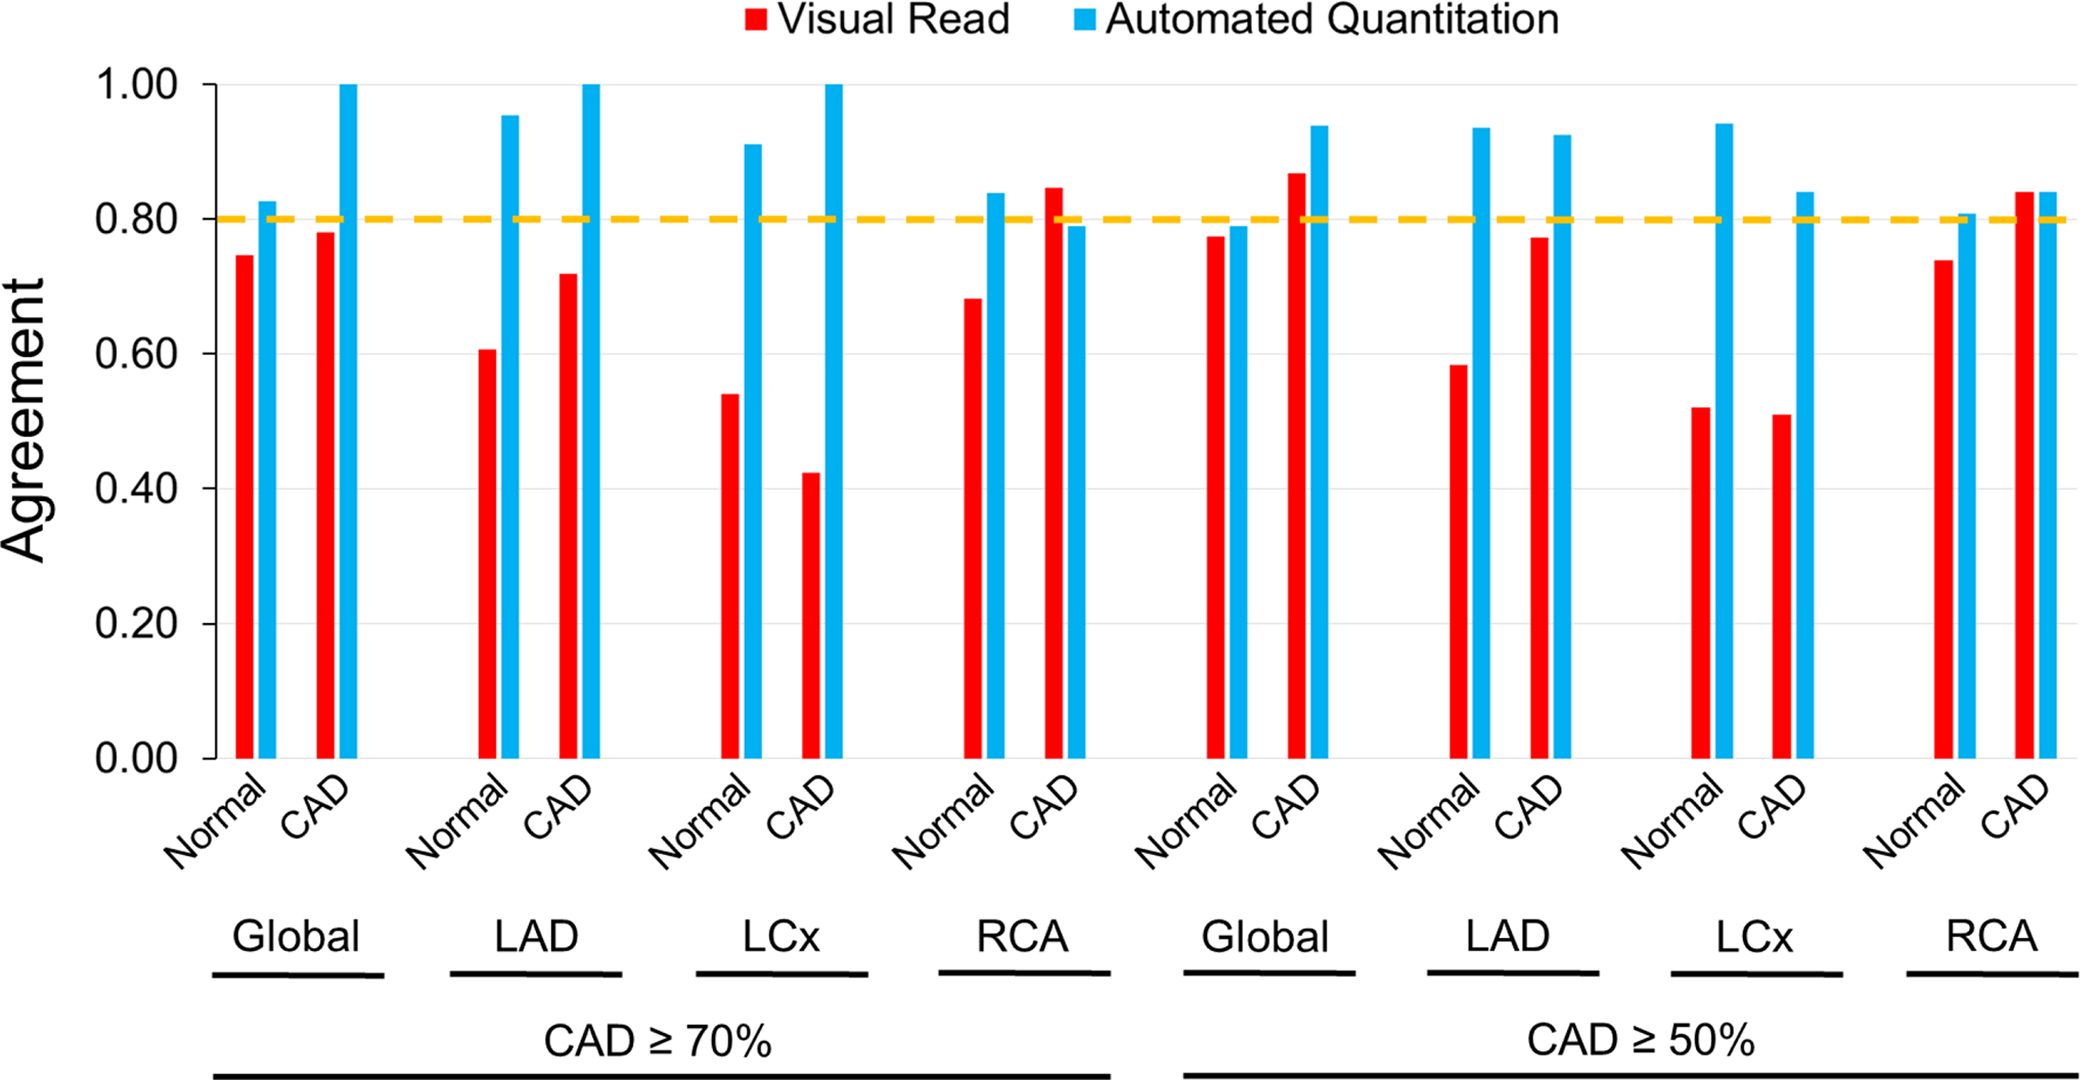
Interobserver agreement in visual reads vs. automated relative quantitation in normal and CAD territories following pharmacological stress. The dotted horizontal line indicates the cutoff above which an ‘almost perfect’ (0.80–1.00) agreement was characterized.
Figure 4B.
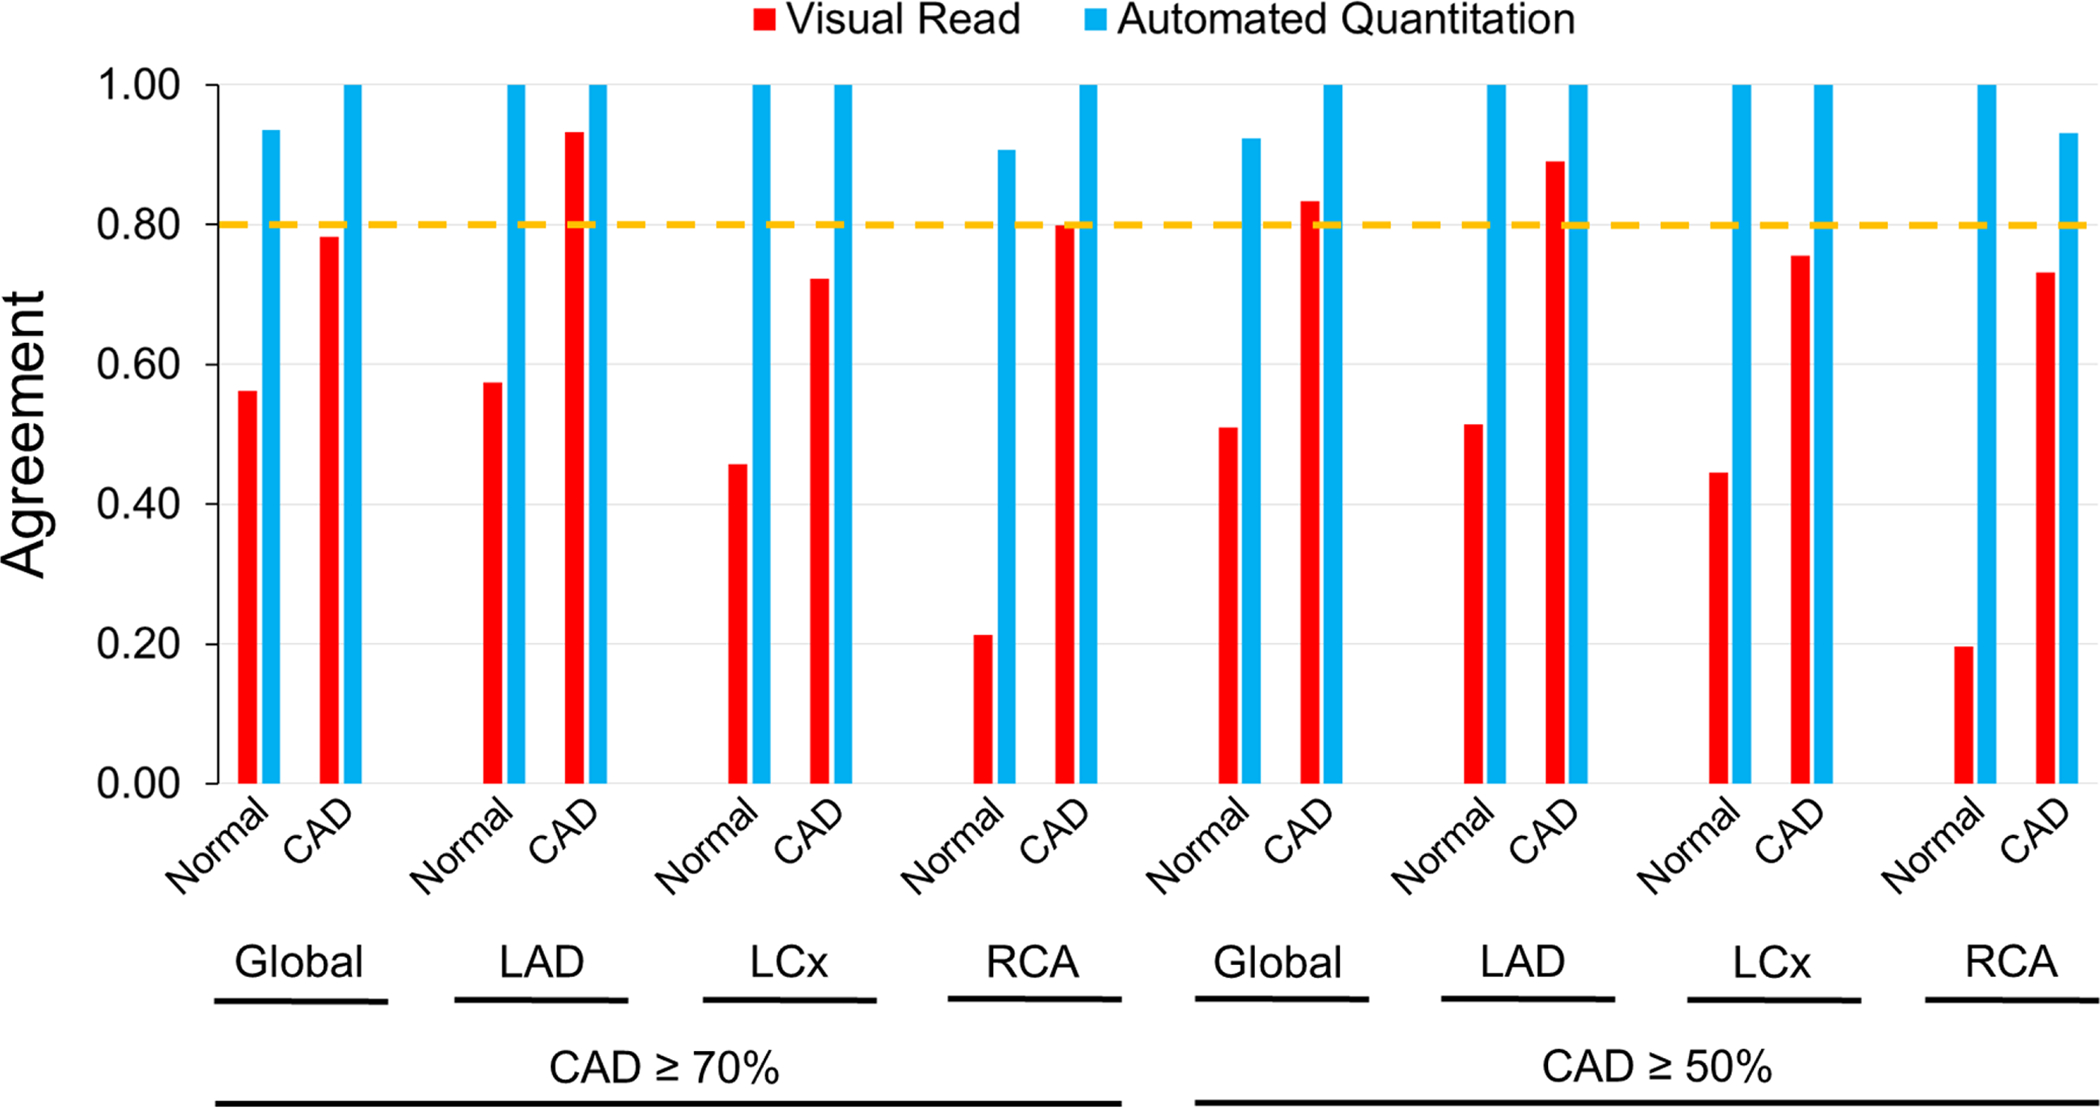
Interobserver Agreement in Exercise Stress.
Illustrative examples of a normal patient with discordant (Fig. 5A) and a CAD patient with concordant (Fig. 5B) visual and automated quantitation diagnostic results are shown.
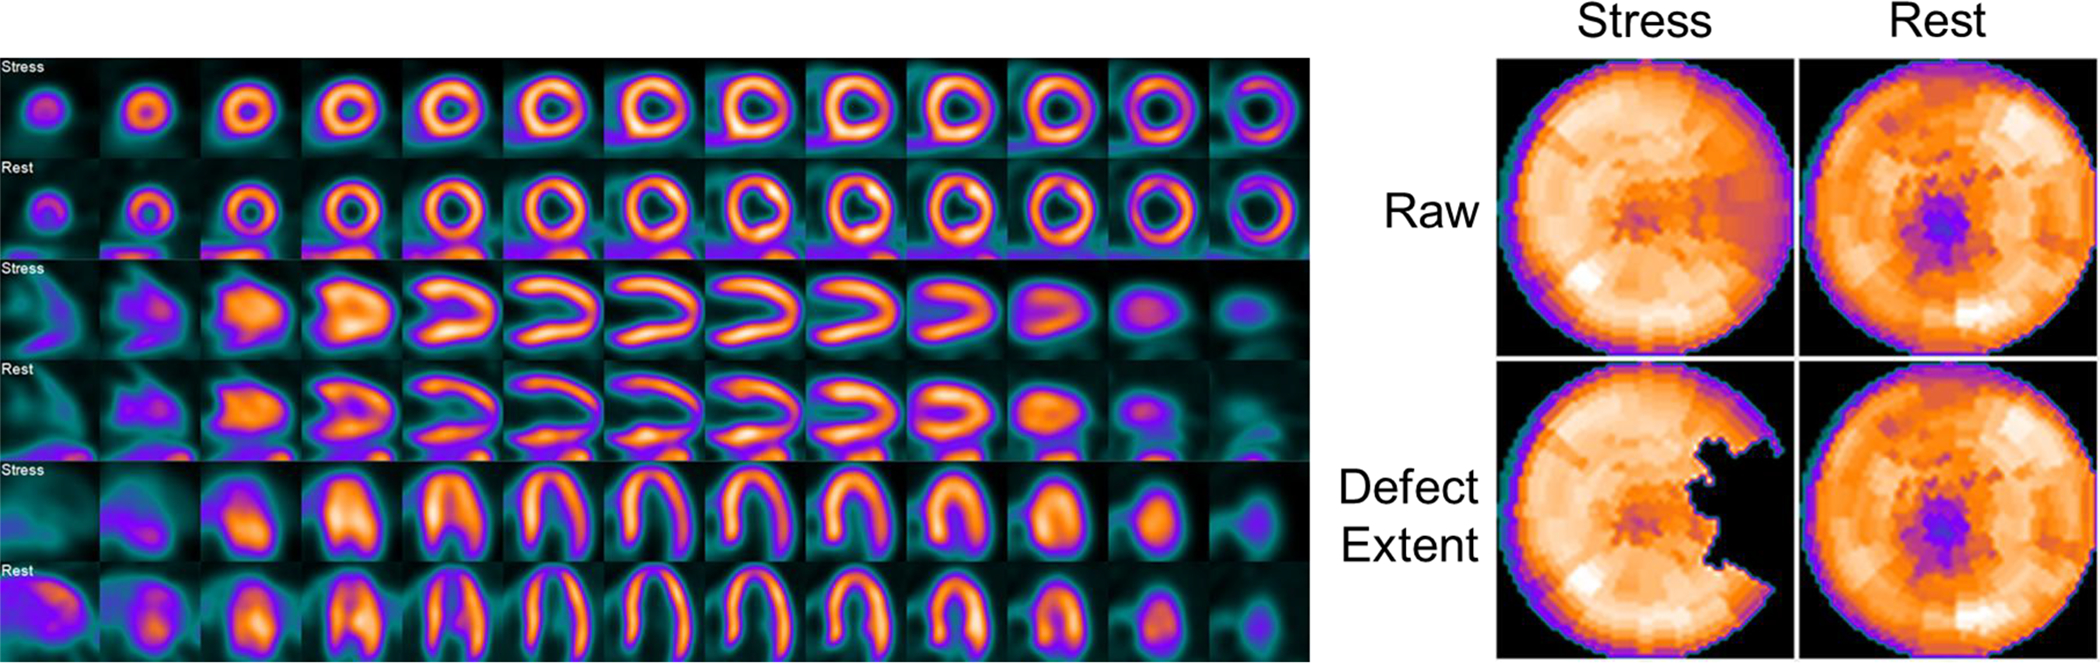
Figure 5A. Example of a discordant interpretation between visual read and automated relative quantitation of flurpiridaz MPI in a normal patient undergoing pharmacological stress.
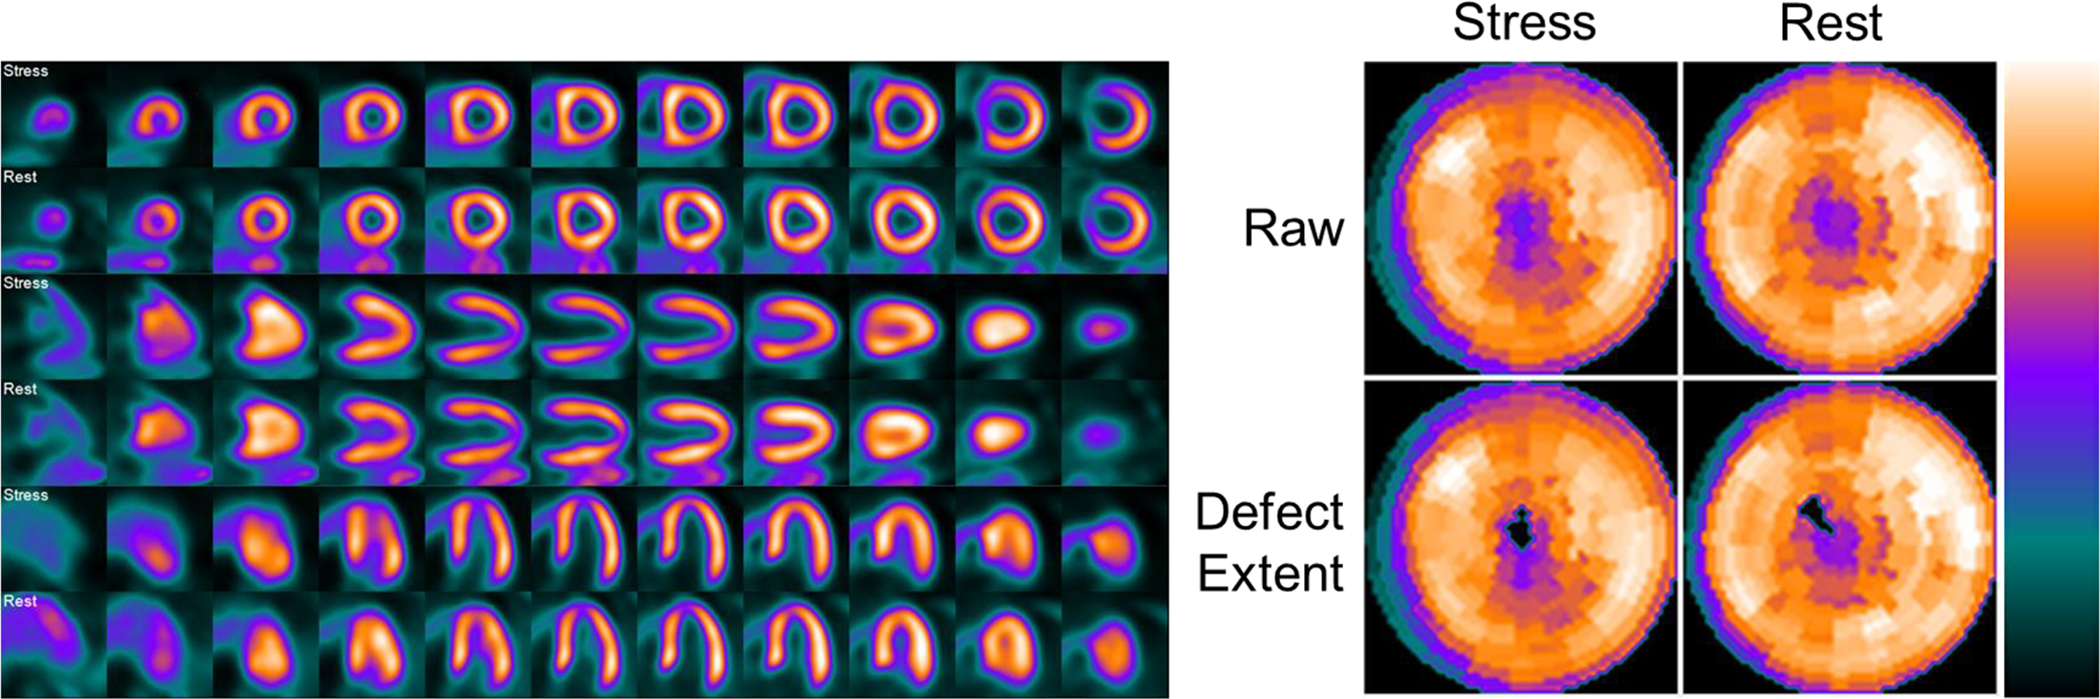
65 year old female with atypical angina and an intermediate pre-test probability of CAD. Invasive coronary angiography demonstrated 0% stenosis in all territories. The inferior wall was interpreted as stress-inducible ischemia by visual reads, constituting a false-positive, whereas the automated relative quantitation approach correctly identified a normal perfusion scan (1% deficit). The defect extent shows the raw perfusion polar map with pixels that fall below the normal criteria set to 0, i.e. blacked-out.
Figure 5B. Example of a concordant interpretation between visual read and automated relative quantitation of flurpiridaz MPI in a CAD patient undergoing exercise stress.
42 year old male with typical angina and a high pre-test probability of CAD. Invasive coronary angiography was significant for a 76% stenosis in the LCx artery, and 0% stenosis in the other territories. The LCx territory/lateral wall was correctly interpreted as demonstrating stress-inducible ischemia by both visual reads and automated relative quantitation (14% deficit).
DISCUSSION
We present the development and validation of an automated relative quantitation method of 18F-flurpiridaz PET MPI. To this end, we determined normal count distributions of flurpiridaz, established normal limits and criteria for abnormality, scrutinized interobserver agreement, and assessed the diagnostic performance of our computerized method in a large population of patients from the phase III clinical trial of 18F-flurpiridaz. To extract 3-dimensional myocardial maximal count distribution of flurpiridaz, we adapted an approach validated in previous radiotracers13,14,20,21 by using spherical coordinates to sample the apical region and cylindrical coordinates to sample the remaining LV myocardium.20 Our automated approach was tested over a wide range of conditions in normal, and 1-, 2-, and 3-vessel CAD patients from a prospective, multicenter, phase III clinical trial of flurpiridaz.
The unique characteristics of flurpiridaz, including 18F labeling with 109 minute half-life, possibility to order as unit doses, ability to perform exercise stress in routine clinical practice in addition to pharmacological stress, very high cardiac extraction fraction, ideal suitability for absolute myocardial blood flow quantitation, and low positron range, constitute a significant addition to the currently available PET radiotracers.1,9–11,22–24 Our study further paves the way for a clinically useful automated application of relative flurpiridaz perfusion assessment. Overall, diagnostic performance was comparable when derived by automated relative quantitation vs. visual reads, thereby establishing the non-inferiority of the present automated approach compared to the visual interpretation of expert readers. Our automated method has the added advantage of an ‘almost perfect’ degree of agreement with minimal interobserver variability in both normal and CAD territories which was superior to the one achieved by expert readers. Additionally, we developed automation for rest images that will permit detection of defect reversibility in future applications. Thus, we anticipate our approach will provide valuable assistance to 18F-flurpiridaz PET MPI interpreting physicians, particularly because of limited or no experience with this new tracer.
Previous PET MPI studies scrutinized performance metrics of automated relative quantitation following pharmacological stress with 82Rb-chloride or 13N-ammonia. For the endpoint of global CAD ≥70% detection with 82Rb-chloride, Santana et al. reported an accuracy of 85%, a sensitivity of 95%, and a specificity of 54%,17 whereas Nakazato et al. using a different software obtained a sensitivity of 93% and specificity of 77%.18 Studying 13N-ammonia PET MPI relative quantitation, Laubenbacher et al. reported an accuracy of 82%, a sensitivity of 86%, and a specificity of 80%, in global CAD ≥75%.16 Our automated relative quantitation results in the presence of global CAD ≥70% with 18F-flurpiridaz compare favorably, achieving an accuracy of 72%, sensitivity of 64%, and specificity of 76%. However, overall sensitivity in the phase III clinical trial of flurpiridaz was likely degraded by not recruiting high-risk CAD patients because of safety concerns in subjecting these patients to two stress tests and delaying invasive coronary angiography and possible coronary revascularization.
Studies with visual reads of 99mTc-sestamibi,25,26 13N-ammonia,27 and 82Rb-chloride28 demonstrated interobserver agreements ranging from moderate-substantial. Visual analysis is more prone to variability than automated quantitative analysis29 which enhances interpretation reproducibility.30 Given 18F-flurpiridaz is a novel PET MPI radiopharmaceutical, there is an expected learning curve for the interpreting physician of its specific characteristics. Future research should further address the intra- and inter-observer variability of flurpiridaz PET MPI interpretation, as well as test repeatability defined as the variability between measurements of serial studies, to address the suitability of this novel radiopharmaceutical for serial scanning and monitoring of CAD.
LIMITATIONS
Although the phase III clinical trial was a prospective study, we applied the automated relative perfusion quantitation method in a retrospective manner. Additionally, due to regulatory requirements, % stenosis by invasive coronary angiography was the “gold standard” comparator. Thus, other invasive findings such as fractional flow reserve (FFR) or instant wave-free ratio (iFR) were not measured as part of the trial. The known poor relationship of % stenosis with the functional significance of CAD as measured by FFR or myocardial flow reserve thus negatively impacted both sensitivity and specificity.
CONCLUSION
The present comprehensive automated method of relative perfusion analysis provides a quantitative, accurate, objective, and highly reproducible, assessment of 18F-flurpiridaz PET MPI in normal and CAD subjects undergoing either pharmacological or exercise stress. These findings create the foundation for using an automated approach as a second on-site study interpretation with objective assessment.
NEW KNOWLEDGE GAINED
The present study determined the diagnostic value of a newly developed automated relative quantitation system of 18F-flurpiridaz PET MPI in comparison to visual assessment. Whereas both techniques yield similar diagnostic accuracies, the software approach is significantly less prone to variability than visual reads. Our automated relative quantitation system of 18F-flurpiridaz PET MPI constitutes an objective, second interpretation available to the diagnosing physician who may decide to take these results into consideration and integrate them in the final report.
Supplementary Material
DISCLOSURES
Supported by NIH 1R43HL123069-01, 2R44HL123069-02, and VA Merit BX004558. Ernest Garcia and David Cooke receive royalties from the sales of the Emory Cardiac Toolbox related to the research described in this article. Kelly Champagne, Kenneth Van Train, and David Cooke are employees of Syntermed which commercially distributes the Emory Cardiac Toolbox. John Votaw is a consultant for the Emory Cardiac Toolbox. Joel Lazewatsky is a current and Cesare Orlandi a former employee of Lantheus Medical Imaging. Ernest Garcia and Jamshid Maddahi are scientific advisors to Lantheus Medical Imaging and GE Healthcare.
ABBREVIATIONS
- CAD
coronary artery disease
- LAD
left anterior descending
- LCx
left circumflex
- LV
left ventricle
- LVEF
left ventricular ejection fraction
- MPI
myocardial perfusion imaging
- PET
positron emission tomography
- SPECT
single photon emission computed tomography
- Pharm
pharmacological
- RCA
right coronary artery
- ROC
receiver operating characteristic
- SD
standard deviation
REFERENCES
- 1.Maddahi J, Packard RR. Cardiac PET perfusion tracers: current status and future directions. Semin Nucl Med 2014;44:333–43. [DOI] [PMC free article] [PubMed] [Google Scholar]
- 2.Dorbala S, Di Carli MF. Cardiac PET perfusion: prognosis, risk stratification, and clinical management. Semin Nucl Med 2014;44:344–57. [DOI] [PMC free article] [PubMed] [Google Scholar]
- 3.Parker MW, Iskandar A, Limone B, Perugini A, Kim H, Jones C, et al. Diagnostic accuracy of cardiac positron emission tomography versus single photon emission computed tomography for coronary artery disease: a bivariate meta-analysis. Circ Cardiovasc Imaging 2012;5:700–7. [DOI] [PubMed] [Google Scholar]
- 4.Mc Ardle BA, Dowsley TF, deKemp RA, Wells GA, Beanlands RS. Does Rubidium-82 PET Have Superior Accuracy to SPECT Perfusion Imaging for the Diagnosis of Obstructive Coronary Disease? A Systematic Review and Meta-Analysis. J Am Coll Cardiol 2012;60:1828–1837. [DOI] [PubMed] [Google Scholar]
- 5.Bateman TM, Heller GV, McGhie AI, Friedman JD, Case JA, Bryngelson JR, et al. Diagnostic accuracy of rest/stress ECG-gated Rb-82 myocardial perfusion PET: comparison with ECG-gated Tc-99m sestamibi SPECT. J Nucl Cardiol 2006;13:24–33. [DOI] [PubMed] [Google Scholar]
- 6.Kay J, Dorbala S, Goyal A, Fazel R, Di Carli MF, Einstein AJ, et al. Influence of sex on risk stratification with stress myocardial perfusion Rb-82 positron emission tomography: Results from the PET (Positron Emission Tomography) Prognosis Multicenter Registry. J Am Coll Cardiol 2013;62:1866–76. [DOI] [PubMed] [Google Scholar]
- 7.Chow BJ, Dorbala S, Di Carli MF, Merhige ME, Williams BA, Veledar E, et al. Prognostic value of PET myocardial perfusion imaging in obese patients. JACC Cardiovasc Imaging 2014;7:278–87. [DOI] [PubMed] [Google Scholar]
- 8.Einstein AJ, Berman DS, Min JK, Hendel RC, Gerber TC, Carr JJ, et al. Patient-centered imaging: shared decision making for cardiac imaging procedures with exposure to ionizing radiation. J Am Coll Cardiol 2014;63:1480–9. [DOI] [PMC free article] [PubMed] [Google Scholar]
- 9.Maddahi J, Czernin J, Lazewatsky J, Huang S-C, Dahlbom M, Schelbert H, et al. Phase I, first-in-human study of BMS747158, a novel 18F-labeled tracer for myocardial perfusion PET: dosimetry, biodistribution, safety, and imaging characteristics after a single injection at rest. J Nucl Med 2011;52:1490–8. [DOI] [PubMed] [Google Scholar]
- 10.Berman DS, Maddahi J, Tamarappoo BK, Czernin J, Taillefer R, Udelson JE, et al. Phase II safety and clinical comparison with single-photon emission computed tomography myocardial perfusion imaging for detection of coronary artery disease: flurpiridaz F 18 positron emission tomography. J Am Coll Cardiol 2013;61:469–77. [DOI] [PMC free article] [PubMed] [Google Scholar]
- 11.Maddahi J, Lazewatsky JL, Udelson JE, Berman DS, Beanlands R, Heller GV, et al. Phase-III clinical trial of fluorine-18 flurpiridaz positron emission tomography for evaluation of coronary artery disease. J Am Coll Cardiol 2020;76:391–401. [DOI] [PubMed] [Google Scholar]
- 12.Phelps ME, Hoffman EJ, Coleman RE, Welch MJ, Raichle ME, Weiss ES, et al. Tomographic images of blood pool and perfusion in brain and heart. J Nucl Med 1976;17:603–12. [PubMed] [Google Scholar]
- 13.Garcia EV, Klein JL, Taylor AT. Clinical decision support systems in myocardial perfusion imaging. J Nucl Cardiol 2014;21:427–39; quiz 440. [DOI] [PubMed] [Google Scholar]
- 14.Garcia EV, Faber TL, Cooke CD, Folks RD, Chen J, Santana C. The increasing role of quantification in clinical nuclear cardiology: the Emory approach. J Nucl Cardiol 2007;14:420–32. [DOI] [PubMed] [Google Scholar]
- 15.Hicks K, Ganti G, Mullani N, Gould KL. Automated quantitation of three-dimensional cardiac positron emission tomography for routine clinical use. J Nucl Med 1989;30:1787–97. [PubMed] [Google Scholar]
- 16.Laubenbacher C, Rothley J, Sitomer J, Beanlands R, Sawada S, Sutor R, et al. An automated analysis program for the evaluation of cardiac PET studies: initial results in the detection and localization of coronary artery disease using nitrogen-13-ammonia. J Nucl Med 1993;34:968–78. [PubMed] [Google Scholar]
- 17.Santana CA, Folks RD, Garcia EV, Verdes L, Sanyal R, Hainer J, et al. Quantitative (82)Rb PET/CT: development and validation of myocardial perfusion database. J Nucl Med 2007;48:1122–8. [DOI] [PubMed] [Google Scholar]
- 18.Nakazato R, Berman DS, Dey D, Le Meunier L, Hayes SW, Fermin JS, et al. Automated quantitative Rb-82 3D PET/CT myocardial perfusion imaging: normal limits and correlation with invasive coronary angiography. J Nucl Cardiol 2012;19:265–76. [DOI] [PMC free article] [PubMed] [Google Scholar]
- 19.Garcia EV, Van Train K, Maddahi J, Prigent F, Friedman J, Areeda J, et al. Quantification of rotational thallium-201 myocardial tomography. J Nucl Med 1985;26:17–26. [PubMed] [Google Scholar]
- 20.Garcia EV, Cooke CD, Van Train KF, Folks R, Peifer J, DePuey EG, et al. Technical aspects of myocardial SPECT imaging with technetium-99m sestamibi. Am J Cardiol 1990;66:23E–31E. [DOI] [PubMed] [Google Scholar]
- 21.Van Train KF, Areeda J, Garcia EV, Cooke CD, Maddahi J, Kiat H, et al. Quantitative same-day rest-stress technetium-99m-sestamibi SPECT: definition and validation of stress normal limits and criteria for abnormality. J Nucl Med 1993;34:1494–502. [PubMed] [Google Scholar]
- 22.Packard RR, Huang SC, Dahlbom M, Czernin J, Maddahi J. Absolute quantitation of myocardial blood flow in human subjects with or without myocardial ischemia using dynamic flurpiridaz F18 PET. J Nucl Med 2014;55:1438–44. [DOI] [PMC free article] [PubMed] [Google Scholar]
- 23.Maddahi J, Bengel F, Czernin J, Crane P, Dahlbom M, Schelbert H, et al. Dosimetry, biodistribution, and safety of flurpiridaz F18 in healthy subjects undergoing rest and exercise or pharmacological stress PET myocardial perfusion imaging. J Nucl Cardiol 2019;26:2018–2030. [DOI] [PubMed] [Google Scholar]
- 24.Moody JB, Poitrasson-Rivière A, Hagio T, Buckley C, Weinberg RL, Corbett JR, et al. Added value of myocardial blood flow using 18F-flurpiridaz PET to diagnose coronary artery disease. J Nucl Cardiol Epub Jan 30 2020. [DOI] [PubMed] [Google Scholar]
- 25.Golub RJ, Ahlberg AW, McClellan JR, Herman SD, Travin MI, Mather JF, et al. Interpretive reproducibility of stress Tc-99m sestamibi tomographic myocardial perfusion imaging. J Nucl Cardiol 1999;6:257–69. [DOI] [PubMed] [Google Scholar]
- 26.Danias PG, Ahlberg AW, Travin MI, Mahr NC, Abreu JE, Marini D, et al. Visual assessment of left ventricular perfusion and function with electrocardiography-gated SPECT has high intraobserver and interobserver reproducibility among experienced nuclear cardiologists and cardiology trainees. J Nucl Cardiol 2002;9:263–70. [DOI] [PubMed] [Google Scholar]
- 27.Flotats A, Bravo PE, Fukushima K, Chaudhry MA, Merrill J, Bengel FM. (82)Rb PET myocardial perfusion imaging is superior to (99m)Tc-labelled agent SPECT in patients with known or suspected coronary artery disease. Eur J Nucl Med Mol Imaging 2012;39:1233–9. [DOI] [PubMed] [Google Scholar]
- 28.Chow BJ, Beanlands RS, Lee A, DaSilva JN, deKemp RA, Alkahtani A, et al. Treadmill exercise produces larger perfusion defects than dipyridamole stress N-13 ammonia positron emission tomography. J Am Coll Cardiol 2006;47:411–6. [DOI] [PubMed] [Google Scholar]
- 29.Iskandrian AE, Hage FG, Shaw LJ, Mahmarian JJ, Berman DS. Serial myocardial perfusion imaging: defining a significant change and targeting management decisions. JACC Cardiovasc Imaging 2014;7:79–96. [DOI] [PubMed] [Google Scholar]
- 30.Mahmarian JJ, Cerqueira MD, Iskandrian AE, Bateman TM, Thomas GS, Hendel RC, et al. Regadenoson induces comparable left ventricular perfusion defects as adenosine: a quantitative analysis from the ADVANCE MPI 2 trial. JACC Cardiovasc Imaging 2009;2:959–68. [DOI] [PubMed] [Google Scholar]
Associated Data
This section collects any data citations, data availability statements, or supplementary materials included in this article.