

Abstract
Purpose
The present study hypothesised that whole-body [18F]FDG-PET/CT might provide insight into the pathophysiology of long COVID.
Methods
We prospectively enrolled 13 adult long COVID patients who complained for at least one persistent symptom for >30 days after infection recovery. A group of 26 melanoma patients with negative PET/CT matched for sex/age was used as controls (2:1 control to case ratio). Qualitative and semi-quantitative analysis of whole-body images was performed. Fisher exact and Mann-Whitney tests were applied to test differences between the two groups. Voxel-based analysis was performed to compare brain metabolism in cases and controls. Cases were further grouped according to prevalent symptoms and analysed accordingly.
Results
In 4/13 long COVID patients, CT images showed lung abnormalities presenting mild [18F]FDG uptake. Many healthy organs/parenchyma SUVs and SUV ratios significantly differed between the two groups (p ≤ 0.05). Long COVID patients exhibited brain hypometabolism in the right parahippocampal gyrus and thalamus (uncorrected p < 0.001 at voxel level). Specific area(s) of hypometabolism characterised patients with persistent anosmia/ageusia, fatigue, and vascular uptake (uncorrected p < 0.005 at voxel level).
Conclusion
[18F]FDG PET/CT acknowledged the multi-organ nature of long COVID, supporting the hypothesis of underlying systemic inflammation. Whole-body images showed increased [18F]FDG uptake in several “target” and “non-target” tissues. We found a typical pattern of brain hypometabolism associated with persistent complaints at the PET time, suggesting a different temporal sequence for brain and whole-body inflammatory changes. This evidence underlined the potential value of whole-body [18F]FDG PET in disclosing the pathophysiology of long COVID.
Supplementary Information
The online version contains supplementary material available at 10.1007/s00259-021-05294-3.
Keywords: SARS-CoV-2, [18F]FDG PET/CT, Infection, Inflammation, Long COVID, Brain hypometabolism, Chronic COVID syndrome
Introduction
[18F]FDG positron emission tomography ([18F]FDG-PET), originally developed to evaluate brain metabolism, has achieved its fame for tumour imaging. Nonetheless, it is currently authorised and widely used for many clinical conditions, including infection and inflammation with excellent results [1]. Despite some initial promising data on [18F]FDG-PET/CT in SARS-CoV-2 infection [2], the main benefit of this technique seems mostly related to the incidental diagnosis of pneumonia rather than to an impact on patients’ management [3]. Early after the first wave, an increasing number of patients suffering from persistent symptoms and/or long-term sequelae after SARS-CoV-2 infection recovery (designed as long COVID or chronic COVID syndrome) have been reported [4–7]. Brain hypermetabolism and hypometabolism have been recorded during or early after SARS-CoV-2 infection [8–10]. Moreover, brain hypometabolism has been recently described in limbic and paralimbic regions, brainstem, and cerebellum in patients with persistent functional complaints [11]. Pathophysiology of long COVID is still uncertain. In some patients, viral RNA persists longer, being detectable in the stools even when oropharyngeal swabs are negative [12]. A multisystem inflammatory syndrome associated with COVID-19 infection has been reported [13, 14], suggesting that the virus could trigger an uncontrolled immune response. Finally, injuries in the lung and other organs including the brain, heart, and kidney have been described post-mortem [15]. This evidence raises questions on the mechanism underlying the pathophysiology of persistent symptoms. Experimental studies demonstrated that glucose transporter expression might be high in cells involved in infection and inflammation [16]. The capability of [18F]FDG of identifying inflammation and infection foci seems to be related to the glycolytic activity of the cells involved in the inflammatory response [16]. Differently to that observed in tumours, the affinity of glucose transporters for deoxyglucose during inflammation seems to be increased by cytokines and growth factors [17]. Moreover, the cellular stress produced from cell injury (metabolic flare) may increase glucose consumption and, thus, [18F]FDG uptake [16]. Therefore, [18F]FDG – highly sensitive – is ideally suitable to investigate long COVID. Finally, PET/CT benefits from hybrid whole-body assessment, safety, and patients’ compliance. The present study hypothesised that whole-body [18F]FDG-PET/CT might provide insight into the pathophysiology of long COVID.
Methods
Study design and population
In this observational case-control study, we prospectively screened all adult long COVID patients followed up in our outpatient clinic, presenting at least one persistent symptom for more than 30 days after infection recovery. Overall, 13 – among the 15 patients invited to participate – were enrolled after signing the informed consent (Supplementary Table 1 s). [18F]FDG-PET/CT was performed in all enrolled patients 98 ± 33 days after infection recovery (132 ± 31 days after diagnosis).
The Ethics Committee of the Humanitas Clinical and Research Centre approved the study. A group of control was selected from the Institutional database as follows: surgically treated melanoma patients (stage I = 11, stage II = 9, and stage III = 6) matched for age and sex, oncological negative whole-body images (from the top of the head to feet) acquired – with the same scanner – before September 2019, no oncological treatment except surgery, and no history of neurological disorders. The limit date (i.e. August 31, 2019) to select controls – settled based on the latest epidemiologic data on the pandemic − aimed to avoid any potential bias. Table 1 summarises the baseline characteristics of patients.
Table 1.
Baseline patients’ characteristics
| Long COVID (n = 13) | Melanoma (n = 26) | |
|---|---|---|
| Male sex (n) | 8 | 16 |
| Age (yr) | 54 (46–80) | 54 (46–80) |
| BMI status (n) | ||
| Underweight | 1 | 3 |
| Normal | 4 | 11 |
| Overweight | 5 | 9 |
| Obesity | 3 | 3 |
| Co-morbidities (n) | ||
| No | 3 | 3 |
| Diabetes | 3 | 2 |
| Blood hypertension | 3 | 7 |
| Autoimmune disease | 1 | 1 |
| Multinodular goitre | 0 | 1 |
| Others | 4 | 5 |
| Concomitant medications | ||
| None | 4 | 14 |
| Beta-blockers | 4 | 1 |
| Calcium antagonists | 1 | 0 |
| Sartans | 1 | 1 |
| ACE inhibitors | 1 | 1 |
| Thiazide diuretics | 1 | 1 |
| Oral anticoagulants | 5 | 0 |
| Antiplatelet drugs | 0 | 5 |
| Oral hypoglycaemic drugs | 3 | 1 |
| Steroids | 1 | 0 |
| Statins | 1 | 0 |
| Serotonin reuptake inhibitors | 2 | 0 |
| Anticonvulsant drugs | 2 | 0 |
| Benzodiazepines | 1 | 0 |
| Proton pump inhibitors | 2 | 1 |
| Xanthine oxidase inhibitors | 1 | 0 |
| Folate-analog metabolic inhibitors | 0 | 1 |
| Alpha-blockers | 1 | 0 |
| Vitamin D | 1 | 0 |
| Antiretroviral drugs | 1 | 0 |
| Adrenergic bronchodilators | 1 | 0 |
| Levothyroxine | 1 | 1 |
| Aminophylline | 0 | 1 |
| Magnesium | 1 | 0 |
| Unknown | 0 | 5 |
*Included cardiovascular and metabolic/endocrine diseases
[18F]FDG PET/CT
PET/CT was performed according to the EANM/SNMMI guidelines for [18F]FDG in inflammation and infection [16]. Briefly, whole-body images (from the top of the head to the feet) were acquired using the integrated GE Discovery PET/CT 690 scanner (General Electric Healthcare, Waukesha, WI, USA) about 60 min after the [18F]FDG intravenous administration in fasting patients. [18F]FDG-PET/CT in controls was acquired according to good clinical practice [18] as whole-body images using the same scanner.
Whole-body image analysis
Whole-body images were qualitatively and semi-quantitatively analysed using a Xeleris™ workstation (General Electric Healthcare, Waukesha, WI, USA) by an experienced nuclear medicine physician (MS). The same protocol for visual assessment and semi-quantitative analysis was applied in both cases and controls. Firstly, we visually assessed image quality (e.g. artefacts, [18F]FDG biodistribution) as recommended by the EANM/SNMMI guidelines for [18F]FDG in inflammation and infection [16]. After that, PET/CT was defined as negative or positive according to the current guidelines [16] as previously detailed [19]. Positive findings were described according to organs/parenchyma and visually graded using a 3-point scale (mild, moderate, and high), which referred to the physiological liver uptake (lower, equal, or higher, respectively). Specific criteria were used to assess vascular and bone marrow increased uptake (i.e. positivity). The linear pattern of [18F]FDG uptake scored as moderate in at least one vascular region other than femoral arteries and was considered suggestive for vascular uptake. Bone marrow uptake was considered present if evident in long bones (humerus and femora) at MIP. Maximum, minimum, and mean standardised uptake values (SUVmax, SUVmin, SUVmean) were recorded for positive findings and healthy organs and parenchyma. [18F]FDG uptake (i.e. SUVmax) in healthy organs and parenchyma was corrected using liver SUVmax, and caval vein SUVmean as background and the corresponding ratios were calculated. Semi-quantitative parameters of healthy lung parenchyma (SUVmax, SUVmin) were recorded at a different level (upper, middle, lower parenchyma), to assess the metabolic pattern according to the anatomy. Semi-quantitative assessment of vascular [18F]FDG uptake (total vascular score and target-to-background ratio) was performed according to the current guidelines [20] as previously detailed [19]. The CT component of PET/CT images was examined and abnormalities recorded, regardless of [18F]FDG uptake.
Brain image analysis
Brain images were extracted from the whole-body [18F]FDG-PET/CT as previously described [21, 22] and converted to analyse format for pre-processing in SPM software (Wellcome Department of Cognitive Neurology, London, UK) [23].
Brain [18F]FDG-PET images were processed to affine and nonlinear spatial normalisation into Talairach and Tournoux space using SPM8. All the default choices of SPM were followed except for spatial normalisation. The H215O SPM-default template was replaced by an optimised brain [18F]FDG-PET as described by Della Rosa et al. [24]. The spatially normalised set of images were checked for each patient to exclude the presence of artefacts or non-perfect fits introduced by SPM processing and were then smoothed with an 8-mm isotropic Gaussian filter to blur individual variations in gyral anatomy and to increase the signal-to-noise ratio.
Data collection
At the time of [18F]FDG PET/CT, long COVID was re-assessed and confirmed in all cases. All patients complained of a certain degree of limitations in daily living activities than baseline (i.e. before COVID-19 infection). The following information was collected before [18F]FDG administration: demographics (age, sex, weight, and height), SARS-CoV-2 infection diagnosis and recovering dates, onset and persistent symptoms, available laboratory tests and diagnostic examinations, co-morbidities, and concomitant medications.
Demographics (age, sex, weight, and height), oncological medical history, co-morbidities, and concomitant medications were collected for controls.
Scan data (date of scan, blood glucose level before [18F]FDG injection, [18F]FDG administered activity, and interval time between injection and acquisition) was collected for cases and controls.
Statistical analysis
The sample size, based on the sensitivity [25], estimated to 12 the number of patients to be recruited to have a 95% confidence interval and 95% power. The population was increased to 13 patients considering a 5% screening failure. To increase the consistency of the analysis, we selected two controls for each case using the criteria mentioned above. Frequency tables were used to summarise baseline patients’ characteristics (i.e. at study entry). [18F]FDG-PET/CT positivity was used as the primary endpoint.
Before any analysis to compare cases and controls, we verified the comparability of technical PET/CT parameters (glycaemia pre-PET, injected [18F]FDG activity, interval time between [18F]FDG injection and scan). A contingency table was built sorting groups (cases and controls) according to the outcome of interest. Quantitative variables normally distributed were summarised as mean ± standard deviation. Non-normal distributed variables were reported as median and range. Fisher exact test and Mann-Whitney test were applied to test the differences between the two groups (cases versus controls). The Kruskal-Wallis test was used when comparing more than two groups. Spearman’s rank correlation coefficient explored the association between the outcome of interest and patients’ baseline characteristics. A p value ≤0.05 was considered statistically significant. Stata 16.1 was used for whole-body statistical analyses.
Patients’ brain metabolism was compared to controls using two-sample t-test in SPM to assess the presence of regions of hypo- or hypermetabolism. A height threshold p < 0.001 (uncorrected) was considered significant. Only significant cluster with a minimum size of 100 voxels was considered. Long COVID patients were further subgrouped according to prevalent clinical symptoms at disease onset or persistent at the time of PET as well as based on visual whole-body PET analysis. For both clinical symptoms and PET-based categories, only categories including at least one-third of cases were used of subgroup analyses. The presence of each symptom at disease onset and at the time of PET/CT was independently considered. Given the exploratory nature of subgroups’ analyses, a less conservative height uncorrected threshold p < 0.005 was accepted at voxel level. In the case of multiple comparisons, the family-wise error correction was applied, and a p value <0.05 was accepted, to balance type I and type II errors [26].
Results
We did not found any difference between the long COVID and melanoma groups in terms of pre-PET glycaemia (100 ± 29 versus 98 ± 16 mg/dl), administered [18F]FDG activity (366 ± 25 versus 354 ± 18 MBq), and interval time between [18F]FDG injection and images (66 ± 10 versus 63 ± 6 min).
Whole-body images
We observed normal [18F]FDG biodistribution in all patients. Whole-body images resulted negative (i.e. no areas of increased uptake outside the expected area of tracer accumulation) in 1/13 long COVID patients and 3/26 controls, respectively. Vascular binary pattern and diffuse bone marrow [18F]FDG uptake in long bones leapt out in long COVID patients (Fig. 1), but their prevalence did not differ compared to melanoma patients. Table 2 shows the results of visual analysis tabulated according to the anatomical site. Specifically, in long COVID patients, PET/CT showed mild to moderate [18F]FDG uptake in vessels (61%) and bone marrow (46%). Large joint [18F]FDG uptake was observed in 11/13 cases. In four out of 13 long COVID patients, CT images demonstrated bilateral lung abnormalities – as typically observed in recovered COVID-19 pneumonia – presenting mild [18F]FDG uptake (SUVmax = 1.52, range 0.85–1.79, Fig. 1). Patients with persistent bilateral lung abnormalities were the four who received oxygen (96 ± 30 days from infection recovery to PET/CT). Intense [18F]FDG uptake was found in both thyroidal lobes (right > left) of one patient. Moderate [18F]FDG uptake in salivary glands was observed in one case. Two patients presented moderate/high [18F]FDG uptake in the lung, mediastinal lymph nodes, soft tissue, and breast related to their co-morbidities. Diffuse unspecific [18F]FDG uptake was observed in the gastrointestinal tract and muscles (54% and 10%, respectively). Results of visual analysis in long COVID patients are detailed in Table 3.
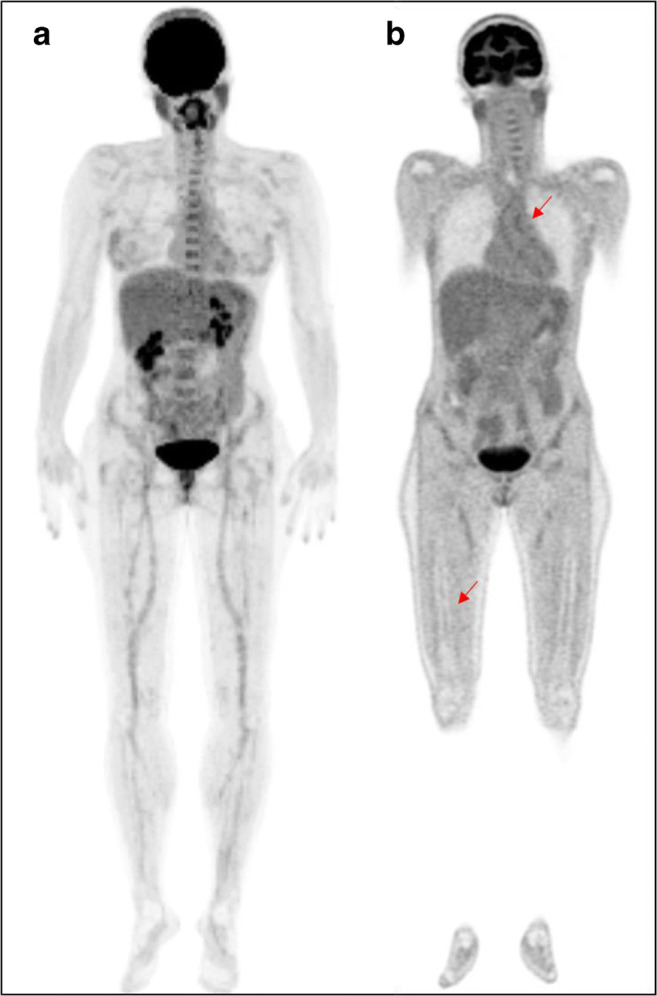
Fig. 1.

[18F]FDG-PET/CT images in two long COVID patients with persistent fatigue. MIP image (a) of patient 6 shows moderate [18F]FDG uptake in joints and vessels as confirmed by coronal PET view (red arrows in b. Axial PET (c) and fused PET/CT (d) images show lung abnormalities characterised by mild [18F]FDG uptake (red arrow). MIP image (e) of patient 7 shows high to moderate [18F]FDG uptake in joints, bone marrow, and salivary glands.
Table 2.
Visual analysis comparison (long COVID versus controls)
| Common site of [18F]FDG uptake | Odds ratio | 95% confidence interval | P value |
|---|---|---|---|
| Bone marrow | 0.43 | 0.11–1.73 | 0.29 |
| Large joints | 0.49 | 0.08–2.80 | 0.68 |
| Vessels | 0.54 | 0.14–2.08 | 0.50 |
Table 3.
Results of visual analysis in long COVID
| ID | Long COVID | [18F]FDG PET/CT uptake | ||||||
|---|---|---|---|---|---|---|---|---|
| Persisting symptoms* | Time between COVID-19 recovery and PET/CT (days) | Drugs for long COVID | Post-pneumonia lung abnormalities | Bone marrow | Vascular, TVS | Joints | Other sites (s) of uptake | |
| 1 | Dyspnoea, fatigue | 61 | No | No | Moderate | No, 7 | Mild | Thyroid |
| 2 | Anosmia, ageusia, fatigue, dyspnoea, chest pain, tachycardia | 54 | No | No | Mild | Yes, 6 | No | No |
| 3 | Headache, dyspnoea | No | No | No | Yes, 9 | Mild | No | |
| 4 | Fatigue | 58 | No | Mild | No | Yes, 8 | Mild | No |
| 5 | Anosmia, ageusia, dyspnoea, trembling hands | 103 | No | No | No | No, 5 | Mild | No |
| 6 | Fatigue | 104 | Paracetamol | No | Moderate | Yes, 7 | Intense | No |
| 7 | Fatigue | 98 | No | Mild | No | Yes, 9 | Moderate | Salivary glands |
| 8 | Dyspnoea | 149 | No | No | No | No, 4 | No | No |
| 9 | Dyspnoea, fatigue, tachycardia, joint pain | 71 | No | No | No | No, 6 | Mild | Right breast, right benign lung nodule, uterus, the soft tissue of the left leg |
| 10 | Dyspnoea, fatigue, joint pain, polyneuropathy | 96 | No | Mild | Mild | No, 2 | Intense | No |
| 11 | Ageusia, anosmia, fatigue | 131 |
Prednisone, enoxaparin |
No | No | Yes, 8 | Intense | Bilateral benign lung nodules, mediastinal lymph nodes |
| 12 | Dyspnoea, anosmia, ageusia | 132 | Rivaroxaban | Mild | Mild | Yes, 11 | Mild | No |
| 13 | Joint pain, dyspnoea | 142 | No | No | Mild | Yes, 7 | Mild | No |
*Symptoms reported at the time of PET/CT scan
TVS total vascular score
In the control group, [18F]FDG uptake was observed in joints, vessels, and bone marrow of 73%, 46%, and 27% of patients (Fig. 2), respectively. Other findings included soft-tissue post-surgical inflammation (8%) and uterine myoma (8%). One patient presented a large liver cyst. Diffuse unspecific [18F]FDG uptake was observed in the gastrointestinal tract and muscles (92% and 15%, respectively). Table 4 summarises PET/CT visual analysis in controls.
Fig. 2.
[18F]FDG-PET/CT images in a female melanoma patient (control group). MIP image (a) shows mild to moderate [18F]FDG uptake in joints, vessels, and bone marrow as confirmed by coronal PET view (red arrows in b).
Table 4.
Results of visual analysis in controls
| [18]FDG uptake location | Melanoma patients | ||
|---|---|---|---|
| Total vascular score 0–7 (n) | Total vascular score 8–14 (n) | Total vascular score 15–21 (n) | |
| Vessels (n = 12) | 6 | 6 | 0 |
| Mild (n) | Moderate (n) | Intense (n) | |
| Bone marrow (n = 7) | 6 | 1 | 0 |
| Joints (n = 19) | 14 | 2 | 3 |
| Other sites of uptake (n = 4) | |||
| Soft-tissue post-surgical inflammation | 0 | 1 | 1 |
| Uterine myoma | 1 | 0 | 1 |
The 7-region total vascular score did not differ in the two groups (7 ± 2 versus 7 ± 2), resulting in a similar number of involved regions.
SUVs and ratios referring to healthy organs/parenchyma were higher in long COVID than controls in 54% of calculated SUVs. In 45% of computed SUVs, healthy organs/parenchyma parameters were higher in controls than in long COVID patients. In the remaining 1% of analysed SUVs, SUVs in healthy organs/parenchyma were identical in the two groups. Among all semi-quantitative PET parameters collected as absolute values, brain SUVmax, bone marrow SUVmax, lung parenchyma SUVmax, adrenal SUVmax, and inferior caval vein SUVmean differed between cases and controls (Supplementary Table 2 s). Liver SUVmax was comparable in the two groups (SUVmax = 2.88, range 2–3.45 in long COVID; SUVmax = 3.05, range 1.79–4.15, in controls). When healthy organ and parenchyma SUVs were normalised using the liver SUVmax as background, the following ratios were significantly diverse in the two groups: bone marrow/liver, brain/liver, colon/liver, adrenal/liver, lung/liver, oesophagus/liver, carotid artery/liver, and stomach/liver (Supplementary Table 2 s). When healthy organ and parenchyma SUVs were normalised using the caval vein SUVmean as background, the following ratios were higher in the long COVID group than in controls: lung/caval vein, thoracic vertebra/caval vein, lumbar vertebra/caval vein, bone marrow/caval vein, heart/caval vein, liver/caval vein, spleen/caval vein, small intestine/caval vein, pancreas/caval vein, kidney/caval vein, prostate/caval vein, muscle/caval vein, bladder/caval vein, skin/caval vein, thyroid/caval vein, parotid/caval vein, and ethmoidal region/caval vein (Supplementary Table 2 s). The 24-vascular region target-to-background ratios – calculated using the caval vein SUVmean as background – were significantly higher in the long COVID group than in melanoma patients (Supplementary Table 2 s).
We did not find any correlation between long COVID patients’ baseline characteristics, duration or type of symptoms, laboratory tests, and PET/CT findings except in patients who required oxygen during the acute phase of infection. The increased lung [18]FDG uptake in healthy parenchyma was not evident in qualitative analysis, and we did not find any difference in patients with or without residual CT abnormalities (p = 0.414). According to anatomy, semi-quantitative parameters showed a trend from upper to lower lung regions without any significant difference (Fig. 3).
Fig. 3.

Box-and-whisker plot of the right and left lung semi-quantitative parameters expressed as absolute SUVmax parameter (a), lung SUVmax/liver SUVmax (b), and lung SUVmax/caval vein SUVmean (c) ratios in the group of long COVID
Brain images
Long COVID patients did not exhibit brain regions of relative hypermetabolism when compared to controls.
Conversely, long COVID patients presented a relative hypometabolism in the right parahippocampal gyrus (Brodmann areas 30 and 36) and right thalamus compared to melanoma patients (uncorrected p < 0.001).
A significant hypometabolism characterised patients with persistent anosmia/ageusia in the parahippocampal gyri (Brodmann areas 27 and 36) and orbitofrontal cortex (gyrus rectus, BA 11) on both hemispheres (uncorrected p < 0.005). The same regions of hypometabolism (although restricted to the right hemisphere) were also highlighted in the subgroup of patients showing mild-to-moderate vascular [18F]FDG uptake (p < 0.005). Patients with persistent fatigue exhibited a relative hypometabolism in the right parahippocampal gyrus (Brodmann area 30), the brainstem (substantia nigra), and the thalamus of both hemispheres (uncorrected p < 0.005).
No significant differences were observed to controls when patients were grouped based on symptoms present at disease onset or based on [18]FDG uptake in the lung, vascular area, bone marrow, and joints.
Clusters of significant hypometabolism in the whole group of long COVID patients and subgroups analyses are reported in Fig. 3. Details on coordinates and z-score are reported in Supplementary Table 3 s (Fig. 4).
Fig. 4.

Brain [18F]FDG PET analysis. Regions of hypometabolism compared to controls in the 13 long COVID patients (a) and subgroups of patients showing persistence of anosmia (b), fatigue (c), or mild-to-moderate vessel [18F]FDG uptake (d). Regions of significant difference are colour-graded in terms of Z values. Talairach coordinates and further details are available in Table 3 of the supplementary materials
Discussion
Our findings confirmed long COVID as a multi-organ disease. Although we did not find a typical visual PET/CT pattern suggestive for long COVID, semi-quantitative and voxel-based brain analysis supported the recent hypothesis on SAR-CoV-2 infection and provided new insights on the pathophysiology of long COVID. Many healthy organs and parenchyma showed a higher [18F]FDG in long COVID patients than in controls. These findings suggested a diffuse inflammation involving “target” and “non-target” organs and parenchyma. Notably, whereas the liver SUVmax was similar in the two groups, the caval vein SUVmean was lower in long COVID patients than in controls, possibly overestimating groups’ differences. However, a reduced caval vein SUVmean (i.e. blood pool) could result from a lower [18F]FDG availability (the higher the inflammation, the higher the [18F]FDG tissues uptake and the lower the circulating [18F]FDG). The lack of renal function data and lean body mass prevented the chance to explore other causes for differences in caval vein SUVmean and verify our speculation.
On the other hand, the liver has listed among the COVID-19 target organs [15, 27]. Therefore, it might be injured – thus making [18F]FDG uptake unreliable – finally underestimating target-to-background significance.
Of note, while relative hypermetabolism, due to a multisystem inflammatory syndrome, was evident in some organs, when we analysed brain metabolism, we conversely demonstrated regions of hypometabolism only (namely in the limbic system, orbitofrontal cortex, and brainstem). These findings are topographically and pathophysiologically sound. Limbic and orbitofrontal hypometabolism was previously reported in patients presenting with anosmia during COVID-19 infection [28]. More recently, hypometabolism in bilateral rectal/orbital gyrus, amygdala, hippocampus, brainstem, and bilateral cerebellum has been reported in long COVID [11]. Our findings confirmed the topography of functional brain impairment in long COVID, demonstrating the association with persistent symptoms at the PET time, as in autoimmune encephalitis [29]. Some of the hypermetabolic brain areas described during the COVID-19 infection exhibited hypometabolism in long COVID [9–11]. This mismatch suggested a neuronal/synaptic dysfunction, which occurred after inflammatory changes triggered by SARS-CoV-2 infection, possibly representing a substrate for long-term sequelae. Moreover, the association of regions of hypometabolism in patients with persistent increased vascular uptake supported the hypothesis of a different temporal sequence for brain and whole-body inflammatory changes in the course of the disease [30]. This evidence further underlined the potential value of whole-body [18F]FDG PET in disclosing the pathophysiology of long COVID.
We found a higher [18F]FDG background in lungs, suggesting a diffuse parenchymal inflammation, as reported early after COVID-19 recovery [31]. Interestingly, this finding was not related to COVID-19 pneumonia outcome, comparable in patients with or without persistent CT lung abnormalities. However, a mismatch between molecular and morphological findings has been frequently described in infection and inflammation, including MERS-CoV animal models [32]. In long COVID, the diffuse lung parenchymal inflammation could be related to COVID-19-induced coagulopathy [33, 34] or the alveolar volume loss damage.
Long COVID patients exhibited a diffuse homogenous bone marrow [18F]FDG uptake, as typically observed in some conditions such as after chemotherapy, during prolonged anaemia, or bacteremia [35–37]. Notably, none of our patients suffered from prolonged anaemia. Bone marrow myeloid hyperplasia has been described post-mortem in COVID-19 patients [15]. Moreover, a high bone marrow [18F]FDG uptake over a long time has been reported in MERS-CoV animal model [32]. Additionally, preclinical data showed that [18F]FDG uptake in lymphoid tissue predicted outcome in some viral infections [32, 38]. Although we did not observe any correlation between bone marrow uptake and baseline patients’ characteristics, our patients – even if COVID-19 survivors – should be considered having an unfavourable outcome, experiencing long-lasting (more than 3 months) symptoms after infection recovery. An even worse prognosis in case of bone marrow uptake cannot be a priori ruled out.
Vascular uptake was comparable in the two groups. However, as mentioned above, the liver (i.e. the reference organ to visually score the degree of vascular uptake) could be – as suggested by recent evidence [31] – still inflamed in long COVID, potentially affecting final results. On the other hand, the semi-quantitative analysis showed a statistically significant difference between cases and controls when blood pool (i.e. caval vein SUVmean) was used as background. Vasculitis and vasculopathy have been recently invoked in COVID-19 pathophysiology [33, 34]. An increasing number of cases of COVID-19-related multisystem inflammatory syndrome have been reported in childhood (PIMS-TS) [13] and adults (MIS-A) [14, 39]. PIMS-TS generally occurs in recovered children and adolescents, suggesting a trigger by the virus’s immune response, as reported for other coronaviruses and Kawasaki disease [13].
SARS-CoV-2 infection activating the immune response could determine a multisystem inflammatory syndrome, ultimately presenting as long COVID.
Left adrenal uptake was lower in cases than in controls. This datum could be interesting since adrenal insufficiency may occur after an infection (e.g. tuberculosis), and several complications and disorders – including hypocortisolism – have been diagnosed in SARS survivors [40]. Nonetheless, the unavailability of lab tests or typical signs prevented any further speculation.
In the control group, a mild increased [18F]FDG uptake was observed in joints, vessels, and bone marrow of a high percentage of patients, suggesting its association with ageing-related inflammation [41]. Persisting symptoms in our population included dyspnoea (69%), fatigue (62%), ageusia/anosmia (31%), joint pain (23%), tachycardia (15%), and others (31%). Conversely, fatigue seems the most frequent, according to the literature [4, 42]. These findings just proved that long COVID is characterised by a wide spectrum of symptoms typically observed in – systemic – infectious diseases.
A recent prospective report described a risk profile of developing long COVID, which included middle-aged obese females who experienced more than five symptoms during the first week of infection [42]. Our population did not fit this description, since it consisted of a majority of man (61% versus 39%) with less than six symptoms during the first week of infection (85% versus 15%). Nonetheless, age (59 ± 13 years) and BMI (>27.5) corresponded to those accounted for outcome predictors.
Limitations
Although SUVmax is commonly used in daily practice, its reliability as an absolute value is hampered by some shortcomings. The target-to-background ratio is an easy method to normalise SUVmax and cope with its inherent defects. Nonetheless, also the target-to-background ratio might fail, being influenced by some factors. On the other hand, quantification allows comparison and increases intra- and inter-observer consistency.
Albeit 13 patients are not many, this study was prospectively designed, and an “ad hoc” sample size calculation was performed. However, long COVID patients varied the severity of infection, treatments, persistent symptoms, and duration. Furthermore, missing data hampered the correlation between hyperinflammation, prognostic factors, and PET/CT findings. However, patients were infected during the first pandemic wave (February–April 2020), when data about the pathophysiology of SARS-CoV-2 infection were limited, and patients’ management was inconsistent being mainly related to the logistic of caregivers. All patients complained of a large spectrum of symptoms, variable in terms of association and severity, limiting daily living activities compared to baseline. Nonetheless, our patients were prospectively enrolled and representative for “real-world” data. Moreover, to obtain robust results, we designed a case-control study selecting two controls – matched for age and sex – for each case. To limit confounding factor controls, we chose as negative oncologic patients followed in our Institution, without a known history of neurological disorders, acquired on the same scanner and with the same modality/protocol. Patients’ recovery from other viral infection would have been of greater value as the control group.
Conclusions
Our results will impact on the management of long COVID. [18F]FDG PET/CT acknowledged the multi-organ nature of long COVID, supporting the hypothesis of underlying systemic inflammation. Whole-body images showed increased [18F]FDG uptake in several “target” and “non-target” tissues, with a typical pattern of brain hypometabolism. Brain hypometabolism was associated with persistent complaints at the PET time rather than with symptoms prevalent during active infection. This finding confirmed [18F]FDG PET/CT’s capability to capture and closely correlate with ongoing clinical symptoms, suggesting a different temporal sequence for brain and whole-body inflammatory changes.
Supplementary information
(DOCX 31 kb)
Acknowledgements
We thank physicians who cured and managed patients. We are thankful to Mr. Lorenzo Leonardi for his assistance in enrolling patients in this study. M. Sollini is supported by the Investigator Grant 2019-23959 funded by AIRC (Italian Association for Cancer Research) won by A. Chiti.
Code availability
Not applicable.
Author contribution
AC and MS conceptualised the study; AC, AA, MC, MC, and MS designed the study; PM, MC, MS, and AA screened patients; FG, SC, and AC enrolled patients; PM, MC, SC, and FG collected the clinical data; MS, SC, AC, and FG performed image and data analysis; AC, SDM, MS, PM, MC, AA, and MC critically interpreted results; SC, SDM, MS, and AC drafted the paper. All the authors critically revised the paper and approved the submitted version of the manuscript.
Data availability
The manuscript represents valid work, and neither this manuscript nor one with substantially similar content under the same authorship has been published or is being considered for publication elsewhere. Arturo Chiti had full access to all the data in the study and takes responsibility for the data integrity and the accuracy of the data analysis. Raw data are available on specific request to the corresponding author.
Declarations
Ethics approval
The Ethics Committee of the Humanitas Clinical and Research Centre approved the study on June 12, 2020, with the authorisation number 2587.
Consent to participate and consent for publication
Written informed consent was obtained from patients for participation in the clinical study and data publication.
Conflict of interest
Dr. Sollini, Morbelli, Ciccarelli, Morelli, Aghemo and Gelardi have nothing to disclose; Dr. Cecconi reports personal fees from Edwards Lifesciences, personal fees from Directed Systems, and personal fees from Cheetah Medical, outside the submitted work; Dr. Chiti reports other from Sanofi, personal fees from AAA, personal fees from Blue Earth Diagnostics, and personal fees from General Electric Healthcare, outside the submitted work.
Footnotes
This article is part of the Topical Collection on Infection and inflammation.
Publisher’s Note
Springer Nature remains neutral with regard to jurisdictional claims in published maps and institutional affiliations.
References
- 1.Treglia G. Diagnostic performance of 18F-FDG PET/CT in infectious and inflammatory diseases according to published meta-analyses. Contrast Media Mol Imaging. Hindawi Ltd. and John Wiley and Sons, Inc.; 2019;2019:3018349. [DOI] [PMC free article] [PubMed]
- 2.Qin C, Liu F, Yen TC, Lan X. 18F-FDG PET/CT findings of COVID-19: a series of four highly suspected cases. Eur J Nucl Med Mol Imaging. 2020. [DOI] [PMC free article] [PubMed]
- 3.Annunziata S, Delgado Bolton RC, Kamani CH, Prior JO, Albano D, Bertagna F, et al. Role of 2-[18f]fdg as a radiopharmaceutical for pet/ct in patients with covid-19: a systematic review. Pharmaceuticals. 2020. [DOI] [PMC free article] [PubMed]
- 4.Living with Covid19. 2020.
- 5.Greenhalgh T, Knight M, A’Court C, Buxton M, Husain L. Management of post-acute covid-19 in primary care. BMJ. British Medical Journal Publishing Group; 2020;370:m3026. [DOI] [PubMed]
- 6.The Lancet. Facing up to long COVID. Lancet. 2020. [DOI] [PMC free article] [PubMed]
- 7.Meeting the challenge of long COVID. Nat Med. 2020;26:1803. [DOI] [PubMed]
- 8.Delorme C, Paccoud O, Kas A, Hesters A, Bombois S, Shambrook P, et al. COVID-19-related encephalopathy: a case series with brain FDG-positron-emission tomography/computed tomography findings. Eur J Neurol Eur J Neurol. 2020;27:2651–2657. doi: 10.1111/ene.14478. [DOI] [PMC free article] [PubMed] [Google Scholar]
- 9.Guedj E, Million M, Dudouet P, Tissot-Dupont H, Bregeon F, Cammilleri S, et al. 18F-FDG brain PET hypometabolism in post-SARS-CoV-2 infection: substrate for persistent/delayed disorders? Eur J Nucl Med Mol Imaging. Eur J Nucl Med Mol Imaging. 2020. [DOI] [PMC free article] [PubMed]
- 10.Kas A, Soret M, Pyatigoskaya N, Habert M-O, Hesters A, Le Guennec L, et al. The cerebral network of COVID-19-related encephalopathy: a longitudinal voxel-based 18F-FDG-PET study. Eur J Nucl Med Mol Imaging. Eur J Nucl Med Mol Imaging. 2021. [DOI] [PMC free article] [PubMed]
- 11.Guedj E, Campion JY, Dudouet P, Kaphan E, Bregeon F, Tissot-Dupont H, et al. 18F-FDG brain PET hypometabolism in patients with long COVID. Eur J Nucl Med Mol Imaging. Springer; 2021;1–11. [DOI] [PMC free article] [PubMed]
- 12.Ling Y, Xu S-B, Lin Y-X, Tian D, Zhu Z-Q, Dai F-H, et al. Persistence and clearance of viral RNA in 2019 novel coronavirus disease rehabilitation patients. Chin Med J (Engl) 2020;133:1039–1043. doi: 10.1097/CM9.0000000000000774. [DOI] [PMC free article] [PubMed] [Google Scholar]
- 13.Jiang L, Tang K, Levin M, Irfan O, Morris SK, Wilson K, et al. COVID-19 and multisystem inflammatory syndrome in children and adolescents. Lancet Infect Dis. 2020;20:e276–e288. doi: 10.1016/S1473-3099(20)30651-4. [DOI] [PMC free article] [PubMed] [Google Scholar]
- 14.Morris SB, Schwartz NG, Patel P, Abbo L, Beauchamps L, Balan S, et al. Case series of multisystem inflammatory syndrome in adults associated with SARS-CoV-2 infection — United Kingdom and United States, March–August 2020. MMWR Morb Mortal Wkly Rep. 2020;69:1450–1456. doi: 10.15585/mmwr.mm6940e1. [DOI] [PMC free article] [PubMed] [Google Scholar]
- 15.Maiese A, Manetti AC, La Russa R, Di Paolo M, Turillazzi E, Frati P, et al. Autopsy findings in COVID-19-related deaths: a literature review. Forensic Sci Med Pathol. 2020. [DOI] [PMC free article] [PubMed]
- 16.Jamar F, Buscombe J, Chiti A, Christian PE, Delbeke D, Donohoe KJ, et al. EANM/SNMMI guideline for 18F-FDG use in inflammation and infection. J Nucl Med. 2013;54:647–658. doi: 10.2967/jnumed.112.112524. [DOI] [PubMed] [Google Scholar]
- 17.Love C, Tomas MB, Tronco GG, Palestro CJ. FDG PET of infection and inflammation. RadioGraphics. 2005;25:1357–1368. doi: 10.1148/rg.255045122. [DOI] [PubMed] [Google Scholar]
- 18.Boellaard R, Delgado-Bolton R, Oyen WJG, Giammarile F, Tatsch K, Eschner W, et al. FDG PET/CT: EANM procedure guidelines for tumour imaging: version 2.0. Eur J Nucl Med Mol Imaging. 2014:42, 328–354. [DOI] [PMC free article] [PubMed]
- 19.Sollini M, Ciccarelli M, Cecconi M, Aghemo A, Morelli P, Gelardi F, et al. Vasculitis changes in COVID-19 survivors with persistent symptoms: an [18F]FDG-PET/CT study. Eur J Nucl Med Mol Imaging. 2020. [DOI] [PMC free article] [PubMed]
- 20.Slart RHJA. FDG-PET/CT(a) imaging in large vessel vasculitis and polymyalgia rheumatica: joint procedural recommendation of the EANM, SNMMI, and the PET Interest Group (PIG), and endorsed by the ASNC. Eur J Nucl Med Mol Imaging. 2018;45:1250–1269. doi: 10.1007/s00259-018-3973-8. [DOI] [PMC free article] [PubMed] [Google Scholar]
- 21.Huang YC, Hsu CC, Huang P, Yin TK, Chiu NT, Wang PW, et al. The changes in brain metabolism in people with activated brown adipose tissue: a PET study. Neuroimage. 2011. [DOI] [PubMed]
- 22.Hua C, Merchant TE, Li X, Li Y, Shulkin BL. Establishing age-associated normative ranges of the cerebral 18F-FDG uptake ratio in children. J Nucl Med. 2015;56:575–579. doi: 10.2967/jnumed.114.146993. [DOI] [PubMed] [Google Scholar]
- 23.Friston KJ, Holmes AP, Worsley KJ, Poline J-P, Frith CD, Frackowiak RSJ. Statistical parametric maps in functional imaging: a general linear approach. Hum Brain Mapp. 1994;2:189–210. doi: 10.1002/hbm.460020402. [DOI] [Google Scholar]
- 24.Della Rosa PA, Cerami C, Gallivanone F, Prestia A, Caroli A, Castiglioni I, et al. A standardized [18F]-FDG-PET template for spatial normalization in statistical parametric mapping of dementia. Neuroinformatics. 2014;12:575–593. doi: 10.1007/s12021-014-9235-4. [DOI] [PubMed] [Google Scholar]
- 25.Hajian-Tilaki K. Sample size estimation in diagnostic test studies of biomedical informatics. J Biomed Inform. Elsevier Inc.; 2014;48:193–204. [DOI] [PubMed]
- 26.Lieberman MD, Cunningham WA. Type I and type II error concerns in fMRI research: re-balancing the scale. Soc Cogn Affect Neurosci. 2009;4:423–428. doi: 10.1093/scan/nsp052. [DOI] [PMC free article] [PubMed] [Google Scholar]
- 27.Libby P, Lüscher T. COVID-19 is, in the end, an endothelial disease. Eur Heart J. 2020;41:3038–3044. doi: 10.1093/eurheartj/ehaa623. [DOI] [PMC free article] [PubMed] [Google Scholar]
- 28.Karimi-Galougahi M, Yousefi-Koma A, Bakhshayeshkaram M, Raad N, Haseli S. 18FDG PET/CT scan reveals hypoactive orbitofrontal cortex in anosmia of COVID-19. Acad Radiol. 2020;27:1042–1043. doi: 10.1016/j.acra.2020.04.030. [DOI] [PMC free article] [PubMed] [Google Scholar]
- 29.Ances BM, Vitaliani R, Taylor RA, Liebeskind DS, Voloschin A, Houghton DJ, et al. Treatment-responsive limbic encephalitis identified by neuropil antibodies: MRI and PET correlates. Brain. 2005;128:1764–1777. doi: 10.1093/brain/awh526. [DOI] [PMC free article] [PubMed] [Google Scholar]
- 30.Marini C, Morbelli S, Cistaro A, Campi C, Caponnetto C, Bauckneht M, et al. Interplay between spinal cord and cerebral cortex metabolism in amyotrophic lateral sclerosis. Brain. 2018;141:2272–2279. doi: 10.1093/brain/awy152. [DOI] [PMC free article] [PubMed] [Google Scholar]
- 31.Bai Y, Xu J, Chen L, Fu C, Kang Y, Zhang W, et al. Inflammatory response in lungs and extrapulmonary sites detected by [18F] fluorodeoxyglucose PET/CT in convalescing COVID-19 patients tested negative for coronavirus. Eur J Nucl Med Mol Imaging. Eur J Nucl Med Mol Imaging. 2021. [DOI] [PMC free article] [PubMed]
- 32.Chefer S, Thomasson D, Seidel J, Reba RC, Bohannon JK, Lackemeyer MG, et al. Modeling [18F]-FDG lymphoid tissue kinetics to characterize nonhuman primate immune response to Middle East respiratory syndrome-coronavirus aerosol challenge. EJNMMI Res. 2015;5:65. doi: 10.1186/s13550-015-0143-x. [DOI] [PMC free article] [PubMed] [Google Scholar]
- 33.Becker RC. COVID-19 update: Covid-19-associated coagulopathy. J Thromb Thrombolysis. 2020;50:54–67. doi: 10.1007/s11239-020-02134-3. [DOI] [PMC free article] [PubMed] [Google Scholar]
- 34.Becker RC. COVID-19-associated vasculitis and vasculopathy. J Thromb Thrombolysis Springer. 2020:1–13. [DOI] [PMC free article] [PubMed]
- 35.Pijl JP, Kwee TC, Slart RHJA, Yakar D, Wouthuyzen-Bakker M, Glaudemans AWJM. Clinical implications of increased uptake in bone marrow and spleen on FDG-PET in patients with bacteremia. Eur J Nucl Med Mol Imaging. 2020. [DOI] [PMC free article] [PubMed]
- 36.Bahce I, Vos CG, Dickhoff C, Hartemink KJ, Dahele M, Smit EF, et al. Metabolic activity measured by FDG PET predicts pathological response in locally advanced superior sulcus NSCLC. Lung Cancer. 2014;85:205–212. doi: 10.1016/j.lungcan.2014.04.010. [DOI] [PubMed] [Google Scholar]
- 37.Kazama T, Swanston N, Podoloff DA, Macapinlac HA. Effect of colony-stimulating factor and conventional- or high-dose chemotherapy on FDG uptake in bone marrow. Eur J Nucl Med Mol Imaging. 2005;32:1406–1411. doi: 10.1007/s00259-005-1890-0. [DOI] [PubMed] [Google Scholar]
- 38.Dyall J, Johnson RF, Chefer S, Leyson C, Thomasson D, Seidel J, et al. [18F]-Fluorodeoxyglucose uptake in lymphoid tissue serves as a predictor of disease outcome in the nonhuman primate model of monkeypox virus infection. McFadden G, editor. J Virol. 2017;91. [DOI] [PMC free article] [PubMed]
- 39.Stephen G. Baum M. Adult multisystem inflammatory syndrome associated with COVID-19. NEJM J Watch; 2020;2020.
- 40.Xiang YT, Yu X, Ungvari GS, Correll CU, Chiu HFK. Outcomes of SARS survivors in China: not only physical and psychiatric co-morbidities. East Asian Arch Psychiatr. 2014;24:37–38. [PubMed] [Google Scholar]
- 41.Ferrucci L, Fabbri E. Inflammageing: chronic inflammation in ageing, cardiovascular disease, and frailty. Nat Rev Cardiol. 2018. [DOI] [PMC free article] [PubMed]
- 42.Sudre CH, Murray B, Varsavsky T, Graham MS, Penfold RS, Bowyer RC, et al. Attributes and predictors of long-COVID: analysis of COVID cases and their symptoms collected by the Covid Symptoms Study App. medRxiv. Cold Spring Harbor Laboratory Press; 2020;2020.10.19.20214494.
Associated Data
This section collects any data citations, data availability statements, or supplementary materials included in this article.
Supplementary Materials
(DOCX 31 kb)
Data Availability Statement
The manuscript represents valid work, and neither this manuscript nor one with substantially similar content under the same authorship has been published or is being considered for publication elsewhere. Arturo Chiti had full access to all the data in the study and takes responsibility for the data integrity and the accuracy of the data analysis. Raw data are available on specific request to the corresponding author.