Abstract
Objective
To analyze the evolution of chest computed tomography (CT) findings from admission to follow-up in moderate to severe patients with coronavirus disease-19 (COVID-19) pneumonia.
Methods
During December 2019–April 2020, the sequential CT images of 30 patients with COVID-19 pneumonia were retrospectively analyzed from admission to follow-up. The qualitative evolution tendency of lung abnormalities and semi-quantitative CT scores were analyzed for temporal change.
Results
The mean hospitalized period was 24.5 ± 9.6 days (range 6–49 days). The average time from the first, second, third, fourth and follow-up CT examination to the initial symptom onset were 4.2 ± 3.1 days, 10.7 ± 4.4 days, 17.1 ± 3.9 days, 24.6 ± 7.5 days, and 42.4 ± 15.6 days, respectively. During illness day 0–5, groundglass opacity (GGO) was the main pattern. The following illness day 6–11, the main CT pattern was consolidation and reticular pattern. The consolidation and reticular pattern gradually dissipate during illness day 12–23, and the reticular pattern and light GGO increased. When illness day was ≥ 24 days, the reticular pattern and light GGO gradually decrease until complete dissipation. The highest CT score was at illness day 6–11. Pearson correlation analysis showed that the mean and maximum CT score were not correlated with the length of fever (r = 0.018, p = 0.923 and r = 0.086, p = 0.652) and hospitalization (r = 0.192, p = 0.31 and r = 0.273, p = 0.144).
Conclusions
The dynamic evolution of CT manifestation in moderate to severe COVID-19 pneumonia patients followed a specific pattern over time. During illness day 6–11, the extent of lung abnormalities on chest CT was the most severe.
Supplementary Information
The online version contains supplementary material available at 10.1007/s42058-021-00058-2.
Keywords: COVID-19, Pneumonia, X-ray computed, Tomography, Evolution
Introduction
Coronavirus disease 2019 (COVID-19) was declared as a public health emergency of international concern by the World Health Organization (WHO) in Jan 30, 2020 [1]. It was first reported in Wuhan, China, and had rapidly swept around the world just within a month. It had almost subsided since the resumption of traffic control in Wuhan, the worst epidemic area in China on Apr 8, 2020. In China, the chest CT images were the important judged standard in diagnosis and treatment protocols issued by the National Health Commission of the People’s Republic of China [2]. The CT features [3, 4] of COVID-19 pneumonia had been summarized and the role [5, 6] of chest CT in the diagnosis and management of COVID-19 pneumonia patients had been reported. The clinical characteristic [7, 8] and clinical course, risk factors [9] were also analyzed. The temporal changes of CT findings were described qualitatively and quantitatively in patients with COVID-19 pneumonia in few stuties [4, 10], but which rarely included follow-up CT after discharge. The purpose of the study is to qualitatively and semi-quantitatively analyze the evolution tendency of chest CT images from symptom onset to follow-up after discharge in COVID-19 pneumonia patients.
Materials and methods
This retrospective study was approved by the Institutional Review Board of Yijishan Hospital of Wannan Medical College and informed consent was waived.
Patients
Thirty adult patients (23 from Xiangyang, Hubei province and 7 from Wuhu, Anhui province) with confirmed COVID-19 pneumonia were admitted to two hospitals in China and who underwent sequential chest CT were enrolled in this study from Dec 2019 to Apr 2020. The inclusion criteria included: (1) all patients were confirmed COVID-19 infection via laboratory testing with real-time reverse transcriptase-polymerase chain reaction. (2) According to the clinical classification of novel coronavirus pneumonia diagnosis and treatment protocols (Seventh Edition) issued by the National Health Commission of the People’s Republic of China, moderate to severe types were included [11]. (3) Underwent chest CT imaging at least three times during hospitalization and once after discharge. (4) All the electronic records were available.
Treatment principle and discharge criteria were followed the Diagnosis and Treatment Protocol for Novel Coronavirus Pneumonia issued by the National Health Commission of the People’s Republic of China.
CT protocol and image interpretation
All patients underwent a single inspiratory phase non-enhanced chest CT scanning in two multi-detector CT scanners (GE Optima CT540, GE Healthcare, USA and Philips Ingenuity Core128, Philips Medical System, Netherlands). All patients were instructed on breath-holding and in the supine position, with the scanning scope covering the entire thorax. The following CT parameters were used: tube voltage 120 kVp with automatic tube current modulation, pulmonary reconstructed kernel and mediastinal reconstructed kernel with a thickness of 5 mm and increment of 5 mm. Meanwhile, a pulmonary reconstructed kernel with a thickness of 1.5 mm and increment of 1.5 mm was for evaluation of the detail of lung CT findings.
The terminology [12] defined by Fleischner Society was used to describe the patterns of CT images, including ground-glass opacity (GGO), consolidation, reticular pattern, and mixed pattern. The quantitative CT was assessed with a semi-quantitative scoring method according to previous study [10]. The scoring was performed on the 5 mm lung window (window width: 1200–1500 Hu, window level: − 700 to − 800 Hu) according to area percentage of lung involvement. Each of lobes was visually scored from 0 to 5 for percentage of lung involvement: 0, no involvement; (1) < 5% involvement; (2) 6–25% involvement; (3) 26–49% involvement; (4) 50–75% involvement; (5) > 75% involvement. Overall CT score was the sum of the individual lobar scores and the maximum score was 25. The evolution tendency of pattern and score over time was evaluated. All CT images were reviewed by two experienced radiologists (YF Zhou and JT Wang), and the decision was reached in consensus.
The clinical characteristic evaluation
Demographic, clinical symptoms, laboratory tests and inpatients data were extracted from the electronic medical record. Fever was defined as the axillary temperature of at least 37.3 °C. The patients underwent CT scan at admission and before discharge, and the physician decided the time point of CT scan during hospitalization according to the patient’s symptoms. The follow-up CT is at least 1 week after discharge. Illness day 0 was defined as the day of initial symptom onset, not the time of admission.
Statistical analysis
CT scans in every 6 days after symptom onset were categorized as one group for analysis. The dynamic evolution of CT scores and the distribution of the main patterns of lung abnormalities were plotted. Pearson correlation coefficients were used to assess the presence of linear associations of the CT score with the hospitalization duration, fever duration. P value < 0.05 was considered to be statistically significant. Statistical analyses were performed using SPSS software (version 25.0, SPSS).
Results
Thirty patients with confirmed COVID-19 pneumonia were evaluated. The demographic and baseline clinical characteristics were summarized in Table 1.
Table 1.
The demographic and baseline clinical characteristics
| Variable | Patients (n = 30) |
|---|---|
| Age (years) | Mean 48.23 ± 11.95, Range 18–75 |
| Sex | |
| Male | 18 |
| Female | 12 |
| Underlying diseases | |
| Hypertension | 2 |
| Diabetes | 3 |
| Asthma | 1 |
| Clinical symptoms | |
| Fever | 30/100% |
| Cough | 16/53% |
| Fatigue | 4/13% |
| Throat pain/shortness of breath | 6/30% |
| Diarrhea | 6/6.7% |
| Headache | 4/13% |
| Muscle pain | 2/6.7% |
| Laboratory tests | |
| Leucocytes (× 109 per L) | |
| Increase | 2 |
| Normal | 22 |
| Decrease | 6 |
| Neutrophils (× 109 per L) | |
| Increase | 6 |
| Normal | 21 |
| Decrease | 3 |
| Lymphocytes (× 109 per L) | |
| Increase | 0 |
| Normal | 15 |
| Decrease | 15 |
| Monocyte (× 109 per L) | |
| Increase | 11 |
| Normal | 19 |
| Erythrocyte (× 109 per L) | |
| Normal | 26 |
| Decrease | 4 |
| Erythrocyte sedimentation rate (mm/1 h) | |
| Normal | 5 |
| Increase | 25 |
| C-reactive protein (mg/L) | |
| Normal | 10 |
| Increase | 20 |
The mean hospitalized period was 24.5 ± 9.6 days (range 6–49 days). The average time from the first, second, third, fourth and follow-up CT examination to the initial symptom onset was 4.2 ± 3.1 days, 10.7 ± 4.4 days, 17.1 ± 3.9 days, 24.6 ± 7.5 days, and 42.4 ± 15.6 days, respectively. Patients underwent three, four and five times CT scan during hospitalization were 16/30 (53.3%), 13/30 (43.3%), 1/30 (3.3%), respectively.
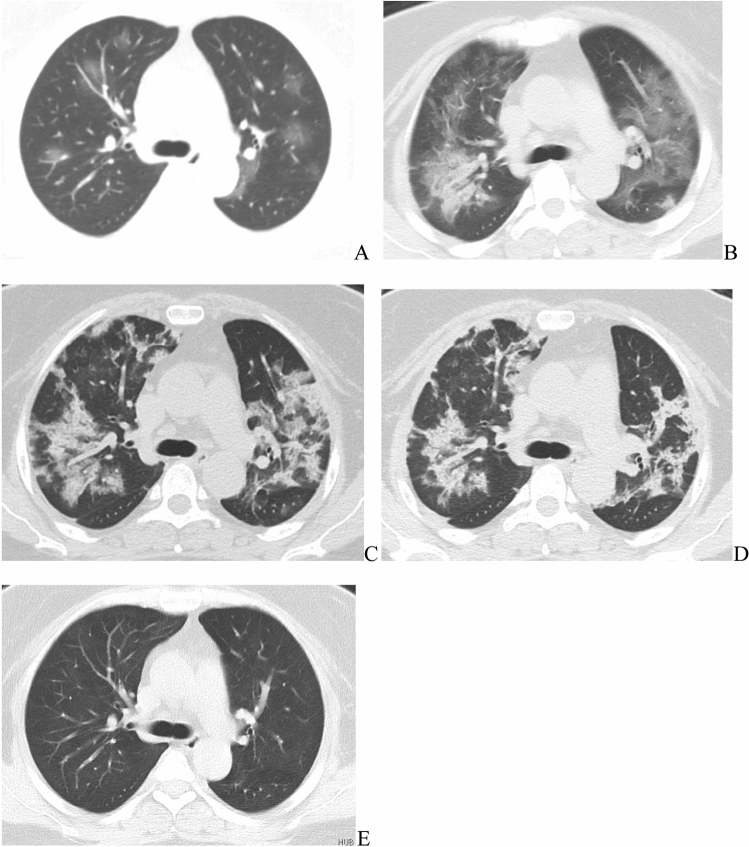
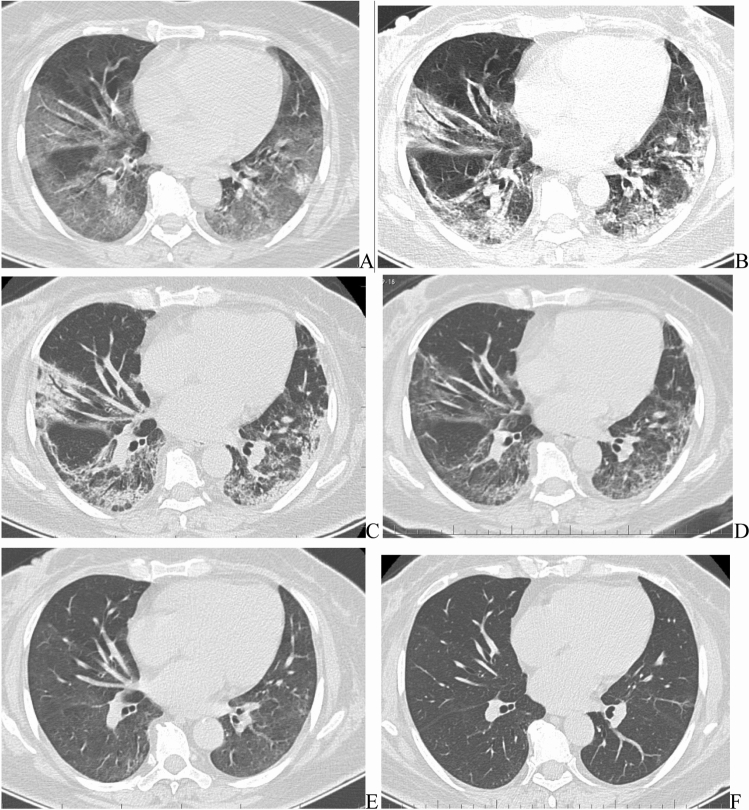
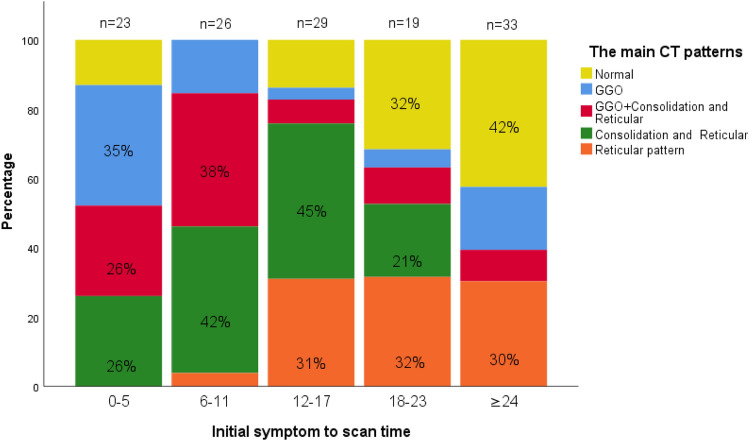
The evolution of CT patterns was shown in Figs. 1, 2 and 3. During illness day 0–5, GGO was the main pattern, and some patients superimposed consolidation and reticular pattern or mainly manifested consolidation and reticular pattern without GGO. The following illness day 6–11, the main CT pattern was consolidation and reticular pattern. The consolidation and reticular pattern were often developed from GGO or the new consolidation and reticular originated from other lung segments. The consolidation and reticular pattern gradually began to dissipate during illness day 12–23, and the reticular pattern and light GGO increased. When illness day was ≥ 24 days, the reticular pattern and light GGO gradually decrease until complete dissipation. The quantitative CT score was showed in Figs. 4 and 5, and the highest CT score was on illness day 6–11.
Fig. 1.
Dynamic evolution of the main CT patterns in a 34-year female COVID-19 pneumonia patient. a–e Were the typical CT pattern at the illness day 3, 8, 15, 22, and 65, respectively.GGO was the main pattern at day 3, then rapidly progressed and presented as GGO + consolidation at day 8. During day 12–23, the reticular patterns increased and the consolidation reduced and dissipated gradually. On day 65, the lung abnormities completely disappeared
Fig. 2.
Dynamic evolution of the main CT patterns in a 56-year female COVID-19 pneumonia patient. a–e Were the CT pattern at the illness day 6, 10, 15, 20, 38, and 65, respectively. The evolution course of CT patterns was similar to Fig. 1. In the follow-up CT (d, e), lung abnormities gradually dissipated and completely disappeared
Fig. 3.
Dynamic evolution of the main CT patterns in COVID-19 pneumonia patients over time. Stacked bar graphs showed the distribution of the main CT patterns of COVID-19 pneumonia at various time points from symptom onset. Categories with percentage ≥ 20% are shown. GGO ground-glass opacity
Fig. 4.
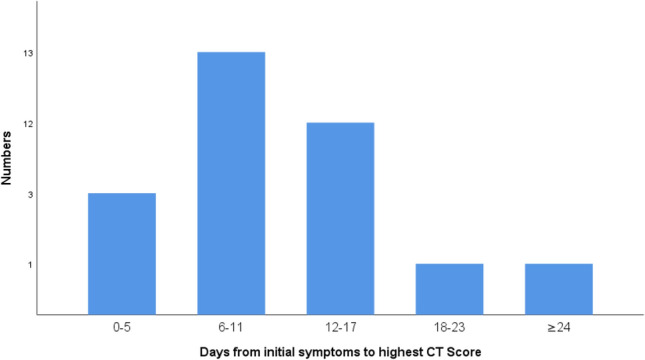
Distribution of days from initial symptoms to highest CT score in COVID-19 pneumonia patient. When the highest total CT score was reached, the highest number (13/30, 43%) of people had a peak CT score on illness days 6–11
Fig. 5.
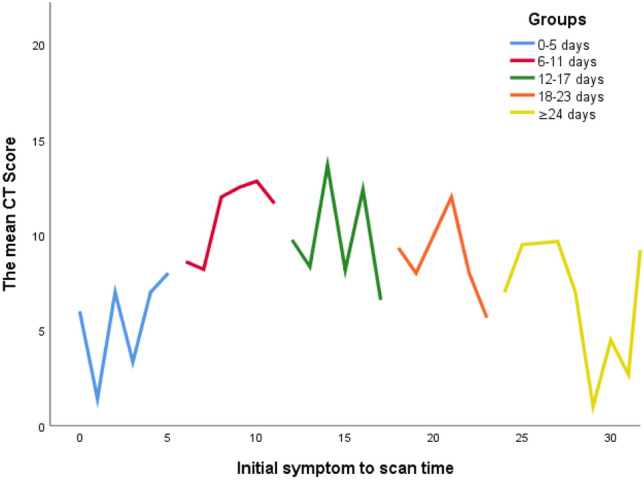
Dynamic evolution of the mean CT score over time in COVID-19 pneumonia patient. The CT scores increased rapidly after symptom onset, peaked during illness days 6–11, then reduced and dissipated gradually until it was disappeared
The chest CT findings were completely normal in 33.3% (10/30) patients and the chest CT score was less than or equal to 5 in 43.3% (13/30) patients at follow-up after discharge.
Pearson correlation analysis showed that the mean and maximum CT score were not correlated with the length of fever (r = 0.018, p = 0.923 and r = 0.086, p = 0.652) and hospitalization (r = 0.192, p = 0.31 and r = 0.273, p = 0.144).
Discussion
The study retrospectively depicted the dynamic evolution of COVID-19 pneumonia in CT findings qualitatively and semi-quantitatively. The results suggested that the dynamic evolution of CT manifestation in COVID-19 pneumonia followed a specific pattern over time. At the illness day 0–5, the GGO was the main pattern, and then it rapidly progressed into consolidation during illness day 6–11. The CT score reached the peak at this period. During illness day 12–23, the consolidation gradually reduced and dissipated as well as the reticular patters increased. When the illness day > 24 days, the opacities continued to absorbed until completely disappeared. Wang et al. [4] reported the same temporal changes in 90 patients with COVID-19 pneumonia. Pan et al. [10] defined the evolution of CT findings as early stage (0–4 days); progressive stage (5–8 days); peak stage (10–13 days); and absorption stage (≥ 14 days). But our study included the follow-up CT images after discharge. The lung opacities in 50% of patients disappeared completely in follow-up CT, which was not mentioned in previous studies.
The features of chest CT in COVID-19 pneumonia were summarized in previous studies [3, 13, 14], which included predominantly bilateral and multifocal involvement with a peripheral or posterior distribution. In initial CT, GGO was the main pattern in most patients, and consolidation superimposed on GGO was found in a smaller number of the elderly population, septal thickening(reticular and crazy paving pattern), bronchiectasis and bronchial wall thickening, pleural thickening, and subpleural curvilinear line, fibrosis was mainly in the later stages of the disease. Because these studies were cross-sectional at different stages in different patients, CT manifestations were diverse. It seemed to be difficult to understand and distinguish these features of CT findings. In fact, the aforementioned various CT features were the manifestation of COVID-19 pneumonia in different periods, which was well illustrated longitudinally in this study. In previous studies [15, 16] fibrosis was considered as a chest CT pattern in COVID-19 pneumonia. But in this longitudinal study, the lung opacities in 50% of patients disappeared completely in follow-up CT. If it was long enough to recover, the lung opacities would disappear completely. Therefore, without sufficient follow-up time, fibrosis cannot be considered as a CT pattern of COVID-19 pneumonia.
A multinational consensus [5] had been issued on the role of chest imaging in the management of COVID-19 pneumonia patients. Imaging is not indicated for asymptomatic and mild feature patients, while imaging is indicated for patients with moderate to severe features and worsening respiratory status. In this study, the evolution process of lung abnormality in chest CT was presented in moderate to severe patients, which is helpful for physicians to know well the stage of the illness. In addition to chest CT, the patient’s clinical characteristics must be considered in the management of COVID-19 pneumonia. The results showed that mean and maximum CT score were not correlated with the length of fever and hospitalization. Except for the length of fever and hospitalization, some clinical characteristics were not recorded regularly in some patients in this retrospective study. So we just listed baseline clinical characteristics at admission, the dynamic evolution of clinical characteristics, and the relationship between clinical characteristics and CT findings were not been analyzed.
There were several limitations to our study. First, the sample size was small. There were no new cases in these two hospitals until we submitted. Second, the asymptomatic, mild patients and the dead were excluded due to the inclusion criteria. Third, the follow-up time was inconsistent, and some patients needed longer follow-up to assess the lung opacities absorption. Fourth, the correlation between dynamic evolution of clinical characteristics and CT findings had not been analyzed.
In conclusion, the distribution and pattern of lung opacities in chest CT has certain characteristics and there are corresponding CT findings at a different stage in COVID-19 pneumonia. The dynamic evolution of CT manifestation in COVID-19 pneumonia followed a specific pattern over time.
Supplementary Information
Below is the link to the electronic supplementary material.
Acknowledgements
We are grateful to all personnel who work at The First Affiliated Hospital of Wannan Medical College and Xiangyang Central Hospital, Affiliated Hospital of Hubei University of Arts and Science for their dedicated and tireless effort in the fight against Covid-19.
Funding
None.
Declarations
Conflict of interest
None of the authors have any conflicts of interest to disclose. We confirm that we have read the Journal’s position on issues involved in ethical publication and affirm that this report is consistent with those guidelines.
Footnotes
Publisher's Note
Springer Nature remains neutral with regard to jurisdictional claims in published maps and institutional affiliations.
Yunfeng Zhou and Hao Ren contributed equally to this paper.
References
- 1.Coronavirus disease (COVID-19) outbreak. World Health Organization. 2020. https://www.who.int/docs/default-source/coronaviruse/situation-reports/20200131-sitrep-11-ncov.pdf?sfvrsn=de7c0f7_4. Accessed 31 January 2020.
- 2.The Diagnosis and Treatment Protocol for Novel Coronavirus Pneumonia (Trial Version Seven). National Health Commission of the People’s Republic of China. 2020. http://en.nhc.gov.cn/search.html?searchText=The+Diagnosis+and+Treatment+Protocol+for+Novel+Coronavirus+Pneumonia+%28Trial+Version+Seven%29. Accessed 3 March 2020.
- 3.Zhou S, Wang Y, Zhu T, Xia L. CT features of coronavirus disease 2019 (COVID-19) Pneumonia in 62 patients in Wuhan, China. AJR Am J Roentgenol. 2020;214(6):1287–1294. doi: 10.2214/AJR.20.22975. [DOI] [PubMed] [Google Scholar]
- 4.Wang Y, Dong C, Hu Y, Li C, Ren Q, Zhang X, et al. Temporal changes of CT findings in 90 patients with COVID-19 Pneumonia: a longitudinal study. Radiology. 2020;296(2):E55–E64. doi: 10.1148/radiol.2020200843. [DOI] [PMC free article] [PubMed] [Google Scholar]
- 5.Rubin GD, Ryerson CJ, Haramati LB, Sverzellati N, Kanne JP, Raoof S, et al. The role of chest imaging in patient management during the COVID-19 Pandemic: a multinational consensus statement from the Fleischner society. Radiology. 2020;296(1):172–180. doi: 10.1148/radiol.2020201365. [DOI] [PMC free article] [PubMed] [Google Scholar]
- 6.Yang W, Sirajuddin A, Zhang X, Liu G, Teng Z, Zhao S, et al. The role of imaging in 2019 novel coronavirus pneumonia (COVID-19) Eur Radiol. 2020;30(9):4874–4882. doi: 10.1007/s00330-020-06827-4. [DOI] [PMC free article] [PubMed] [Google Scholar]
- 7.Guan WJ, Ni ZY, Liang WH, Ou CQ, He JX, Liu L, et al. Clinical characteristics of coronavirus disease 2019 in China. N Engl J Med. 2020;382(18):1708–1720. doi: 10.1056/NEJMoa2002032. [DOI] [PMC free article] [PubMed] [Google Scholar]
- 8.Grasselli G, Zangrillo A, Zanella A, Antonelli M, Cabrini L, Castelli A, et al. Baseline characteristics and outcomes of 1591 patients infected with SARS-CoV-2 admitted to ICUs of the Lombardy region. Italy JAMA. 2020;323(16):1574–1581. doi: 10.1001/jama.2020.5394. [DOI] [PMC free article] [PubMed] [Google Scholar]
- 9.Zhou F, Yu T, Du R, Fan G, Liu Y, Liu Z, et al. Clinical course and risk factors for mortality of adult inpatients with COVID-19 in Wuhan, China: a retrospective cohort study. Lancet. 2020;395(10229):1054–1062. doi: 10.1016/S0140-6736(20)30566-3. [DOI] [PMC free article] [PubMed] [Google Scholar]
- 10.Pan F, Ye T, Sun P, Gui S, Liang B, Li L, et al. Time course of lung changes on chest CT during recovery from 2019 novel coronavirus (COVID-19) Pneumonia. Radiology. 2020;295(3):715–721. doi: 10.1148/radiol.2020200370. [DOI] [PMC free article] [PubMed] [Google Scholar]
- 11.Zu ZY, Jiang MD, Xu PP, Chen W, Ni QQ, Lu GM, et al. Coronavirus disease 2019 (COVID-19): a perspective from China. Radiology. 2020 doi: 10.1148/radiol.2020200490. [DOI] [PMC free article] [PubMed] [Google Scholar]
- 12.Hansell DM, Bankier AA, MacMahon H, Mcloud TC, Müller NL, Remy J. Fleischner Society:glossary of terms for thoracic imaging. Radiology. 2008;246(3):697–722. doi: 10.1148/radiol.2462070712. [DOI] [PubMed] [Google Scholar]
- 13.Salehi S, Abedi A, Balakrishnan S, Gholamrezanezhad A. Coronavirus disease 2019 (COVID-19): a systematic review of imaging findings in 919 patients. AJR Am J Roentgenol. 2020;215(1):87–93. doi: 10.2214/AJR.20.23034. [DOI] [PubMed] [Google Scholar]
- 14.Ye Z, Zhang Y, Wang Y, Huang Z, Song B. Chest CT manifestations of new coronavirus disease 2019 (COVID-19): a pictorial review. Eur Radiol. 2020;30(8):4381–4389. doi: 10.1007/s00330-020-06801-0. [DOI] [PMC free article] [PubMed] [Google Scholar]
- 15.Xu YH, Dong JH, An WM, Lv XY, Yin XP, Zhang JZ, et al. Clinical and computed tomographic imaging features of novel coronavirus pneumonia caused by SARS-CoV-2. J Infect. 2020;80(4):394–400. doi: 10.1016/j.jinf.2020.02.017. [DOI] [PMC free article] [PubMed] [Google Scholar]
- 16.Dai H, Zhang X, Xia J, Zhang T, Shang Y, Huang R, et al. High-resolution chest CT features and clinical characteristics of patients infected with COVID-19 in Jiangsu, China. Int J Infect Dis. 2020;95:106–112. doi: 10.1016/j.ijid.2020.04.003. [DOI] [PMC free article] [PubMed] [Google Scholar]
Associated Data
This section collects any data citations, data availability statements, or supplementary materials included in this article.


