Abstract
We present a method for using dynamic light scattering in the single-scattering limit to measure the viscoelastic moduli of soft materials. This microrheology technique only requires a small sample volume of 12 μL to measure up to six decades in time of rheological behavior. We demonstrate the use of dynamic light scattering microrheology (DLSμR) on a variety of soft materials, including dilute polymer solutions, covalently-crosslinked polymer gels, and active, biological fluids. In this work, we detail the procedure for applying the technique to new materials and discuss the critical considerations for implementing the technique, including a custom analysis script for analyzing data output. We focus on the advantages of applying DLSμR to biologically relevant materials: breast cancer cells encapsulated in a collagen gel and cystic fibrosis sputum. DLSμR is an easy, efficient, and economical rheological technique that can guide the design of new polymeric materials and facilitate the understanding of the underlying physics governing behavior of naturally derived materials.
Graphical Abstract
1. Introduction
The physical behavior of materials, both naturally occurring and synthetically engineered, dictate their function. Covalently-linked polymers such as poly(dimethylsiloxane) (PDMS) exhibit mold-ability and elasticity, making PDMS widely used in the fabrication of microfluidic devices.1 On the other hand, polymer gels formed via dynamic bonds, such as guest-host interactions or peptide self-assembly, can be leveraged for their transient bonding properties in a range of self-healing material applications from drug delivery and engineered cell matrices to soft electronics.2-5 Even naturally occurring polymer solutions exhibit mechanical properties that can contribute to a disease state, such as mucus in the lungs of patients with cystic fibrosis.6,7
There are many different microrheology techniques available to characterize the physical behavior of materials, and each of those techniques has its own advantages and disadvantages that limit its overall applicability. Optical tweezers can be advantageous for measuring nonlinear rheology but require costly, specialized equipment.8,9 Like other passive microrheology techniques, particle tracking microrheology can measure the linear viscoelasticity of materials with the advantage of being able to spatially resolve rheological behavior in heterogeneous materials.8,10,11 However, in the absence of high speed video cameras, particle tracking microrheology can be restricted to measuring soft materials due to limitations in temporal and spatial resolution.8,10,12,13 Even techniques that can overcome some of these limitations have drawbacks, including large sample volumes for diffusing wave spectroscopy and confinement of measurements to lower frequencies for differential dynamic microscopy.12,14-19 In this paper, we describe a nondestructive microrheology technique that requires 12 μL of sample and leverages the commercial benchtop dynamic light scattering (DLS) instrument often already available to many lab researchers.20 Based on DLS in the single-scattering limit, DLS microrheology (DLSμR) captures the linear viscoelastic behavior of materials with stiffnesses in the range of 10−1 to 104 Pa by using the long-established theory for spherical, Brownian particles diffusing in a fluid.11,20-22 As with all passive rheology approaches, DLSμR is only capable of measuring linear rheological behavior and cannot measure nonlinear rheology.23 We have previously reported the development of this method to quantify rheological behavior of precious volume-limited biological samples such as intestinal mucus.20 Here, we significantly broaden the scope of different materials that are suitable for DLSμR analysis and provide a detailed description of the protocol to make the technique readily available to the soft materials community. This paper aims to make DLSμR a more approachable technique that experimentalists can easily understand and leverage to reveal detailed physical behavior of viscoelastic materials.
In terms of implementation, we provide a prepackaged analysis script to ease setup and use of this technique. We also detail considerations to identify and minimize potential sample interactions with probe particles. We further demonstrate the ability to measure over six decades in time (from 10−6 to 10 s) without the use of time-temperature superposition due to the absence of the inertial effects that often plague other rheology techniques. Due to the ensemble averaging inherent in measuring scattering intensity, DLSμR lacks spatial resolution of forces detected in the sample. However, the nondestructive nature of this technique is an advantage that allows for rheological characterization of time-dependent systems, such as in the case of polymer sol-gel transitions or cell-mediated extracellular matrix remodeling, both of which we present here.
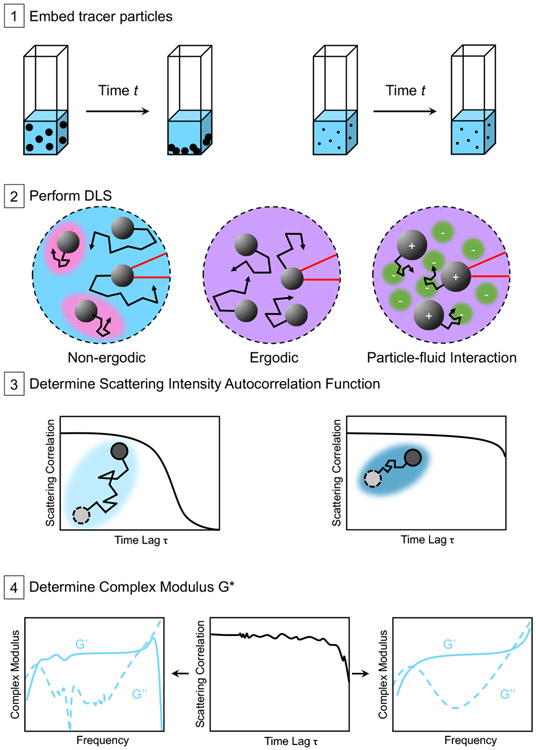
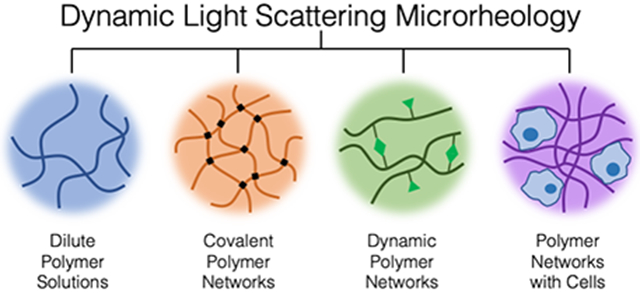
When considering these advantages and limitations together, DLSμR emerges as a particularly useful technique to study the rheology of a wide range of applications including: (1) dilute polymer solutions, (2) covalently linked polymer gels, (3) polymer gels formed via chemically or physically dynamic bonds, and (4) polymeric materials affected by active species (e.g. cells, enzymes). We demonstrate the use of DLSμR for each of the applications listed and highlight key considerations when implementing the technique for each material type (Figure 1).
Fig. 1.
DLSμR Workflow Scenarios Summary. (1) Tracer particles are mixed with the material to be characterized. Larger particles may be subject to sedimentation over measurement time t. (2) The particle and fluid mixture is measured by a DLS instrument, where incident light is scattered by the particles. The collected scattering intensity depends on the particles’ ability to explore the material structure. A particle that is effectively trapped or caged explores only a limited region of the total material space. Such cages (indicated in pink in the Non-ergodic case) could arise from heterogeneity in the material and can be one source of ergodicity breaking.24-29 If different particles are confined within micro-environments that have varying physical properties, their ensemble-averaged displacement will be different from the time-averaged motion of a single particle, resulting in non-ergodic behavior. In contrast, a particle that is not caged can explore the full material space (indicated by the homogeneously purple material in the Ergodic case), resulting in equivalent ensemble-averaged and time-averaged behaviors that is the hallmark of ergodicity. Scattering intensity also depends on possible attractive forces between particles and the fluid (for example, charge interactions), which result in hindered particle movement. (3) The scattering intensity autocorrelation function in different samples indicates the mean-squared displacement of the tracer particles in each material. (4) A frequency-dependent complex modulus can then be determined using a custom analysis package, optimized for minimizing noise introduced during measurement.
2. Theory
Using dynamic light scattering to probe the rheological behavior of complex materials is an established procedure, so this section is only meant to give an overview of the relevant theoretical concepts.11,20-22,30-32 Our approach uses the non-invasive backscatter (NIBS) detection mode, which differs from conventional backscatter and reduces multiple scattering. This method is amenable to much higher particle concentrations due to the ability of NIBS to still operate within the single scattering regime for particle concentrations of 0.1% w/v.20,30,33,34 Such concentrations are much higher than those used at conventional scattering angles, and consequently, the higher probe particle concentration provides greater contrast against the fluid scattering background, enabling measurement of fluids that are opaque.
Incident light is scattered by embedded probe particles in a sample volume, and the scattering intensity is measured over time to derive the intensity autocorrelation function g2(τ) = ⟨I(t)I(t + τ)⟩⟨I(t)⟩−2, where τ is the lag time between two time points and ⟨I(t)⟩−2 is the normalization factor. This autocorrelation function relates to the mean-squared displacement Δr2 (τ) of the probe particles through the intermediate scattering function
| (1) |
where the scattering vector q = 4πnsin(θ/2)/λ. The intermediate scattering function g1 (τ) for ergodic systems is derived from
| (2) |
where g0 = g2(0). From the mean-squared displacement, we then obtain the frequency-dependent complex modulus using the generalized Stokes-Einstein equation21,22
| (3) |
where kBT denotes the thermal energy, a is the particle radius, and is the unilateral Fourier transform of the mean-squared displacement. This relation is extended from the purely viscous regime to continuum viscoelastic fluids and connects macroscopic stress relaxations to microscopic stress relaxations.23,35 Besides the complex modulus, another interesting and valuable interpretation of the mean-squared displacement is the creep compliance, which directly relates to the mean-squared displacement.36 It should be noted that Equation 3 assumes that there is negligible impact from inertia of the probe, which is very sensitive to probe size and material properties of both the probe and the fluid. For a particle in a fluid, the timescale at which inertial effects are non-negligible can be estimated using the ratio of m/ζ = 2ρpa2/9ηs, where m is the mass of the particle, ζ is the drag coefficient, ρp is the density of the particle, a is the radius of the particle, and ηs is the viscosity of the fluid.37 Particle sizes used in DLSμR are on the order of 1 μm, which requires a timescale of ~ 6 × 10⁻⁸ s for the inertia to dampen out in a material with a viscosity of 10−3 Pa·s. Thus, for the frequency range probed by DLSμR (up to 106 Hz), inertial effects can be neglected.22
3. Results and discussion
All data presented here were collected on a commercial benchtop DLS (Malvern Zetasizer Nano ZS), exported from the instrument, and analyzed using our custom software package, which we have made available for download (https://dlsur.readthedocs.io/, see Supplemental Information for documentation). To achieve accurate rheological measurements using DLS microrheology, a number of important control experiments and protocol checks should be performed. Depending on the material type, the relative likelihood for different sources of experimental error to occur will be different. In the following sections, we describe the use of DLS microrheology to obtain reliable viscoelastic data from a variety of materials types, with a focus on the specific experimental considerations that influence results of that respective material type.
3.1. Polymer Solutions
For polymers in solution at a concentration far below the overlap concentration, the resulting fluid is often more viscous than elastic. In such dilute regimes, the probe particles interact mostly with solvent. This introduces two concerns: the possibility that the particles could settle out of the solution and the possibility that the particle movement becomes decorrelated too quickly.8 In the first case, particle settling weakens the signal from the probes to the detected scattering intensity, altering the source and shape of the scatterers. In the second case, a particle in purely viscous or mostly viscous fluid very quickly takes on random motion, and the time when particle movement becomes completely decorrelated defines the limit for the frequency range in which the material behavior can be probed (see Figure 1).
A commonly used probe material for dynamic light scattering measurements is polystyrene, which can form microspheres that change a clear fluid into an opaque shade when suspended and well dispersed in the medium. When polystyrene microparticles settle out of the fluid, the fluid clarity returns, allowing one to visually detect settling. According to Stokes’ law, smaller particles will settle out slower due to a lower settling velocity, which decreases quadratically with particle diameter. For example, gold nanoparticles with a diameter of less than 90 nm stay suspended in water for a duration of 3 days.38
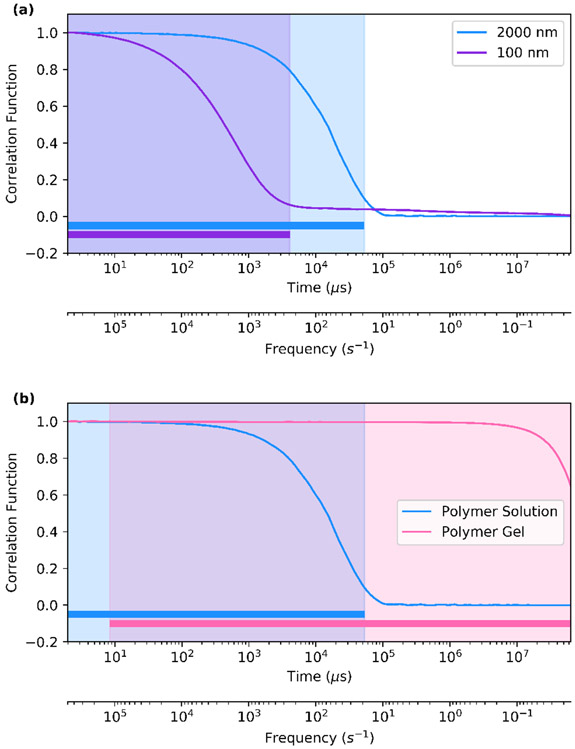
Due to this increased effect of Brownian dynamics for smaller particle sizes, the particle movement will decorrelate more quickly as particle size decreases. This can be observed in the autocorrelation data from a DLS microrheology experiment. For example, for a dilute solution of high molecular weight hyaluronic acid, a smaller 100-nm diameter particle exhibits a correlation function that decreases to zero more quickly than a larger 2000-nm diameter particle (Figure 2a). The range of time in which the correlation function is non-zero dictates the range of frequencies over which the complex modulus can be determined (this frequency regime is denoted by the bars at the bottom). Importantly, the correlation function must experience a minimum amount of decrease in order to obtain rheological data (though not obvious in Figure 2b, the polymer gel does begin to exhibit a very gradual decrease beginning after 8 μs as shown in Figure S2). One strategy to extend the range of frequencies over which the correlation function is not zero but decreases enough to allow for the measurement of the complex modulus is to use particles of different diameters.39,40 Additionally, the applicability of the generalized Stokes-Einstein equation (Equation 3) rests on the validity of the continuum assumption for the probe particle size in relation to the mesh size or other network size that is relevant to the rheology. In all cases, it is important for the particle diameter to be above the mesh size of the polymer, otherwise the particle will only probe the solvent rheology. We note, however, that there are materials that require more specific tuning of the particle size to determine the bulk viscoelasticity rather than simply the local viscoelasticity, such as in the case of F-actin.11,41 Thus, accurate measurement of dilute polymer solutions requires balancing of several different factors: the need to use particles large enough to both probe the polymer viscoelasticity and maximize the frequency range of measurement yet small enough to remain in suspension for the duration of the measurement.8,11,14,35,42-44 In this work, the particle size used for each material was significantly larger than the material mesh size and could probe the bulk viscoelasticity.
| (4) |
where K(t) is the memory kernel that encapsulates how the force exerted by the fluid on the probe particle at time t depends on the particle’s trajectory up to time t, is the gravitational force on the bead, and is the Brownian force.45-48 The Brownian force satisfies the fluctuation dissipation theorem
| (5) |
which dictates how the Brownian force is related to the frictional force on the bead.
Fig. 2.
Comparison of the Correlation Functions for Different Materials. The correlation function shown here is the baseline subtracted and normalized intensity correlation function. (a) The correlation function corresponding to two different probe sizes in a 0.5 wt% solution of 700 kDa hyaluronic acid. The 2000-nm diameter particle exhibits a longer range of correlated motion than the 100-nm diameter particle, which results in a wider frequency range where the complex modulus can be found as denoted by the shaded region and solid bars at the bottom of the plot. (b) The correlation function corresponding to two different materials, where the polymer solution is a 0.5 wt% solution of 700 kDa hyaluronic acid and the polymer gel is a 5 wt% gel formed from 20 kDa 8-arm poly(ethylene glycol) crosslinked via thiol-vinylsulfone bonds.
By using the Laplace transform and setting t = t′, we arrive at a mean-squared displacement of the particle
| (6) |
where the first term represents the contribution from diffusion and the second term represents the contribution from sedimentation. When the magnitude of the diffusion contribution is equivalent to the magnitude of the sedimentation contribution, sedimentation begins to impact the rheological behavior, and this marks the lower limit of the frequency range of the rheological measurement. Setting the two contributions equal to each other and using analytical continuation s = iω, we arrive at an expression for the complex modulus at the limiting frequency of measurement ,
| (7) |
where f0 = (ρparticle – ρfluid)gVparticle, kB is the Boltzmann constant, T is the temperature of the experiment, and r is the radius of the particle. Another metric that compares the contributions of sedimentation and diffusion is the gravitational Peclet number, which gives the ratio of the timescales for a particle to sediment and to diffuse a given distance.8,49 The advantage of the analysis performed above is that it gives a timescale at which sedimentation dominates transport whereas the Peclet number does not.
In the case of the 100-nm diameter polystyrene particles suspended in a 0.5 wt% hyaluronic acid solution, we find that the fluid density ρfluid and the particle density are 1.004 g/mL and 1.05 g/mL, respectively. Using these values, we find that the sedimentation contribution is roughly 5.48 × 10−38 kg2 · m2/s4. Comparing this to the diffusion contribution 12kBTr ≈ 2.57 × 10⁻²⁷ kg · m3/s2, we see that the lower bound for the frequency range is where the complex modulus is roughly 2.14 × 10⁻¹¹ Pa. This value is very low, indicating that the time it would take for the particle to sediment out of the solution and impact a rheological measurement is orders of magnitude greater than the time needed for a rheological measurement (on the order of 30 minutes). Thus, for small particles like the 100-nm diameter polystyrene particles, sedimentation is not the limiting factor, but rather the correlation time range of the particles is (Figure 2a). On the other hand, as particle size increases, sedimentation very quickly plays a role in the limitations of the frequency range, since the complex modulus where the lower bound of the frequency occurs scales with the radius of the particle as .
3.2. Covalently Linked Polymer Networks
Polymer networks can generically be classified as either physical networks (i.e. formed by reversible, physical bonds) or chemical networks (i.e. formed by irreversible, covalent bonds).50-52 Chemical gels are often formed through covalent, crosslinking reactions. To measure the rheology of covalent networks with DLSμR, probe particles must be embedded in the precursor solutions prior to gelation in order to uniformly disperse the particles in the final gel. Dispersion of particles is critical for the analysis process. An aggregate of particles will have a different diameter than a single particle, impacting the radius used in Equation 3 and giving an erroneous magnitude for the complex modulus.12 In addition to requiring a good dispersion of particles, hydrogels also require careful selection of the particle size and surface chemistry, as described further in section III.
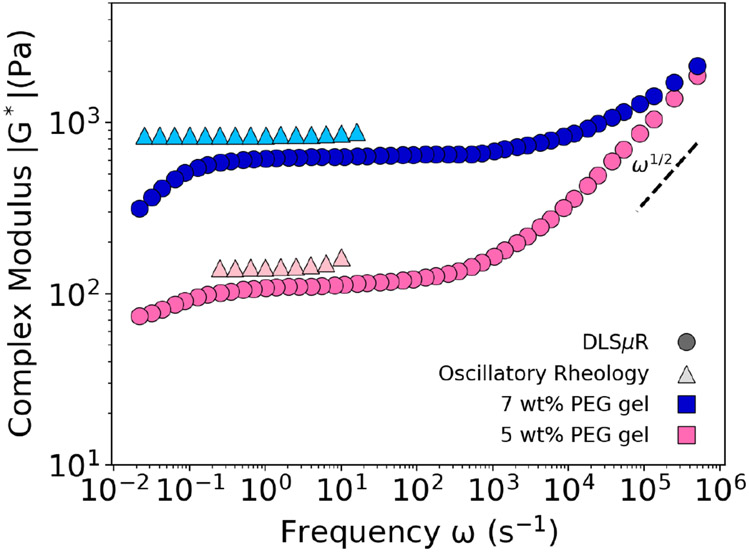
When possible, one verification method is to measure the rheology of the covalently-crosslinked gel using oscillatory shear rheology. It was previously reported that microrheology techniques will significantly underestimate the value of the viscoelastic modulus compared to macrorheology.53 However, we found reasonable agreement between DLSμR and oscillatory shear rheology for poly(ethylene glycol) (PEG) gels formed using thiol-vinylsulfone bonds in the low frequency regime. For example, Figure 3 shows results comparing DLSμR with macrorheology, which exhibits a slightly higher modulus by a factor of ~1.4. Notably, inertial effects limit the oscillatory rheometer from determining the viscoelastic modulus at high frequencies.
Fig. 3.
Comparison of Rheological Measurements Collected via DLSμR and Oscillatory Shear Rheology. The rheology of two different concentrations of polymer gels composed of 20 kDa 8-arm poly(ethylene glycol) formed via thiol-vinylsulfone bonds were measured using both DLSμR and oscillatory shear rheology.
Above the sol-gel transition, covalently linked polymer networks exhibit strongly elastic behavior. The elasticity of the gel keeps probe particles localized near fixed average positions within the gel, limiting the subspaces explored via Brownian motion in a single measurement. Such localization in gels is an example of where the ergodicity assumption in Equation 2 breaks down due to the time-averaged scattering intensity being no longer equal to the ensemble-averaged scattering intensity (Figure 1).54 To obtain the scattering intensity for all subspaces of the gel, one would need to determine the intensity correlation function over all possible spatial positions. Due to the time-consuming nature of this experiment, we use an alternative method that extracts the intermediate scattering function by performing both (i) a long time range measurement at a single position to obtain the time-averaged scattering intensity and (ii) a series of measurements over a small range of measurement positions to obtain the ensemble-averaged scattering intensity. The ratio of the ensemble-averaged scattering intensity to the time-averaged scattering intensity (taken at the measurement position where the correlation function is collected) Y = ⟨I⟩e/⟨I⟩t is used to determine the intermediate scattering function.
| (8) |
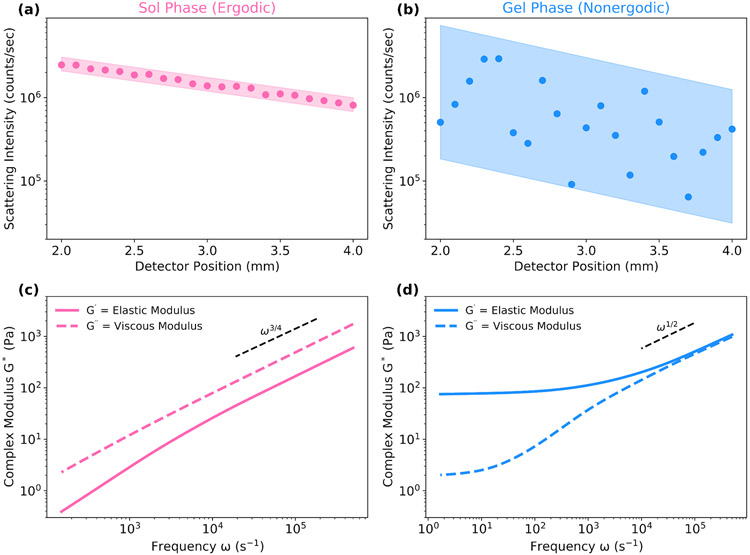
Determining whether a sample represents an ergodic or non-ergodic medium is important for obtaining the correct rheology. Ergodic and non-ergodic samples exhibit different scattering intensity as a function of spatial position from the detector, making it simple to determine if a specific sample is ergodic. For an ergodic sample, the scattering intensity varies exponentially with position g(2) ~ exp(r), but in a non-ergodic sample, this relationship is less defined due to the localized movement of particles (Figure 4). Using the wrong assumption (and thus the wrong equation to derive the intermediate scattering function) will result in a complex modulus that is lower by a significant factor (see Supplemental Information, Figure S1).
Fig. 4.
Ergodic and Non-ergodic Materials Exhibit Different Scattering Intensity Dependence on Detector Position. The scattering intensity and rheological profile from DLSμR are shown for poly(ethylene glycol) solutions and gels formed with thiol-vinylsulfone bonds at two concentrations: 3 wt% and 5 wt%, below and above the sol-gel transition, respectively. The scattering intensity as a function of position from the detector is shown for (a) the ergodic, sol phase and (b) the non-ergodic, gel phase. Complex moduli are also shown for (c) the ergodic, sol phase and (b) the non-ergodic, gel phase.
As with any technique, there are limitations to DLSμR. For gels with elastic moduli (G’) greater than 104 Pa, DLS microrheology is limited in its ability to capture the viscoelastic behavior in the full frequency range. Probe particles in highly elastic materials exhibit less discernible displacements. When the magnitude of the displacements is small enough, the fluctuations cannot be fully captured by the intensity correlation function, resulting in a flat correlation function, as observed in Figure 2b for time t < 7μs (Figure S2). An additional limitation is the precision of the exported data from the instrument, which is limited to three significant figures for the Malvern Zetasizer Nano ZS used in our measurements. Any changes in the intensity correlation function smaller than 0.001 are also not captured and will result in a flat correlation function. The time before which the correlation function remains flat is the upper limit of the frequency range in which the viscoelastic modulus can be determined (denoted by the solid colored bars at the bottom of the plot in Figure 2b). Further discussion on the effect of varying particle size and particle-fluid interactions can be found in the following section.
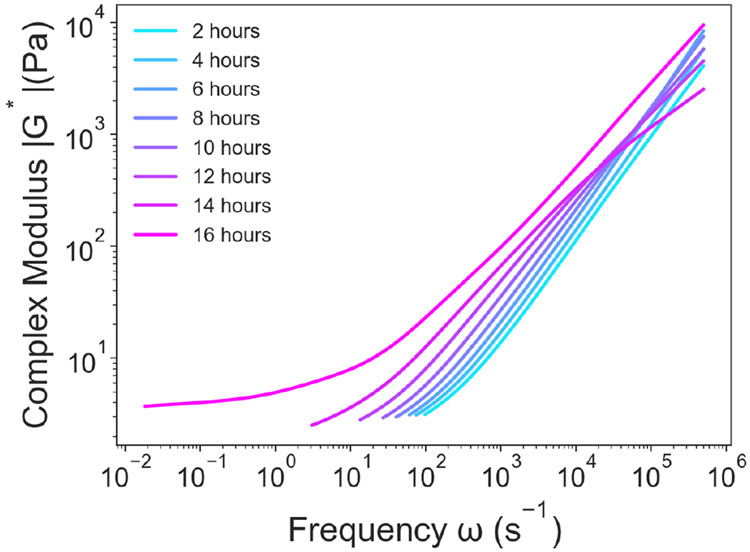
One common property of covalently crosslinked hydrogels that is measured is the gelation time. Knowledge of the kinetics for a material to transition from the sol to the gel phase is useful in a variety of applications. For a sufficiently long gelation process, DLSμR can produce transient frequency-dependent complex moduli across multiple decades in time to determine the gelation point. The playlist feature of the Zetasizer software allows for automatic sequential measurements, which can be easily analyzed using a function in our custom software package (see Supplemental Information, Tables S1 and S2).
One example of a long gelation process is the formation of a gel between 20 kDa 4-arm PEG-maleimide and 20 kDa 4-arm PEG-methylfuran. It was previously reported using oscillatory shear rheology that such a mixture at a concentration of 50 mg/mL would take ~ 16 hours to reach an equilibrium gel state.55 In Figure 5, the same gel was characterized using DLSμR using a tracer particle size of 500 nm, and the time for the polymer solution to reach an equilibrium gel was found to be ~ 16 hours. The agreement found between the complex moduli determined using DLSμR and macrorheology not only verifies that DLSμR can accurately measure gelation kinetics for covalently crosslinked networks but also is consistent with previously found capabilities of other microrheology techniques.56-59 In other instances, the loss tangent (defined as G″/G′) is also used to examine the gelation point.57
Fig. 5.
Gelation Process of a Covalently Crosslinked PEG-based Gel. DLSμR was used to characterize the time-dependent gelation process of a gel composed of 20 kDa 4-arm PEG-maleimide and 20 kDa 4-arm PEG-methylfuran at a concentration of 50 mg/mL. The complex modulus was measured continuously to determine when the sol-gel transition occurs.
Lastly, DLSμR may require a measurement duration longer than the longest relaxation time of interest, which can be too long compared to the timescale of systematic changes in the rheology. We have found that 10 minutes for scattering collection provides a sufficient amount of time to capture the full range of accessible frequencies for a variety of materials, so materials that gel on the order of 30 minutes would not be well suited for time-dependent measurements using DLSμR.
3.3. Polymer Gels Formed via Dynamic Bonds
Polymer gels formed via dynamic bonds display many similar characteristics to covalently bonded networks, and similar considerations must be applied in these materials as in covalent networks. One such decision is the size and surface chemistry of probe particles used for DLSμR. As with polymer solutions, the size of the probe particle can influence the frequency range in which the complex modulus may be determined. With polymer networks, there is the additional consideration of the mesh size of the network in determining the suitable particle size. Using a probe that is larger than the mesh size will allow the particle to fully experience the elastic stresses of the network and probe its viscoelasticity.
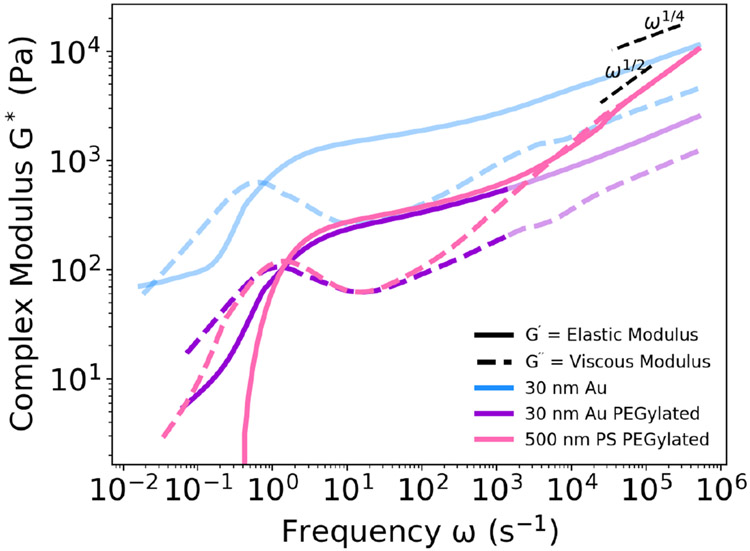
To evaluate the use of DLSμR for rheological analysis of gels formed via dynamic bonds, we prepared a material with 40 kDa hyaluronic acid that crosslinks through dynamic guest-host interactions (see Supplemental Information for synthesis procedure and NMR characterization, Figures S3 and S4). This dynamic polymer network was previously reported to have an average mesh size of ~ 3.4 nm.60,61 Thus, a gold nanoparticle with a 30 nm diameter was selected to probe the viscoelasticity of the network. Unlike covalently bonded networks, the dynamic guest-host bonds have an association time, making the bonds reversible rather than permanent. When bonds break, this can change the effective mesh size, altering the calculation for finding the optimal probe diameter. If a particle is smaller than the mesh size, particles tend to undergo Brownian motion as though diffusing through the solvent, resulting in a rheological profile more similar to a viscous liquid than a viscoelastic network. In the case of the gold nanoparticle, we clearly see a plateau in the elastic modulus, which is characteristic of a viscoelastic gel, demonstrating that a 30-nm diameter particle is larger than the effective mesh size for this system (Figure 6). Embedded probe particles can be hindered in their diffusion by interactions with the fluid (Figure 1). These interactions are often electrostatic in nature and can cause increased adhesion between the particle and the fluid, leading to less mobility. Even for particles with the same surface charge as the polymer, diffusion of the particles can sometimes be hindered if the size of the polymer is comparable to the Debye length.62 For a charged species, the best way to probe the material is to use a probe particle with neutral or very weak surface charge.63
Fig. 6.
Electrostatic forces between the gold (Au) nanoparticles and the sample results in inaccurate rheology (light blue). Adding a poly(ethylene glycol) brush to the Au nanoparticles (Au PEGylated) can partially minimize electrostatic interactions, resulting in accurate measurements at intermediate frequencies (bold purple) and inaccurate measurements at high frequencies (light purple). Use of polystyrene nanoparticles with a poly(ethylene glycol) brush (PS PEGylated) results in accurate rheology over the full frequency range (bold pink). When particle size is significantly larger than the sample mesh size, particles of different sizes give similar rheological results.
One method to detect possible particle-polymer interactions is to examine the scaling behavior of the rheological profile. At high frequencies, polymer behavior is theoretically dominated either by the interactions between monomers for highly concentrated polymers, such as in a Rouse model with scaling ω1/2, or by hydrodynamic interactions between monomer and solvent for dilute and semidilute polymer solutions, such as in a Zimm model with scaling ω2/3.37 However, when examining the rheological profile of the guest-host hyaluronic acid hydrogel using gold nanoparticles, we observe scaling in the high frequency regime of ~ ω1/4, which is lower than the theoretical scaling typically expected for polymer chains over that frequency range (Figure 6). The lower scaling indicates more hindered particle movement, suggesting that interactions between particles and polymer are present and the resulting rheological profile is not indicative of the physical behavior of the polymer network. Another sign of particle-fluid interaction is that the smaller gold particle sensed a stiffer environment, as indicated by the higher complex moduli, than the larger polystyrene particle (Figure 6). Unless there is interaction between the particle and the polymer, we should either expect the smaller particle to produce the same rheological profile or a more viscous profile if the particle is much smaller than the network mesh size. Hyaluronic acid is a polymer with a net negative charge, so a particle with a positive surface charge, such as these gold particles, may experience electrostatic interactions with the polymer. One commonly employed strategy to avoid such interactions is to functionalize the exterior of the particle with a PEG brush.62 After conjugating a PEG brush to the exterior of both polystyrene and gold particles, the complex moduli of both particles not only align in the frequency range until ~ 103s−1 but also are lower than that measured for a gold particle with no PEGylation (Figure 6). Together, these data show that the PEG brush could successfully disrupt the particle-polymer interactions and enable accurate rheological characterization up until the high frequency regime (accurate rheology shown with bolder line and inaccurate rheology shown with lighter line). The scaling behavior of the polystyrene particle in the high frequency follows the expected scaling of a Rouse polymer, deviating from the scaling of the PEGylated gold nanoparticle (Figure 6). However, while in this instance the polystyrene particle is the most suitable choice for performing microrheology, the size of the gold nanoparticles could be more advantageous in other materials where the impact of any inherent gold-specific interactions are negligible.
A concern for certain materials with high refractive indices is the relative contribution to the scattering intensity from the sample and the probe particles. Scattering intensity that is derived mostly from the material in many cases cannot result in an accurate rheological profile due to the unknown size of the material (a in Equation 3). In some instances, where the material serves as the scatterer, this can be achieved, provided the scattering source is sufficiently characterizable and monodisperse.21,22 An effective test to determine the major contributor to the scattering intensity is to perform a measurement on the same material with two different probe particle sizes (such as 30 nm and 500 nm). If both particles are above the mesh size of the polymer network and the scattering intensity is a result of the probe particles, then the rheological profile measured using both particles should be the same. Indeed, when both particles are PEGylated, these two different particle sizes produce the same magnitude for the complex modulus in the low to middle frequency range (Figure 6).
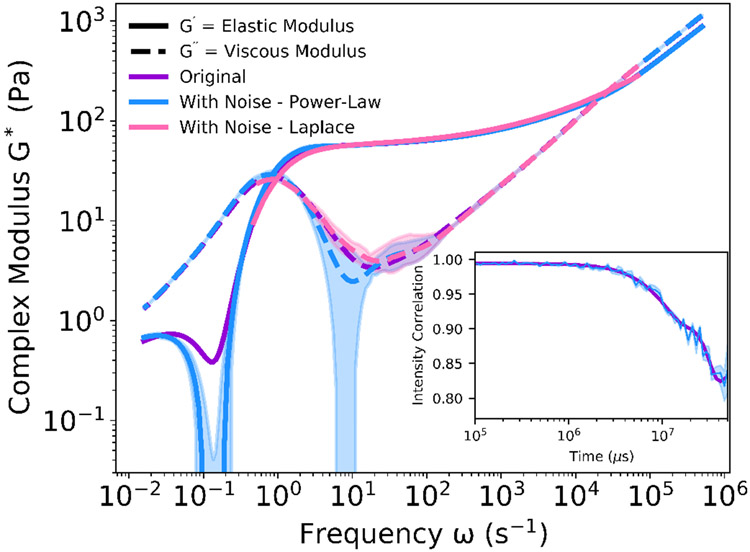
As seen in Equation 3, the complex modulus is determined by taking the Fourier transform of the mean-squared displacement of the probe particle. To compute the Fourier transformed complex modulus, one method is to use a power-law analysis on the mean-squared displacement and approximate the Fourier transform of the mean-squared displacement by finding the analytical Fourier transform of the fitted power-law,64 such that
| (9) |
This power-law analysis uses this approximate Fourier transform at each frequency to stitch together the complex modulus over the entire frequency range of measurement. By using this approximation, this method has the advantage of not needing to evaluate the numerical Fourier transform, which can be tedious and complicated to perform. However, due to the dependence of the approximation on the local slope of the mean-squared displacement, the power-law method results in a complex modulus that is strongly subject to the noise present in the correlation function. For cases where noise is present, an alternative methodology is to take the direct Laplace transform of the mean-squared displacement by using analytical continuation iω = s and .22
| (10) |
Details of both methods are provided in the Supplemental Information. The presence of noise is particularly significant to the complex modulus in gels, where the magnitude of the viscous modulus G″ is much less than the elastic modulus G′ in the elastic plateau regime. The small magnitude of the viscous modulus means that even relatively small changes in the local slope of the mean-squared displacement can have a larger impact on the computed viscous modulus, resulting in “bumps” or other irregularities in the curve (blue curve in Figure 7).
Fig. 7.
Comparison of Two Evaluation Methods of the Complex Modulus. The complex modulus was determined for the smooth intensity correlation function measured from a sample of collagen I solution (purple). Gaussian distributed noise was applied to a smooth intensity correlation function exported from the DLS (inset). The noise-modified intensity correlation function was evaluated using either the power-law method (blue) or the direct Laplace transform method (pink) of the mean-squared displacement. While the smooth intensity correlation function resulted in the same complex modulus using both methods, the noise introduced is handled better in the direct Laplace transform method over the interior frequencies. Opaque regions indicate one standard deviation from the mean, n = 3.
To demonstrate how these two methods can yield different results, we first selected a smooth intensity correlation function (inset, purple line) and performed the analysis using both methods, resulting in the purple lines in Figure 7. As expected, both methods produced the same computed complex moduli for this smooth autocorrelation function. Next, Gaussian-distributed noise was artificially introduced to the correlation function to simulate the effects of vibrations or other sources of experimental noise. The complex moduli were again determined by both methods. Because the direct Laplace transform method (pink line) bypasses the susceptibility to the local slope of the mean-squared displacement, it resulted in a more consistently smooth rheology profile compared to the power-law transform method (blue line) over the interior frequency range. However, due to the calculation methodology, the direct Laplace transform method in the low and high frequency ranges (where the pink line is absent) yield inaccurate results, so replacing those regions with the result of the power-law method is preferred.
3.4. Materials with Active or Biologically Complex Components
The nondestructive nature and small sample size of DLSμR allows rheological measurements of materials outside the traditional realm of polymer solutions and gels. Of particular interest for biologists and biophysicists is the applicability of this technique to study active processes, such as enzyme-driven polymer changes or cell-mediated extracellular matrix remodeling.65
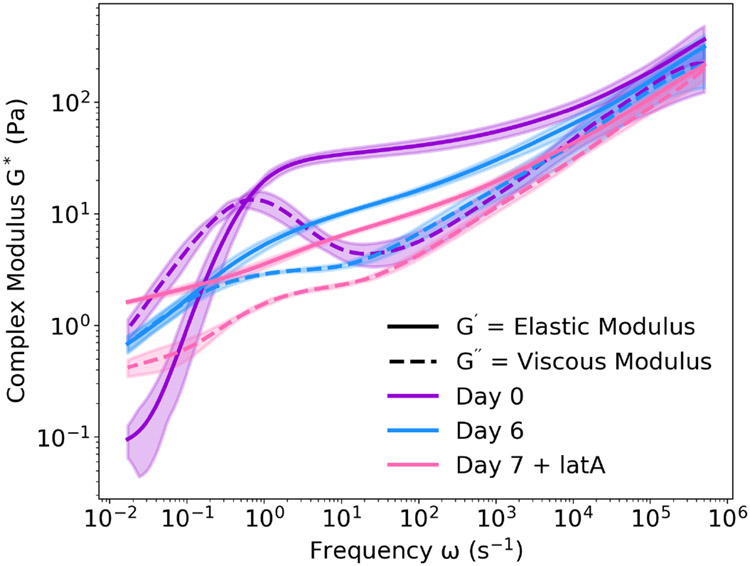
As an example, we encapsulated MDA-MB-231 human epithelial breast cancer cells in an extracellular matrix composed of collagen I, as it has been shown previously that collagen matrices induce an invasive phenotype in mammary epithelial cells.66 The rheology of this living composite material was probed over the course of six days using embedded polystyrene microspheres, after which the modulus exhibited more viscous (liquid-like) behavior (Figure 8). This decrease in the elasticity of the composite material is expected, as these cells are known to express matrix metalloproteinases (MMPs) that enzymatically degrade collagen.67 As further confirmation that cells were responsible for these changes in rheology, we also performed DLSμR on a collagen matrix without cells over time (Figure S5). Compared to collagen alone, the decrease in elasticity was much more significant with the cells present. To further analyze the contribution of the cellular component to the rheological properties of this living composite material, we added latrunculin A, which disrupts actin assembly in the cellular cytoskeleton. This disruption of the intracellular network results in a composite material that is even more viscous (Figure 8). These data demonstrate the extent to which the living cells contributed to the physical properties of the overall composite material.
Fig. 8.
Multi-day Rheology of a Living Composite of Human Breast Cancer Cells Encapsulated in Collagen I. MDA-MB-231 cells encapsulated in a collagen I extracellular matrix were observed over seven days. DLSμR of the composite cell-collagen material was performed using embedded polystyrene microspheres, and the rheology was found to change over the course of the week. Upon disruption of intracellular cytoskeleton polymers using latrunculin A, the modulus of the composite material further decreased, indicating that the living cells directly influence rheological behavior. Opaque regions indicate one standard deviation from the mean, n = 3.
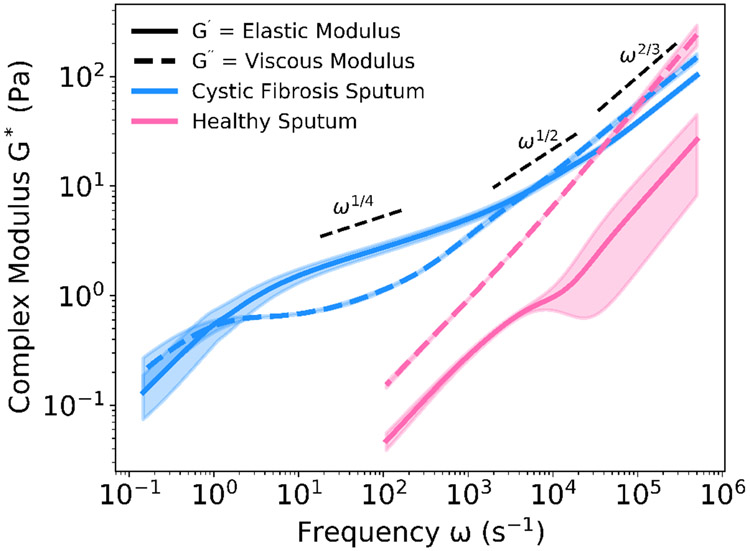
For researchers dealing with precious, biological fluids, such as patient-derived mucus, the small volume required for and the nondestructive nature of DLSμR are particularly attractive qualities. In the case of cystic fibrosis sputum, the rheology has been tied to the disease state, where sputum in patients with cystic fibrosis exhibits higher viscoelasticity due to lower hydration levels and increased biopolymer concentration.6,7,68 A comparison of a sputum sample from a patient with cystic fibrosis and an induced sputum collection from a healthy subject clearly demonstrates the increased viscoelasticity in the case of cystic fibrosis (Figure 9). All patient samples were collected following protocols approved by the Stanford Institutional Review Board (protocol #IRB-37232).
Fig. 9.
Rheological Comparison of Cystic Fibrosis and Healthy Sputum. Samples of expectorated sputum from a patient with cystic fibrosis and a healthy subject were measured using DLSμR. The range of frequencies over which the healthy sputum was able to be measured is limited by the fast decorrelation of particle movement within the liquid-like sample. The complex modulus of the healthy sputum is lower than that of the cystic fibrosis sputum. Opaque regions indicate one standard deviation from the mean, n = 3.
For the sputum sample from a healthy subject, both the slope of the viscous modulus, which is almost 1, and the magnitude of the viscous modulus, which is greater than the elastic modulus for the entire frequency range seen here, suggest that the sputum sample is Theologically similar to water. In the case of the patient with cystic fibrosis, the availability of rheological data in the higher frequencies (ω > 102 s−1) enabled by DLSμR allows us to see that the elastic plateau region is not flat over the frequency range of ω ~ 10 – 1000 s−1. For a homogeneous, semidilute polymer solution governed by entanglement effects, the plateau modulus, or the value of the modulus between the relaxation time of an entanglement strand τe and the relaxation time of the “confining tube” τd, is typically constant with a flat slope, reflecting the single relaxation process of the polymer disengaging from its “confinement tube”.37 In contrast, for the cystic fibrosis sputum, the elastic modulus exhibits a scaling ~ ω1/4, which suggests that the relaxation of the elastic modes is a more complex superposition of multiple relaxation processes associated with each biopolymer present. Additionally, we see that at even higher frequencies beyond the elastic plateau, cystic fibrosis sputum exhibits the characteristic Rouse-model scaling of ω1/2 associated with unentangled polymer solutions and Zimm-model scaling of ω2/3 associated with dilute polymer solutions whose short-range behavior is dictated by hydrodynamic interactions. Such a progression of scaling factors is characteristic of a dilute solution of polymer chains, suggesting that the physical behavior of sputum is governed by the dynamics of the biopolymers present.
4. Conclusions
DLSμR is a micro rheology technique applicable to a broad range of applications due to its many advantages, including requiring only 12 μL of sample and measuring up to six decades in time. Although the passive nature of the technique limits measurements of nonlinear effects, the nondestructive nature allows users to observe changes in the material over long periods of time, such as in the case of experiments involving cells. Combining this advantage with the programmable software of the DLS instrument, DLSμR can be leveraged to measure and characterize longer time-dependent processes, such as gelation kinetics for the sol-gel transition in polymer networks. The nondestructive nature of DLSμR is especially advantageous for analysis of delicate materials, such as cells, that may be irreversibly damaged by application of shear rheology.
Currently, the DLS instrument used to demonstrate this technique is capable of performing one measurement on a cuvette containing a single sample of interest. In the future, use of a 96-well plate DLS instrument would enable implementation of DLSμR in a higher-throughput capacity. This would allow automated measurement of several samples, making characterization of new formulations of materials more efficient. Another future direction for further DLSμR development would be techniques to enable spatial resolution within a single sample. Especially for many biological samples, microrheology methods with spatial resolution, such as optical tweezers or atomic force microscopy, provide critical information about heterogeneity and spatial patterning.69 Integration of DLSμR with microscopy methods may address this challenge in the future.
We have shown here the critical steps in implementing this technique for the characterization of several different classes of soft matter, each of which has its own specific considerations. For polymer solutions, there is a lower limit to the range of frequencies over which DLS can probe. For polymer gels, there is an upper limit to the stiffness that is measurable by the DLS instrument. For all types of materials, interactions between the probe and the material must be considered in order to ensure that the motion of the particle is Brownian. Despite these potential challenges, the technique is easy to setup as it leverages a commercial benchtop DLS instrument that is often already available to most soft matter researchers. This paper aims to guide potential users of the technique through the main issues when beginning to use DLSμR on new materials and make the technique more approachable for nontraditional rheologists, including providing our custom analysis package for the data analysis and related documentation explaining the steps of the analysis (https://dlsur.readthedocs.io/). Given the range of stiffnesses measurable using DLSμR and advantages over other microrheology techniques, DLSμR is especially well-suited for the soft matter community as a simple technique to perform rheological analysis.
5. Materials and methods
Detailed experimental materials and methods are provided in the Electronic Supplementary Information (ESI).
Supplementary Material
Acknowledgements
The authors are grateful to the CF research team and patients at Stanford, who made the rheological measurements of CF sputum possible. The authors thank Dr. Christopher Madl for providing reagents for rheological measurements. The authors thank Dr. Michelle Vitolo for providing the kind gift of MDA-MB-231 cells. The authors acknowledge funding from the National Science Foundation Graduate Research Fellowship Program (P.C.C.), the Stanford Bio-X Fellowship Program (P.C.C., B.A.K.), the Francis Family Foundation (E.B.B.), the Cystic Fibrosis Foundation (E.B.B., C.E.M.), and the Ross Mosier Laboratories Gift Fund (E.B.B., C.E.M.). We acknowledge support from the National Institutes of Health (R21 HL138042, R01 EB027666, R01 HL151997, R01 EB027171, S.C.H.).
Footnotes
Electronic supplementary information (ESI) available. See DOI: 10.1039/d0sm01597k.
Conflicts of interest
There are no conflicts to declare.
Notes and references
- 1.Ng JM, Gitlin I, Stroock AD and Whitesides GM, Electrophoresis, 2002, 23, 3461–3473. [DOI] [PubMed] [Google Scholar]
- 2.Appel EA, Forster RA, Rowland MJ and Scherman OA, Biomaterials, 2014, 35, 9897–9903. [DOI] [PubMed] [Google Scholar]
- 3.Marquardt LM, Doulames VM, Wang AT, Dubbin K, Suhar RA, Kratochvil MJ, Medress ZA, Plant GW and Heilshorn SC, Science Advances, 2020, 6, eaaz1039. [DOI] [PMC free article] [PubMed] [Google Scholar]
- 4.Foo CTWP, Lee JS, Mulyasasmita W, Parisi-Amon A and Heilshorn SC, Proceedings of the National Academy of Sciences, 2009, 106, 22067–22072. [DOI] [PMC free article] [PubMed] [Google Scholar]
- 5.Oh JY, Rondeau-Gagné S, Chiu Y-C, Chortos A, Lissel F, Wang G-JN, Schroeder BC, Kurosawa T, Lopez J, Katsumata T et al. , Nature, 2016, 539, 411–415. [DOI] [PubMed] [Google Scholar]
- 6.Lai SK, Wang Y-Y, Wirtz D and Hanes J, Advanced Drug Delivery Reviews, 2009, 61, 86–100. [DOI] [PMC free article] [PubMed] [Google Scholar]
- 7.Fahy JV and Dickey BF, New England Journal of Medicine, 2010, 363, 2233–2247. [DOI] [PMC free article] [PubMed] [Google Scholar]
- 8.Furst EM and Squires TM, Microrheology, Oxford University Press, 2017. [Google Scholar]
- 9.Pesce G, De Luca A, Rusciano G, Netti P, Fusco S and Sasso A, Journal of Optics A: Pure and Applied Optics, 2009, 11, 034016. [Google Scholar]
- 10.Crocker JC, Valentine MT, Weeks ER, Gisler T, Kaplan PD, Yodh AG and Weitz DA, Physical Review Letters, 2000, 85, 888. [DOI] [PubMed] [Google Scholar]
- 11.Squires TM and Mason TG, Annual Review of Fluid Mechanics, 2010, 42, 413–438. [Google Scholar]
- 12.Mason TG, Ganesan K, van Zanten JH, Wirtz D and Kuo SC, Physical Review Letters, 1997, 79, 3282. [Google Scholar]
- 13.Schultz KM and Furst EM, Soft Matter, 2012, 8, 6198–6205. [Google Scholar]
- 14.Waigh TA, Reports on Progress in Physics, 2005, 68, 685. [Google Scholar]
- 15.Pawelzyk P, Mücke N, Herrmann H and Willenbacher N, PloS One, 2014, 9, e93194. [DOI] [PMC free article] [PubMed] [Google Scholar]
- 16.Nagy-Smith K, Beltramo PJ, Moore E, Tycko R, Furst EM and Schneider JP, ACS Central Science, 2017, 3, 586–597. [DOI] [PMC free article] [PubMed] [Google Scholar]
- 17.Alam MM and Mezzenga R, Langmuir, 2011, 27, 6171–6178. [DOI] [PubMed] [Google Scholar]
- 18.Martiel I, Sagalowicz L and Mezzenga R, Langmuir, 2014, 30, 10751–10759. [DOI] [PubMed] [Google Scholar]
- 19.Edera P, Bergamini D, Trappe V, Giavazzi F and Cerbino R, Physical Review Materials, 2017, 1, 073804. [Google Scholar]
- 20.Krajina BA, Tropini C, Zhu A, DiGiacomo P, Sonnenburg JL, Heilshorn SC and Spakowitz AJ, ACS Central Science, 2017, 3, 1294–1303. [DOI] [PMC free article] [PubMed] [Google Scholar]
- 21.Mason TG and Weitz DA, Physical Review Letters, 1995, 74, 1250. [DOI] [PubMed] [Google Scholar]
- 22.Mason T, Gang H and Weitz D, Journal of Molecular Structure, 1996, 383, 81–90. [Google Scholar]
- 23.Zia RN, Annual Review of Fluid Mechanics, 2018, 50, 371–405. [DOI] [PMC free article] [PubMed] [Google Scholar]
- 24.Manzo C and Garcia-Parajo MF, Reports on Progress in Physics, 2015, 78, 124601. [DOI] [PubMed] [Google Scholar]
- 25.Manzo C, Torreno-Pina JA, Massignan P, Lapeyre GJ Jr, Lewenstein M and Parajo MFG, Physical Review X, 2015, 5, 011021. [DOI] [PubMed] [Google Scholar]
- 26.Jeon J-H, Tejedor V, Burov S, Barkai E, Selhuber-Unkel C, Berg-Sørensen K, Oddershede L and Metzler R, Physical Review Letters, 2011, 106, 048103. [DOI] [PubMed] [Google Scholar]
- 27.Tabei SA, Burov S, Kim HY, Kuznetsov A, Huynh T, Jureller J, Philipson LH, Dinner AR and Scherer NF, Proceedings of the National Academy of Sciences, 2013, 110, 4911–4916. [DOI] [PMC free article] [PubMed] [Google Scholar]
- 28.Weigel AV, Simon B, Tamkun MM and Krapf D, Proceedings of the National Academy of Sciences, 2011, 108, 6438–6443. [DOI] [PMC free article] [PubMed] [Google Scholar]
- 29.Burov S, Jeon J-H, Metzler R and Barkai E, Physical Chemistry Chemical Physics, 2011, 13, 1800–1812. [DOI] [PubMed] [Google Scholar]
- 30.Dasgupta BR, Tee S-Y, Crocker JC, Frisken B and Weitz D, Physical Review E, 2002, 65, 051505. [DOI] [PubMed] [Google Scholar]
- 31.He F, Becker GW, Litowski JR, Narhi LO, Brems DN and Razinkov VI, Analytical Biochemistry, 2010, 399, 141–143. [DOI] [PubMed] [Google Scholar]
- 32.Garting T and Stradner A, Small, 2018, 14, 1801548. [DOI] [PubMed] [Google Scholar]
- 33.Dasgupta BR and Weitz D, Physical Review E, 2005, 71, 021504. [DOI] [PubMed] [Google Scholar]
- 34.Kaszuba M, Connah MT, McNeil-Watson FK and Nobbmann U, Particle & Particle Systems Characterization, 2007, 24, 159–162. [Google Scholar]
- 35.Tuteja A, Mackay ME, Narayanan S, Asokan S and Wong MS, Nano Letters, 2007, 7, 1276–1281. [DOI] [PubMed] [Google Scholar]
- 36.Palmer A, Xu J and Wirtz D, Rheologica Acta, 1998, 37, 97–106. [Google Scholar]
- 37.Doi M and Edwards SF, The Theory of Polymer Dynamics, Oxford University Press, Oxford, 1988, vol. 73. [Google Scholar]
- 38.Alexander CM, Dabrowiak JC and Goodisman J, Journal of Colloid and Interface Science, 2013, 396, 53–62. [DOI] [PubMed] [Google Scholar]
- 39.Wehrman MD, Lindberg S and Schultz KM, Soft Matter, 2018, 14, 5811–5820. [DOI] [PubMed] [Google Scholar]
- 40.Cheng L-C, Hsiao LC and Doyle PS, Soft Matter, 2017, 13, 6606–6619. [DOI] [PubMed] [Google Scholar]
- 41.Valentine MT, Kaplan PD, Thota D, Crocker JC, Gisler T, Prud’homme RK, Beck M and Weitz DA, Physical Review E, 2001, 64, 061506. [DOI] [PubMed] [Google Scholar]
- 42.Wong I, Gardel M, Reichman D, Weeks ER, Valentine M, Bausch A and Weitz DA, Physical Review Letters, 2004, 92, 178101. [DOI] [PubMed] [Google Scholar]
- 43.Gisler T and Weitz DA, Physical Review Letters, 1999, 82, 1606. [Google Scholar]
- 44.Gardel M, Valentine M, Crocker JC, Bausch A and Weitz D, Physical Review Letters, 2003, 91, 158302. [DOI] [PubMed] [Google Scholar]
- 45.Kupferman R, Journal of Statistical Physics, 2004, 114, 291–326. [Google Scholar]
- 46.Min W, Luo G, Cherayil BJ, Kou S and Xie XS, Physical Review Letters, 2005, 94, 198302. [DOI] [PubMed] [Google Scholar]
- 47.Kubo R, Reports on Progress in Physics, 1966, 29, 255. [Google Scholar]
- 48.Zwanzig R and Bixon M, Physical Review A, 1970, 2, 2005. [Google Scholar]
- 49.Faraudo J and Bafaluy J, Physical Review E, 1996, 54, 3725. [DOI] [PubMed] [Google Scholar]
- 50.Lou J, Stowers R, Nam S, Xia Y and Chaudhuri O, Biomaterials, 2018, 154, 213–222. [DOI] [PubMed] [Google Scholar]
- 51.Rosales AM and Anseth KS, Nature Reviews Materials, 2016, 1, 1–15. [DOI] [PMC free article] [PubMed] [Google Scholar]
- 52.Khetan S, Guvendiren M, Legant WR, Cohen DM, Chen CS and Burdick JA, Nature Materials, 2013, 12, 458–465. [DOI] [PMC free article] [PubMed] [Google Scholar]
- 53.Schmidt FG, Hinner B and Sackmann E, Physical Review E, 2000, 61, 5646. [DOI] [PubMed] [Google Scholar]
- 54.Pusey PN and Van Megen W, Physica A: Statistical Mechanics and its Applications, 1989, 157, 705–741. [Google Scholar]
- 55.Madl CM and Heilshorn SC, Chemistry of Materials, 2019, 31, 8035–8043. [DOI] [PMC free article] [PubMed] [Google Scholar]
- 56.Chambon F and Winter HH, Journal of Rheology, 1987, 31, 683–697. [Google Scholar]
- 57.Winter HH and Mours M, Neutron Spin Echo Spectroscopy Viscoelasticity Rheology, Springer, 1997, pp. 165–234. [Google Scholar]
- 58.Larsen TH and Furst EM, Physical Review Letters, 2008, 100, 146001. [DOI] [PubMed] [Google Scholar]
- 59.Corrigan AM and Donald AM, Langmuir, 2009, 25, 8599–8605. [DOI] [PubMed] [Google Scholar]
- 60.Vuletić T, Babić SD, Ivek T, Grgičin D, Tomić S and Podgornik R, Physical Review E, 2010, 82, 011922. [DOI] [PubMed] [Google Scholar]
- 61.Buhler E and Boue F, Macromolecules, 2004, 37, 1600–1610. [Google Scholar]
- 62.Stylianopoulos T, Poh M-Z, Insin N, Bawendi MG, Fukumura D, Munn LL and Jain RK, Biophysical Journal, 2010, 99, 1342–1349. [DOI] [PMC free article] [PubMed] [Google Scholar]
- 63.Lieleg O, Baumgärtel RM and Bausch AR, Biophysical Journal, 2009, 97, 1569–1577. [DOI] [PMC free article] [PubMed] [Google Scholar]
- 64.Mason TG, Rheologica Acta, 2000, 39, 371–378. [Google Scholar]
- 65.Krajina BA, Zhu A, Heilshorn SC and Spakowitz AJ, Physical Review Letters, 2018, 121, 148001. [DOI] [PubMed] [Google Scholar]
- 66.Carey SP, Martin KE and Reinhart-King CA, Scientific Reports, 2017, 7, 42088. [DOI] [PMC free article] [PubMed] [Google Scholar]
- 67.Sabeh F, Ota I, Holmbeck K, Birkedal-Hansen H, Soloway P, Balbin M, Lopez-Otin C, Shapiro S, Inada M, Krane S et al. , The Journal of Cell Biology, 2004, 167, 769–781. [DOI] [PMC free article] [PubMed] [Google Scholar]
- 68.Button B, Goodell HP, Atieh E, Chen Y-C, Williams R, Shenoy S, Lackey E, Shenkute NT, Cai L-H, Dennis RG et al. , Proceedings of the National Academy of Sciences, 2018, 115, 12501–12506. [DOI] [PMC free article] [PubMed] [Google Scholar]
- 69.Chaudhuri O, Parekh SH, Lam WA and Fletcher DA, Nature Methods, 2009, 6, 383–387. [DOI] [PMC free article] [PubMed] [Google Scholar]
Associated Data
This section collects any data citations, data availability statements, or supplementary materials included in this article.


