

Abstract
Use of food image capture and/or wearable sensors for dietary assessment has grown in popularity. “Active” methods rely on the user to take an image of each eating episode. “Passive” methods use wearable cameras that continuously capture images. Most of “passively” captured images are not related to food consumption and may present privacy concerns. In this paper, we propose a novel wearable sensor (Automatic Ingestion Monitor, AIM-2) designed to capture images only during automatically detected eating episodes. The capture method was validated on a dataset collected from 30 volunteers in the community wearing the AIM-2 for 24h in pseudo-free-living and 24h in a free-living environment. The AIM-2 was able to detect food intake over 10-second epochs with a (mean and standard deviation) F1-score of 81.8 ± 10.1%. The accuracy of eating episode detection was 82.7%. Out of a total of 180,570 images captured, 8,929 (4.9%) images belonged to detected eating episodes. Privacy concerns were assessed by a questionnaire on a scale 1–7. Continuous capture had concern value of 5.0 ± 1.6 (concerned) while image capture only during food intake had concern value of 1.9 ±1.7 (not concerned). Results suggest that AIM-2 can provide accurate detection of food intake, reduce the number of images for analysis and alleviate the privacy concerns of the users.
Index Terms—: Food intake detection, wearable sensors, dietary assessment, energy intake, food imagery
I. Introduction
THE emergence of chronic diseases such as obesity, overweight, and cardiovascular disease has prompted extensive research efforts to study the contributing factors towards the development of these diseases [1], [2]. One important direction is the study of the food intake of the individuals. Traditional methods of monitoring individual food intake through self-report such as food records [3], food frequency questionnaires [4], 24-hours food recall [5], have proven to be highly inaccurate [6] and not capable to assess metrics such as eating episode microstructure [7].
In a typical eating episode, a bite is followed by a sequence of chews and swallows, and this process is repeated until eating a portion of food to satisfy appetite. Accurate and objective assessment of food intake may be helped by automatic detection of food intake, recognition of consumed food items, estimation of portion size, and energy content [8]. Over the past decade, various methods of automatic detection and monitoring of food intake have been proposed, including image-based methods utilizing either smartphones or wearable cameras. The image capturing can be categorized into two methods – active and passive.
Active methods rely on the user to capture the food image by a hand-held camera (such as a smartphone camera), typically, before and after an eating episode. The analysis of acquired images is typically performed in either of two ways: manual annotation or automatic image recognition. During manual annotation, food images are analyzed by an expert nutritionist to identify different types of foods, their portion size, and the energy content [9]. Methods employing automatic image recognition use computer vision techniques to segment food images, recognize foods, estimate portion size/volume and compute energy content [10]–[13].
Major advantages of active methods include reduction of reporting burden compared to traditional self-report and inclusion of food images (initial state and leftovers) that help nutrition analysis of the eating episodes. Apart from these advantages, they also provide detailed information about the timing, location, and duration of eating episodes. While providing advantages, active methods also involve some limitations. The image capture of all eating episodes requires active participation from the participants. Some of the methods are required to place fiducial markers (known as dimensional and color references) in the food image to assist manual review/computer [10], [14].
Food images can also be acquired by a “passive” method using wearable devices that captures images continuously (both food and non-food) without the active participation of the user [15], [16]. The passive methods minimize the burden of active capture through the use of a wearable camera. Due to continuous capture, passive methods produce large datasets and introduce privacy concerns. The large image data sets make the manual image review tedious and time-consuming. To lessen the burden of image review, deep-learning-based image processing was investigated to automatically differentiate between food and non-food images [17], however, this approach results in a high number of false positives. The algorithm may pick foods in the field of user’s view that is not consumed by the user. Another limitation of passive capture is that the device may take unwanted images that can raise privacy concerns and potential ethical issues. The wearer inadvertently might collect inappropriate images, such as adjusting clothing in front of a mirror, using the bathroom, browsing internet/social networking sites, reading confidential documents, unwanted images of surroundings – getting undressed/ faces of family members without consent [18]. Therefore, methods relying on wearable cameras should deal with these situations.
Various wearable sensors have been proposed to detect different stages of eating, i.e. bites, chewing and swallowing of food. Wrist-worn wearables have been used to detect food-related-gestures [19]–[21]. The chewing detection has been done via chewing sounds [22]–[26], muscle movement during chewing using strain sensors [27]–[30], or EMG and force sensors [31]–[33]. Swallowing detection was performed using microphones or surface electromyography on the throat [34]–[36]. Recently, the authors in [37] proposed a method of detecting an elderly person’s chewing motion using a glasses mounted accelerometer. The method utilized a single accelerometer and extracted limited feature sets to recognize chewing motion. Our research group previously proposed an “Automatic Ingestion Monitor (AIM)” [27], [28], [38], [39], which relied on an adhesive strain sensor mounted below the outer ear. The sensor described in this manuscript is the next generation of the device, relying on a different set of sensors.
A few publications proposed food intake monitoring systems that utilize wearable sensors to detect food intake events and trigger food image capture. In a study of [40], the authors proposed to trigger an over-ear camera to capture a video sequence when a chewing sound is detected. The study [41] investigated a smartwatch camera to take images of the food consumption, suggesting that hand-to-mouth gestures may be used to trigger the smartwatch camera. Overall, no completely viable sensor-driven passive food intake capture system was demonstrated in literature.
As a separate note, sensor-based approaches of food intake detection face a major challenge of validation in the free-living environment as there is no gold standard available. Most of the studies [9], [10], [17], [19], [20], [39], [42]–[44] were validated with the self-report which is subject-dependent and prone to error. Therefore, there is still a need for a robust method for validation of sensor-based food intake detection in a free-living environment.
In this paper, we propose a novel wearable sensor system (Automatic Ingestion Monitor version 2, AIM-2) that attempts to address some of these challenges. The major contributions of the proposed work are: (1) AIM-2 uses a combination of acceleration and temporalis muscle sensors for accurate detection of food intake and triggering of a wearable camera; (2) The proposed gazed-aligned camera mounted on eyeglasses reliably captures the food being consumed; (3) AIM-2 provides a potential solution to significantly reduce the number of images captured; (4) this study suggests and tests a method for validation of sensor-based food intake detection sensor in free-living against images captured by a wearable camera; and (5) This study demonstrates that capture of images only during detected food intake significantly reduces privacy concerns of both the users and nearby people.
II. Material and Methods
A. Sensor System
In this study, a novel wearable sensor system (Automatic Ingestion Monitor, AIM-2) was used. AIM-2 consists of a sensor module which housed a miniature 5 Megapixel camera with 120- degree wide-angle gaze-aligned lens, a low-power 3D accelerometer (ADXL362 from Analog Devices, Norwood, MA, USA) and a bending sensor (SpectraSymbol 2.2” flex sensor). The sensor module was connected to the frame of eyeglasses by a heat-shrink tube (Fig. 1) in a location such that the maximum curvature of the sensor touched the skin over the temporalis muscle where the strongest muscle contraction during chewing was palpated. The camera continuously captured images at a rate of one image per 15-second interval as a way to validate sensor-based food intake detection against captured images. The flex sensor was used to capture the chewing events. To protect the sensor from perspiration, commercially available polyurethane coating was used over the top layer of the flex sensor. Data from the accelerometer and flex sensor were sampled at 128 Hz. All collected sensor signals and captured images were stored on an SD card and processed off-line in MATLAB (Mathworks Inc., Natick, MA, USA) for algorithm development and validation.
Fig. 1.
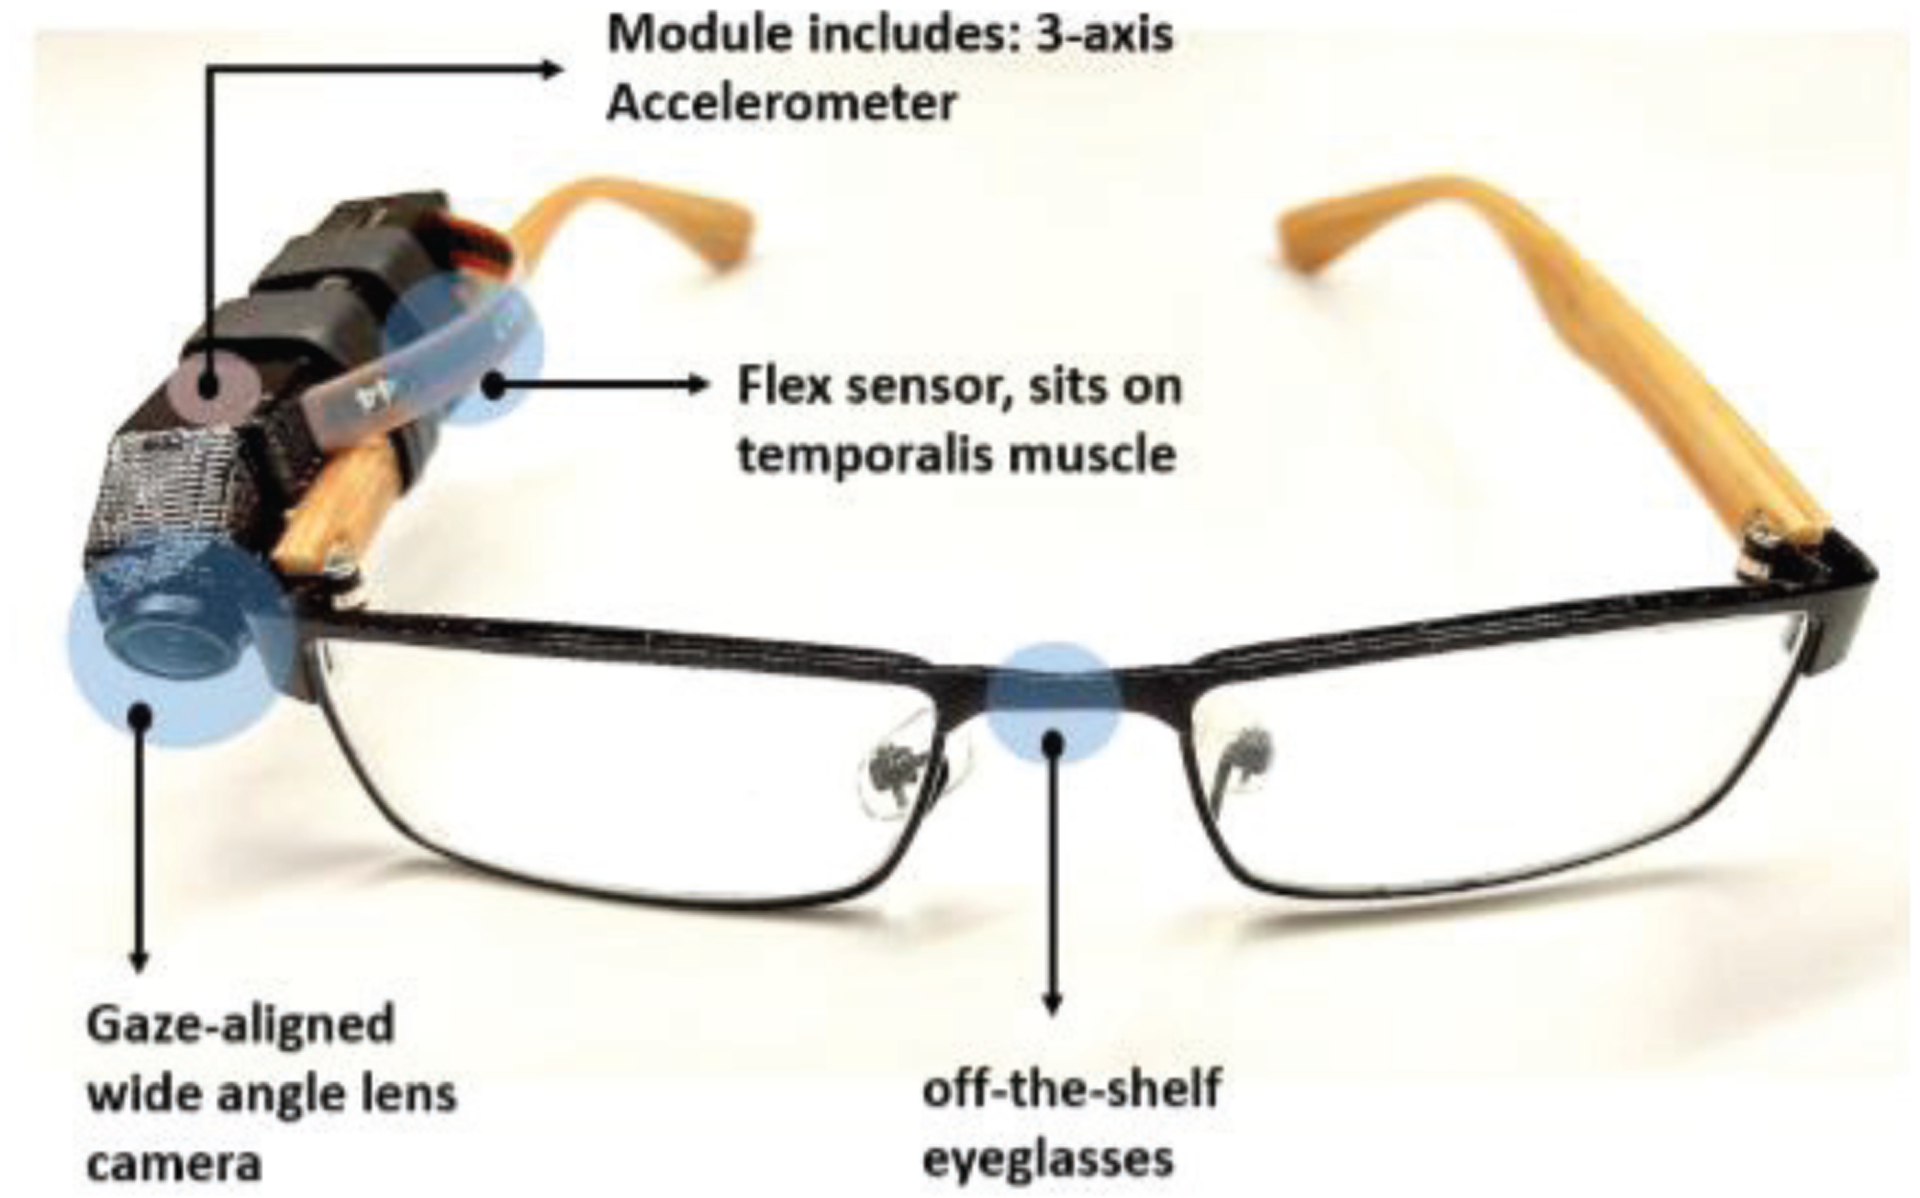
AIM-2. The sensor module is attached to the temple of off-the-shelf wearable eyeglasses with heat shrink tubes.
B. Study Design and Data Collection Protocol
A cross-sectional observational study was conducted to develop the classification algorithms and assess the accuracy of food intake detection. The study consisted of pseudo-free-living part (food consumption in the lab with otherwise unrestricted activities of daily living) and free-living part (unrestricted food intake and activities of daily living), performed on two consequtive days.
Thirty volunteers were recruited (20 male and 10 female, mean± SD age of 23.5 ± 4.9 years, range 18–39 years, mean body mass index (BMI) 23.08 ± 3.11 kg/m2, range 17.6 to 30.5 kg/m2) from August 2018 through February 2019. The University of Alabama’s Institutional Review Board approved the study. Participants did not have any medical conditions that would impact their chewing or eating. The sample size for this study was determined based on a power analysis using data from our previous study [39]. The power analysis was performed based on the mean accuracy (F1-score) 87.9% with standard deviation of 13.8% under the null hypothesis (H0) and the expected accuracy of 95% under alternative hypothesis (HA). Power analysis indicated that a sample of 30 participants was sufficient to detect the difference between food intake detection mean accuracy with a power 86.6% using a t-test with a significance level of 0.05. Participants came to the laboratory for four visits over two days. The laboratory was instrumented with two high-definition cameras (Contour Roam2 LLC, USA, and GW- 2061IP, GW Security, Inc. CA, USA) to record the experiment. Prior to the experiment, the participants made their first visits to the laboratory. They went through the screening process and were given a summary of the experimental protocol as Table I. Each participant signed an informed consent form. After consent was acquired, the sensor system (AIM-2) was affixed to eyeglasses of the participants (if the participants had the corrective lens, they were instructed to bring their spare eyeglasses) or non-prescription eyeglasses (if the participants had no corrective lens, they chose from the eyeglasses available at the lab). The eyeglasses mounted with a sensor system for each participant were kept in the lab until the next visit. During the visit, the participants were also trained to report dietary intake and activity using the mobile applications Automated Self-Administered 24-Hour (ASA24®) Dietary Assessment Tool [45] and aTimeLogger [46], respectively. On the first day of the experimental protocol, the participants came to the laboratory three times (visits 2–4). Several participants were invited to the laboratory at the same time to simulate social eating. For the second visit, the participants were instructed to arrive at the laboratory in the morning (between 7:00 AM – 9:00 AM) after an overnight fast. Upon the arrival, participants were given the AIM-2 device and were reminded about the instructions for the experiment. Each participant had a full eating episode (breakfast) purchased from the university food court. The participants chose the type and quantity of food items that they wanted to consume. Research assistants weighed each food item and used a nutrition software “Food Processor” [47] to enter the weight and other details about the food items. After selection of foods for the meal, participants were required to perform the eating episode at the laboratory. There was no restriction on the time required to finish the eating episode.
TABLE I.
Experimental protocol
| Day | Activity | Description | Duration |
|---|---|---|---|
| Initial interview, the signing of the informed consent, completing a food frequency questionnaire, AIM-2 sensor preparation | 20 mins | ||
| Prior to experiment | 1st visit | Training on mobile apps | 15 mins |
| Training on portion size estimation | 20 mins | ||
| Testing on portion size estimation | 15 mins | ||
| 1 | 2nd visit to lab | Eat a meal (eating episode -1) | As required |
| 1 | 3rd and 4th visits to the lab | Carry out usual daily activities, except for 2 eating episodes to be consumed at the laboratory | As required |
| 2 | Free-living | Carry out usual daily activities and eating the usual diet. | 1 day |
During the food consumption in the lab, participants used the foot pedal connected to a USB data logger to mark ingestion of solid and liquid food items. They were asked to press the pedal the moment the food was placed in their mouth (a bite), and hold the pedal until the last swallow for this bite. For beverages, they were asked to press and hold the button from the moment they brought the liquid to mouth until the last swallow. When the participants had finished eating, the research assistant weighed leftovers and updated the amount consumed in the nutrition software. Then, the participants left the laboratory and continued carrying out their usual daily activities in the free-living environment. Visits three and four were made on the same day to eat lunch and dinner following a similar protocol. Since the eating episodes were consumed at the laboratory, other daily activities were not restricted and the participants were free to take the device home, the first day of study was considered to be conducted in the pseudo-free-living environment.
After the completion of the first day, the participants continued with free-living for 24 hours. During this period, the participants had virtually no restrictions on the types of activities performed. They continued their normal daily routine with three exceptions: to take the AIM-2 off during 1) taking a shower or other water activities that may damage the device, 2) any moments where the device could impact privacy and 3) sleeping. The participants were also asked to self-report all of their laboratory and eating episodes using the ASA24 mobile app (a food diary). They were also asked to self-report major activities from the set of sleeping, eating, sedentary, and physically active through the aTimeLogger application. After completing the free-living part of the study, the participants reported to the laboratory to return the AIM-2.
C. Sensor Signal Processing and Annotation
Before extracting features from sensor signals, the raw sensor data from the accelerometer and flex sensor were preprocessed. A high-pass filter with a cutoff frequency of 0.1 Hz was applied to remove the DC component from the signals. To adjust inter-subject variations, the signals were then normalized [28]. The flex sensor signal was demeaned. As the typical chewing frequency is in the range of 0.94 to 2 Hz, therefore, a low-pass filter with a cutoff of 3Hz was used to remove unwanted noise from the flex sensor [48]. Next, the signals were divided into non-overlapping 10s fixed time segments called ‘epochs’. Fig. 2 shows the accelerometer signals, flex sensor signals, and corresponding foot pedal accelerometer signal.
Fig. 2.
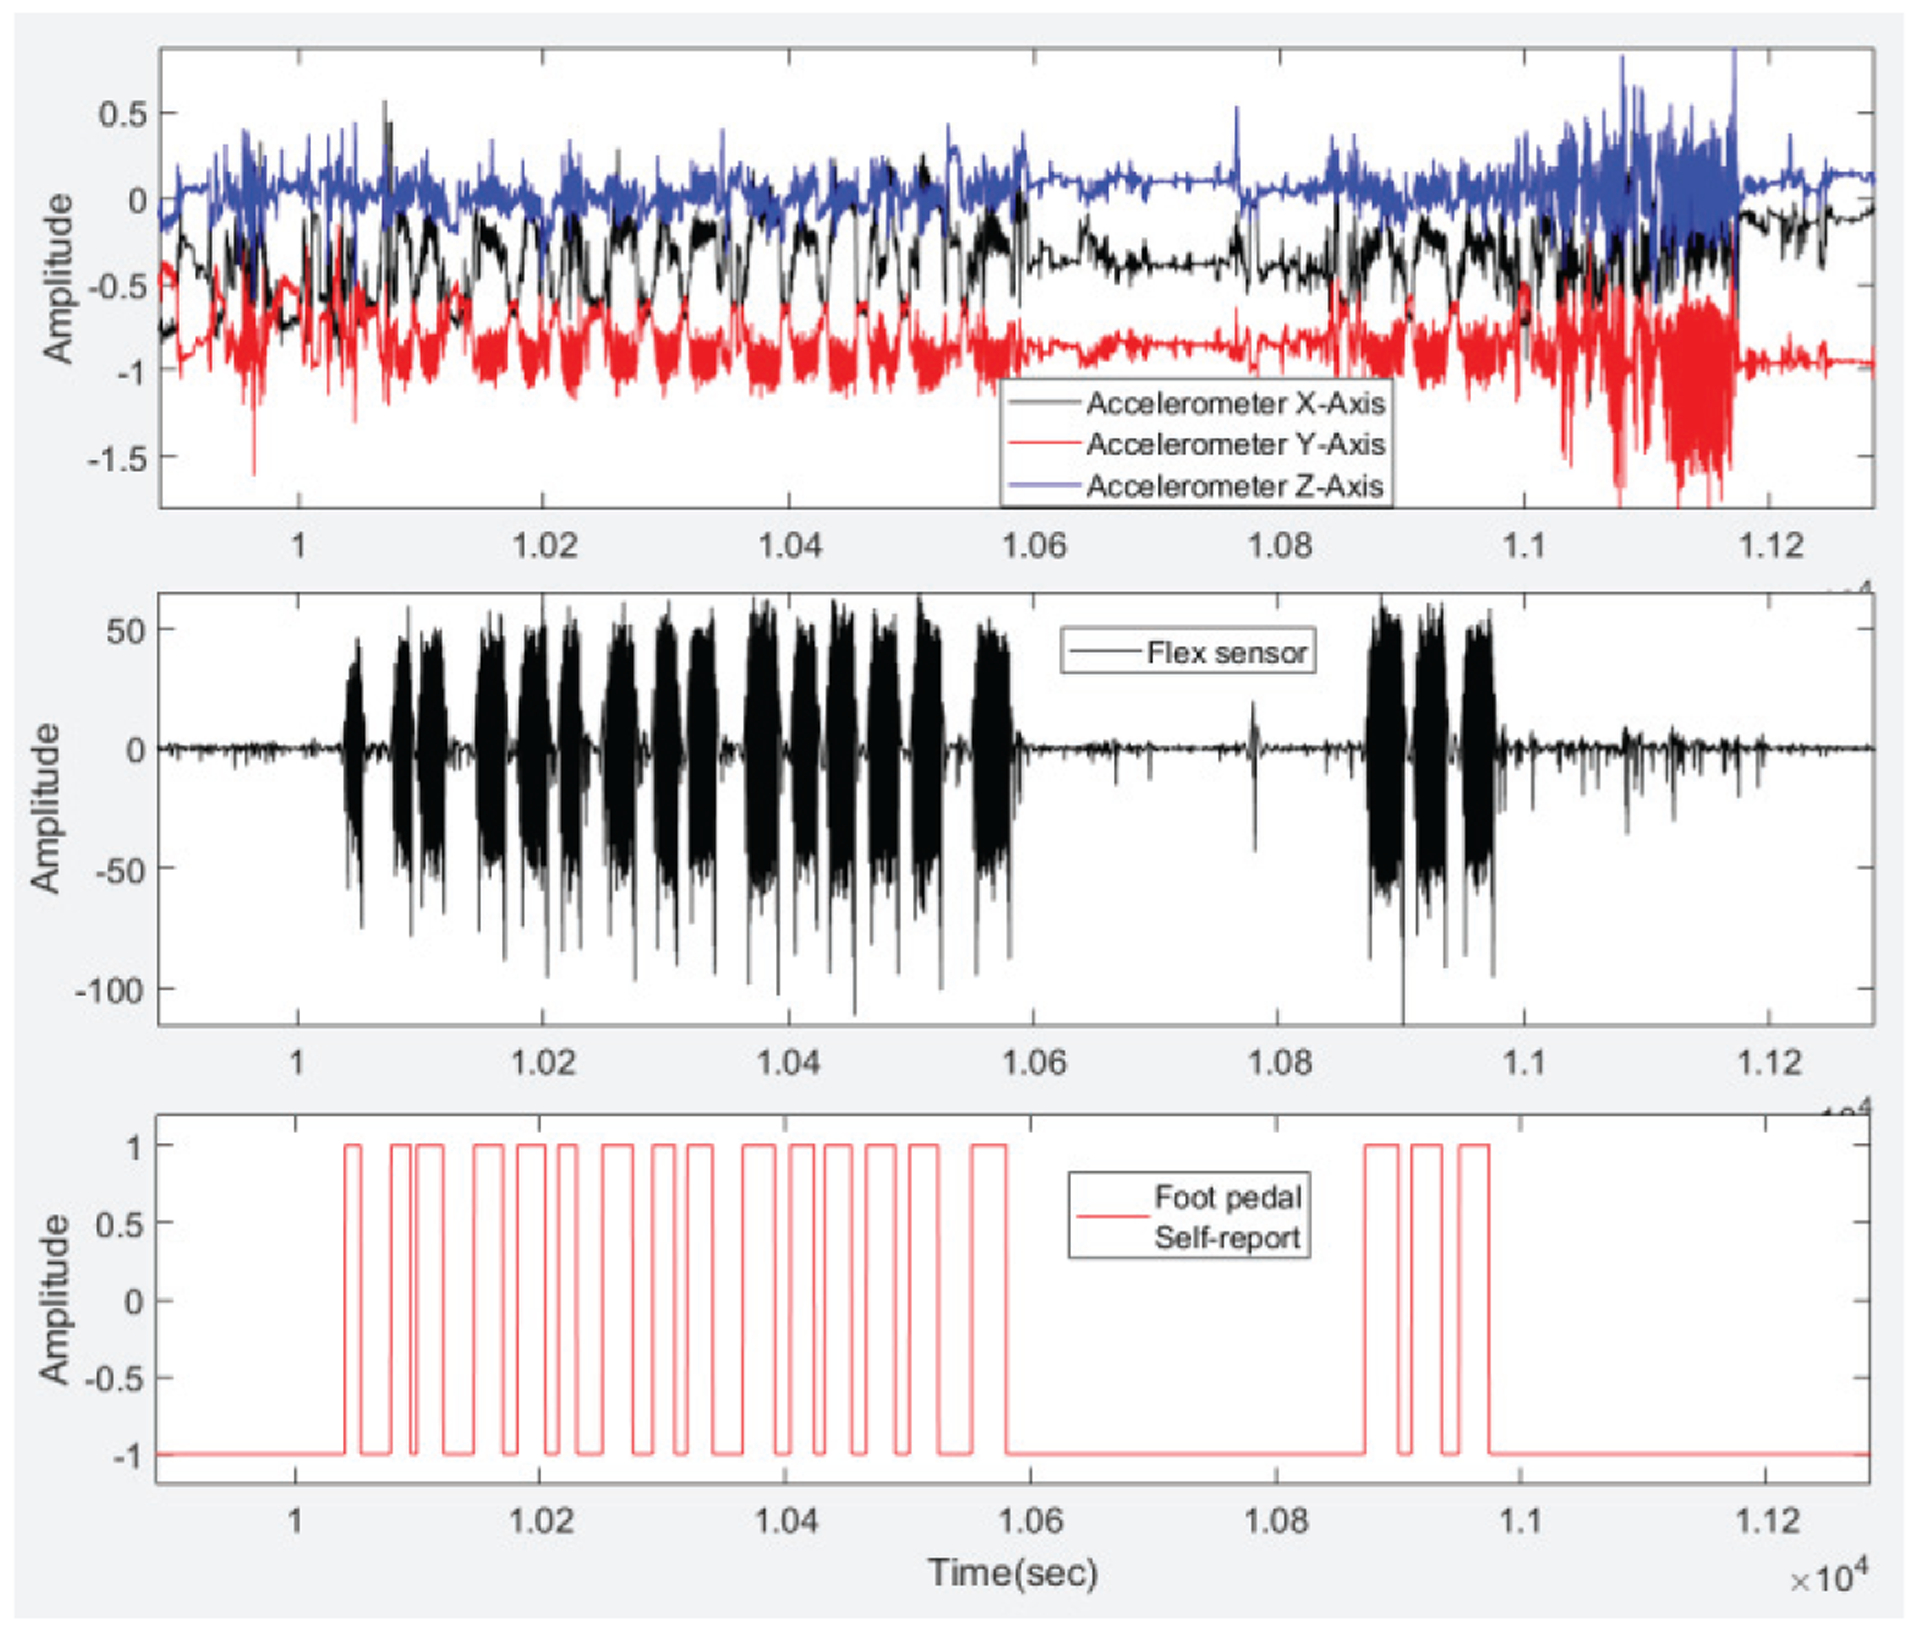
Signals from 3-axes of the accelerometer are shown on the top segment. The middle segment demonstrates the flex sensor signal. The foot pedal signal marked by the participants is shown on the bottom segment. Here ‘1’ indicates food intake and ‘−1’ indicates no food intake.
D. Feature Extraction
A set of 38 time and frequency domain features reported in our previous studies [28], [38] was utilized in this work. The accelerometer sensor signal contains chewing information in the frequency range 1.25–2.5 Hz, physical activity in the 2.5–10 Hz range and speech in the range 10–30 Hz [39]. For each of 3 axes of the accelerometer and net acceleration, 38 features were computed on 10s epoch data. For the flex sensor signal, the same 38 features were computed, plus five additional correlation-based features. The entire feature list is listed in Table II and details about the features can be found in [28], [38]. Aggregating all features, 195 features were computed for each epoch.
TABLE II.
Feature sets computed from both accelerometer sensor and flex sensor epochs
| Features | Signal | Total |
|---|---|---|
|
38 time and frequency domain features: Mean absolute value (MAV), root mean square (RMS), maximum value (MAX), median value (MED), ratio of MAV to RMS (RMVR), ratio of Max to RMS (RMR), ratio of MAV to Max (RMVM), ratio of Med to RMS (RMER), signal entropy (EN), number of zero crossings (ZC), mean time between ZC (MZC), number of peaks (NP), average range (AVR), mean time between peaks (MNP), ratio of NP to ZC (RNZ), ratio of ZC to NP (RZN), waveform length (WL), number of slope sign changes (SSC), frequency spectrum energy (SE), energy spectrum in chewing range (EC), entropy of spectrum chewing range (ENC), ratio of chew_energy to spec_energy (RCS), energy spectrum in walking range (EW), entropy of spectrum walking range (ENW), ratio of walk_energy to spec_energy (RWS), energy spectrum in talking range (ET), entropy of spectrum talking range (ENT), ratio of talk_energy to spec_energy (RTS), ratio of chew_energy to walk_energy (RCW), ratio of chew_entr to walk_entr (RCWen), ratio of chew_energy to talk_energy (RCT), ratio of chew_entr to talk_entr (RCTen), ratio of walk_energy to talk_energy (RWT), ratio of walk_entr to talk_entr (RWTen), fractal dimension (FD), peak frequency in chewing range (PCS), peak frequency in walking range (PWS), peak frequency in talking range (PTS). |
Acc x-axis Acc y-axis Acc z-axis Net-acceleration Flex sensor |
38*5 = 190 |
|
5 correlation related features: correlation coefficient, the 1st autocorrelation function coefficient, fundamental frequency, pitch period, value of autocorrelation at zero lag |
Flex sensor | 5 |
E. Feature Selection and Classification
To reduce the computational burden and redundancy in the computed features, a two-stage feature selection procedure was used. First, a ranking of computed features was carried out. To rank the feature based on mutual information, an algorithm called minimum Redundancy and Maximum Relevance (mRMR) was applied on the computed features [49]. Secondly, a Forward Feature Selection (FFS) was applied to the top-ranked 40 features selected by mRMR to get an optimal feature set. To avoid introducing bias into classification models that might result in overfitting, feature selection was done on an independent dataset (collected from four pilot subjects following the same protocol, who were not a part of the population for this study).
Foot pedal signals were used as a source of labels for the development of signal processing and pattern recognition algorithms. If more than 50% of an epoch belonged to food intake, the epoch i was assigned a label Epi = ‘1’ (food intake), otherwise the label Epi = ‘−1’ (no food intake). A group classification model based on Support Vector Machine (SVM) was trained to identify food-intake and non-food intake epochs. Linear SVM is a supervised learning technique that has demonstrated excellent results for the classification problem. The primary advantages of SVM are good generalization and speed [50]. Training of the model was performed using Classification Learner tool in MATLAB 2018 (from Mathworks Inc.).
To reliably detect food intake, a two-stage classification algorithm was adopted. As the flex sensor was placed on the temporalis muscle of the user, the signal strength and quality varied depending on the chewing strength of user. The first stage of two-stage classification algorithm was to check the strength (amplitude) of flex sensor signal. When the peak to peak amplitude and energy of the flex sensor signal fell under 40 and 3, respectively, the second stage classification used features only from the accelerometer. Otherwise, the classification was performed using features from both from the flex sensor and accelerometer (further referred as sensor fusion classifier). For comparison, the classification performances using features from only flex sensor and only accelerometer were also investigated.
For laboratory eating episodes, the performance of the classification model was evaluated as in per-epoch classification accuracy in a leave-one-subject-out cross-validation. The SVM model was trained with data from 29 participants and tested on data from the remaining participant. The procedure was repeated 30 times such that each participant was used for testing once. The accuracy for each iteration was assessed as F1 score:
| (1) |
| (2) |
| (3) |
where TP, FP, and FN denote true positives, false positives, and false negatives, respectively. The performance of the proposed method was also compared to the method with limited feature set of Mertes et al.[37].
The group model trained from laboratory eating episodes (day-1) was utilized to detect free-living eating episodes. For free-living eating episodes, the participants did not report each chewing sequence as in the lab, thus not allowing for the same measure of accuracy to be used. Instead, the number of correctly detected eating episodes obtained from the image review was used as the reference for evaluation. Additionally, the self-reported number of eating episodes was compared with detected free-living eating episodes. The following parameters were defined for performance evaluation:
No. of eating episode from image review = NIR
Number of eating episode accurately detected by AIM-2 = NAIM2
Accuracy of sensor detection (NAIM2/NIR) = Acc (%)
Number of self-reported eating episode = Nself
Number of false positives by AIM-2 = NFP
Number of undetected eating episode by AIM-2 = NFN
Eating episode containing solids/semi-solid food items = EEpisol
Eating episode containing liquid food items only = EEpiliq
Number of EEPisol = Nsol
Number of EEpiliq = Nliq
F. Image Capture, Manual Review, and Validation method
In this validation study, the AIM-2 captured images every 15 seconds and potentially could capture unwanted images. Therefore, the participants were given the opportunity to review and delete them before the research assistant viewed them.
The images captured by AIM-2 were used for validation of sensor-based food intake detection in free-living. The complete set of captured images was reviewed to detect the eating episodes, including episodes that were missed by the sensor-based food intake detection algorithm. The sensor-based eating episodes were detected using method in [7], where a Gaussian smoothing kernel applied to the food intake epochs detected from sensor fusion model, was used to determine the boundaries of each episode. The width of the kernel of 150s [7] was used. The start and end points of each eating episode were determined by the intersection of the food intake epochs and Gaussian-smoothed signals. Then, the accuracy of eating episode detection was computed as the ratio of the number of sensor-detected eating episodes to the number of image-detected eating episodes.
Another goal of image review was to estimate the number of false positives in sensor-based food intake detection. All sensor-detected eating episodes and corresponding images were reviewed. If no images of food item were detected in a sensor-detected eating episode, then it was counted as false positive.
The third goal was to quantify the reduction in the number of images captured by the “passive” device. For each participant-day, the total number of images, the total number of food images in sensor-detected eating episodes and the percentage of food images of all captured images were computed.Finally, the time spent on image review was recorded. The information was utilized to evaluate if the sensor detection of eating episodes would significantly save review time.
G. Privacy Concerns Survey
Since the participants did not have any control over the passive image capture from AIM-2, there exist possible privacy concerns. To assess the privacy concerns of participants, a survey [51] was conducted after the experiment. The participants were presented with the following questions and asked to answer using a scale of 1 to 7, where ‘1–2’ means ‘not concerned’; ‘3–5’ means ‘somewhat concerned’; ‘6’ means ‘concerned’; ‘7’ means ‘extremely concerned’:
How concerned are you about your privacy if the device captures images continuously throughout the day?
How concerned are you about your privacy if the device captures images only during eating events?
The responses were recorded. To analyze the responses, the mean and standard deviation of the recorded score for both cases were computed. In addition, the percentage of participants in each of the four privacy concern categories was computed. All analyses were done using Microsoft Excel 2018 (from Microsoft Inc.).
H. Statistical Analysis
To determine the impact of sensors on classification performance, student’s t-test was investigated to compare between accelerometer only, flex only and sensor fusion methods. To compare the number of eating episodes estimated by image review, sensor-detected and self-report, a non-parametric Friedman test was examined. All statistical analyses were done using MATLAB 2018 (from Mathworks Inc.).
III. Results
Nine features were selected for the sensor fusion classifier (utilizing features from both accelerometer and flex sensors) of the two-stage classification algorithm (Section II.E). Eighteen features were selected for training of accelerometer-only classifier. When training the flex sensor-only classifier, eight features were selected. The selected features for all the classifiers are listed in Table III. Results of the leave one- out cross-validation procedure for the laboratory environment are shown in Table IV. The best average F1-score metric of food intake detection for 10-sec epochs was found 81.84 ± 10.1% for sensor fusion method in lab eating episodes. The method with limited set of features [37] yielded F1-score of 59.13 ± 25.5%. Statistical results showed that the sensor fusion method was significantly different from accelerometer only method (p-value = 0.0008) and flex sensor only method (p-value = 0.0006).
TABLE III.
Selected Features for Two Classifiers
| Classifier | Selected Features |
|---|---|
| Acc-only | Acc_x : MAV; Acc_y : MAX, PTS, RMS; Acc_z : NP, RWS, RTS, AVR, MAV, RWT, ENW, EC; Acc_net: MAX, SSC, RMER, NP, EC, RCS |
| Flex-only | Flex : NP, RZN, RMVR, ZC, FD, SSC, ENC, EC |
| Sensor fusion | Acc_y : RTS; Acc_z : NP, WL; Acc_net : PCS; Flex : NP, RZN, RMVR, FD, EC |
TABLE IV.
Average Performance Matrices for 10s epochs for Laboratory Experiments (Day-1)
| Method | Precision (%) | Recall (%) | F1-score (%) |
|---|---|---|---|
| Mertes et.al [37] | 76.41 ± 23.82% | 53.49 ± 28.79% | 59.13 ± 25.54% |
| Proposed – Acc sensor only | 78.36 ± 12.05% | 78.84 ± 12.30% | 76.69 ± 9.65% |
| Proposed – Flex sensor only | 72.40 ± 24.04% | 65.43 ± 30.80% | 64.82 ± 29.33% |
| Proposed –Sensor fusion | 82.74 ± 14.07% | 83.25 ± 12.98% | 81.84 ± 10.14% |
The accuracy of eating episode detection both in the laboratory (day-1) and free environment (day-2) is provided in Table VI. The mean accuracy of sensor-detected eating episodes was 97% in lab eating episodes and 76.1% in free-living eating episodes, suggesting that the AIM-2 captured most of the ingested eating episodes. Manual review of all captured images revealed that 4 and 34 drinking episodes were missed in day-1 and day-2 respectively.
TABLE VI.
Image statistics captured by AIM-2
| Day | Total hours data collected (hours) | Total number of Images | Food Images | % of food images | Time spent on image review (min) | |
|---|---|---|---|---|---|---|
| 1 | Total | 371.90 | 89257 | 3996 | 799.72 | |
| Mean ± SD | 12.4 ± 1.5 | 2975.2 ± 362.3 | 133.2 ± 59.6 | 4.50 ± 1.9 | 26.66 ± 7.9 | |
| 2 | Total | 380.5 | 91313 | 4933 | 658.8 | |
| Mean ± SD | 12.68 ± 1.4 | 3043.7 ± 337.2 | 164.4 ± 55.7 | 5.49 ± 2.04 | 21.96 ± 12.2 | |
Additionally, the manual review of images detected 38 and 55 false positives in sensor-detected eating episodes in day-1 and day-2 respectively.
While the AIM-2 was worn, 180,570 images were captured, with 8,929 images of food and beverage consumption during sensor-detected events. The total time spent on eating and free-living activities were 37.2 hours and 715.2 hours respectively. Fig. 3 shows selected food and non-food images captured by AIM-2.
Fig. 3.
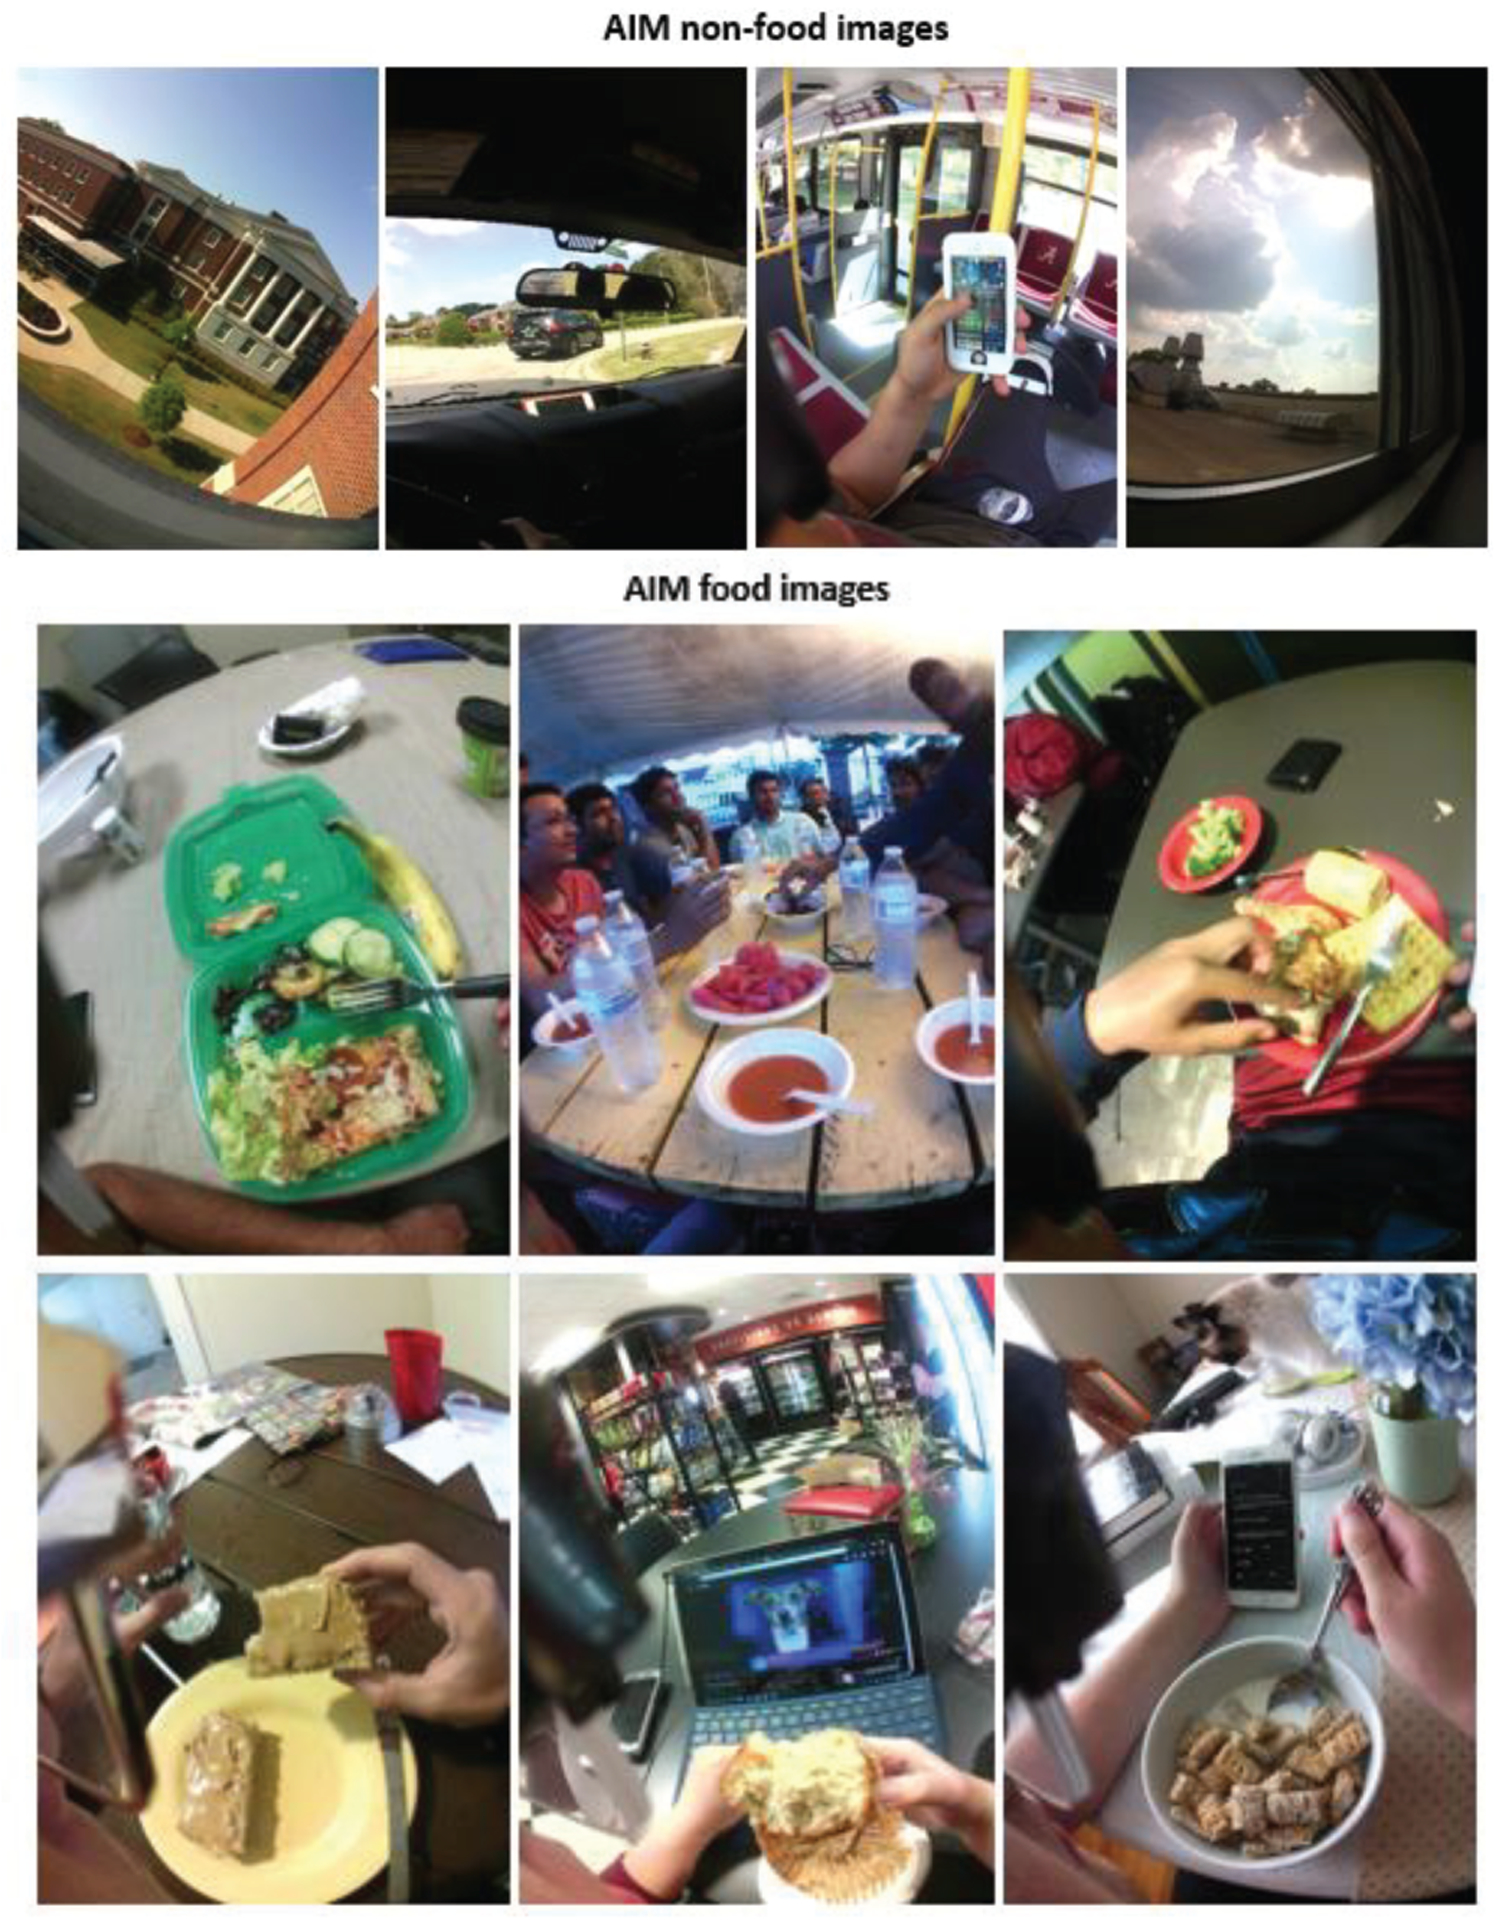
Examples of AIM-2 images, (top) selected non-food images (bottom) selected food images from several image-detected eating episodes.
Table VI demonstrates image statistics captured by AIM-2 in day-1 and day-2 respectively. For each participant day, on average 5 % of all images were food images. This result indicates that the number of images for analysis can be significantly reduced. The amount of food images also bolsters the fact that the system may provide a potential solution to privacy concerns.
The average time required to review all images captured by AIM-2 was ~22 mins and ~27 mins in day-1 and day-2 respectively. In case of reviewing all the images, a reviewer needed to review on an average 3,043 images for day-1 and 2,975 images for day-2. On the other hand, in case of reviewing food intake detection only images, a reviewer needed to review on an average 165 (5.49% of all images) images for day-1 and 133 (4.50% of all images) images for day-2.
All participants responded to the privacy concerns questionnaire. Results show that the image capture only during food intake reduced privacy concerns from 5.0 ± 1.6 (somewhat concerned to concerned, continuous capture) to 1.9 ± 1.7 (not concerned, food only capture). Fig. 4 demonstrates the distribution of scores of privacy concerns.
Fig. 4.
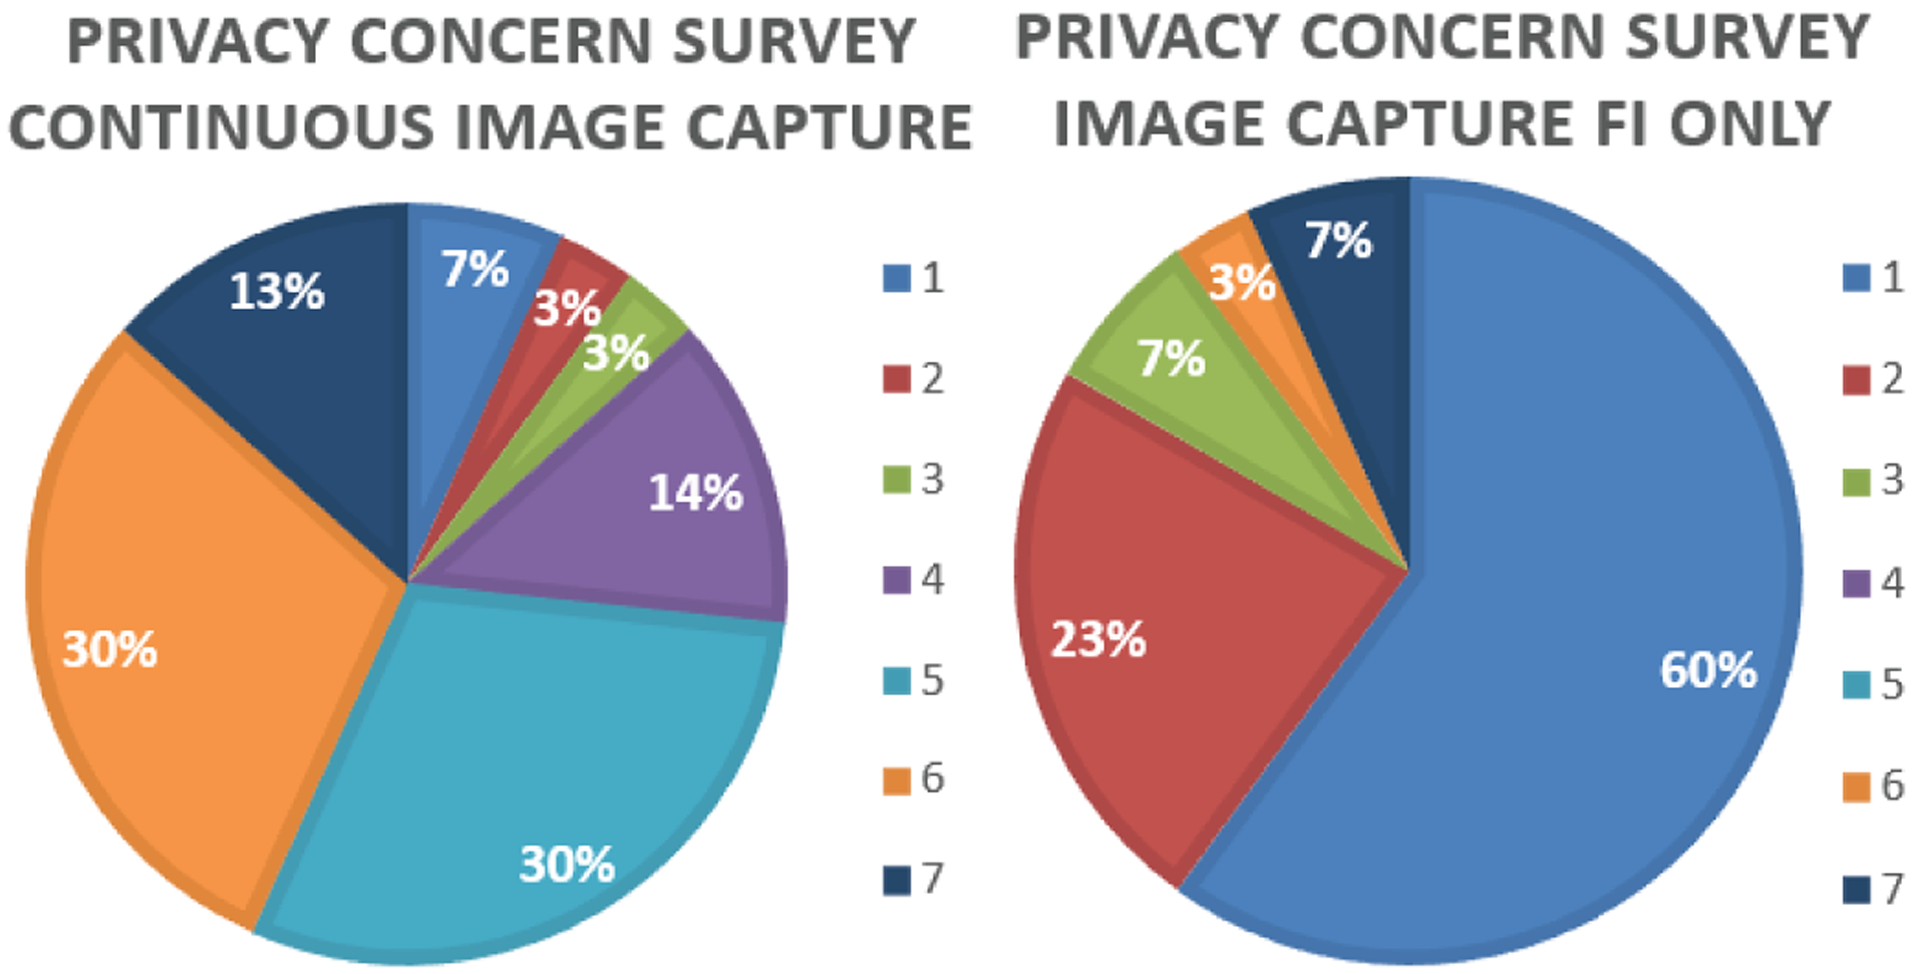
Level of privacy concerns for image capture.
Results of the non-parametric Friedman test shows that at least two number of eating episodes (N) computed from image-review (NIR), sensor-detection (NAIM2) and self-report (Nself) were significantly different (p-value <0.05). Post hoc Tukey–Kramer test exhibited that the NIR showed significant differences from both NAIM2 and Nself. No significant differences were found between NAIM2 and Nself.
IV. Discussions
The main objective of the present work was to develop and validate a wearable sensor system that automatically detects food intake and passively captures food images.
Following the main objective, this work first demonstrated the method for the detection of food intake in both laboratory and free-living settings. The best F-1 measure of 81.8% was obtained for the sensor fusion method in the laboratory environment. This result shows a good but not perfect match to the eating bouts self-reported by a foot pedal, which is expected. The results were also compared with a recent method proposed in [37] where the authors used a single accelerometer to detect chewing motion of elderly person. The average F1-score was found 59.1% on the current dataset. One potential reason of the low F1-score could be the target group since the method in [37] was developed on elderly individuals. Another possibility could be that the current study proposed the use of sensor fusion which led better performance compared to the method in [37]. Results suggest that the sensor fusion model achieved higher average F1-score (81.8%) compared to accelerometer only (76.7%) and flex only (64.8%) models.
In the free-living part, the performance was evaluated in terms of the eating episodes: NAIM2, NFP, NFN, EEpisol, EEpiliq. Table V shows that of on an average 97% of lab eating episodes and 76.1% of free-living eating episodes were correctly detected by AIM-2.
TABLE V.
Summary of eating episodes
| Day | NIR | NAIM2 | Acc (%) | NFN | NFNsol | NFNliq | NFP | Nself |
|---|---|---|---|---|---|---|---|---|
| 1 | 99 | 95 | 97.0* | 4 | 0 | 4 | 38 | 93 |
| 2 | 132 | 96 | 76.1* | 36 | 2 | 34 | 55 | 102 |
indicates average
Since the AIM-2 sensor detects chewing, the question is how well it recognizes the intake of liquids and solid foods. In laboratory eating episodes, AIM-2 recognized 100% of eating episodes that consisted of solid and semi-solid food items. In free-living eating episodes, the system failed to detect 2 eating episodes out of all eating episodes that consisted of solid and semi-solid food items. The food items in those two eating episodes were bread with milk and yogurt. The system failed to recognize 4 (out of 99 total) and 34 (out of 132 total) beverage consumption episodes in laboratory and free-living environment, respectively. Most of the beverage intake episodes were water consumption, with 8 episodes of wine, beer, and milk/juice consumption. Thus, some purely liquid/drinking episodes were not recognized, the fact which can attributed to use of chewing for food intake detection. However, the liquid episodes could be recognized by computer vision methods and our research group is working on merging computer vision and sensor-based detection in the upcoming work.
Results of the non-parametric Friedman test exhibited that NIR showed significant differences from both NAIM2 and Nself. The results are expected since the image-review detected some liquid episodes those were missed by the sensor and/or self-report.
This work explored an approach that significantly reduces the number of images to be analyzed by considering only the images where the sensors detected food intake event. Tables V show that during a typical day on an average of only ~5% images are food images. Apart from the number of images to be reviewed, the time required for review drastically reduces if only sensor-detected images are reviewed. On day-1, on an average 22 mins was spent to review 3,043 images. Similarly, the reviewer spent around 27 mins to review 2,975 images in day-2. When reviewing the images of food intake detection only in day-1, the required review time would be on an average 1.19 mins. Similarly, the review time in day-2 would be on an average 1.21 mins. Therefore it indicates the sensor would drastically save the review time and effort. The proposed method would also benefit method utilizing image recognition by limiting the number of false positives (foods in the image not being consumed). A combination of sensor-driven and image-driven food intake recognition presents an appealing direction for future development of the technology. Another advantage of the proposed sensor system is that unlike the “active” image capture methods, that use two images, before and after the eating episode, the proposed system provided images for the full duration of the eating episode, describing the eating episode progression and detecting food items that may not be added to the plate in the process of eating.
Given our state-of-the-art research setting and growing use of technology, protection of privacy for research participants is a great challenge. Any compromise in privacy concerns violates the basic rights of participants and potentially pose risk to participants. In this paper, the results from privacy concerns questionnaire bolster the fact that the majority of participants would feel more secure if the device captured images only during food intake.
The proposed system explores the potential to implement sensor-guided image capture. The results suggest that sensor-driven image capture may improve battery life and/or reduce the size of the battery by capturing images only during food intake. Another advantage of the proposed method is that the image review of allowed for validation of sensor-detected eating episodes.
A limitation of the presented system is that it couldn’t detect some of the solid/semi-solid and purely liquid food intake. The reason is that the sensor used in AIM-2 is detecting food intake by using chewing as a proxy. Chewing is not present during intake of some liquids, however, this does mean that all liquids are missed. Some liquids are consumed mixed with solids, some liquids (e.g. drinking through a straw) generate sucking jaw movements that are very close to that of chewing. A limitation of the study is that the accuracy of self-report using foot pedal was not evaluated formally due to significant time effort required. However, the self-report by the pedal has shown very good correlation with in-person observation of the eating bouts. Research is needed to investigate indicators of liquid consumption in the motion of the jaw. Unlike the self-reported methods, automatic detection methods may also introduce issues such as possible modifications of eating behaviours during food intake. Future works should investigate the alteration of eating behaviours during food intake. Finally, the evaluation of the images could be improved for future work (such as energy intake estimation) by capturing cooking episodes to figure out food contents (such as butter, sauces etc.) that are impossible to locate in the image.
V. Conclusion
In this paper, we propose a novel wearable sensor system that can detect eating instances and demonstrate the number of images can be reduced significantly by analyzing the images during food intake event only. In leave-one-subject-out cross-validation experiments, an average of 81.8% accuracy in food intake detection. Detection of most of the eating episodes and the number of food images compared to all captured images provide the promise to develop a sensor-triggered image capture system. Further works are needed to both implement the system and validate more participants in a free-living environment.
Acknowledgments
Research reported in this publication was supported by the National Institute of Diabetes and Digestive and Kidney Diseases of the National Institutes of Health under Award Number R01DK100796.
Biographies

Abul Doulah (S’11) received the bachelor’s degree in electrical engineering from the Bangladesh University of Professionals, Dhaka, Bangladesh, the master’s degree from Bangladesh University of Engineering and Technology and Ph.D. degree in electrical engineering from the University of Alabama, Tuscaloosa, AL, USA, in 2011, 2013 and 2018, respectively. Currently, he is an Assistant Professor in the Department of Electrical and Electronics Engineering at the University of Liberal Arts of Bangladesh, Dhaka, Bangladesh. His research interests include the development of wearable systems, signal analysis of sensors, and machine learning algorithms for preventive, diagnostic, and assistive health technology with a special focus on dietary intake monitoring.

Tonmoy Ghosh (S’14) received the B.Sc. and M.Sc. degree in electrical electronic engineering (EEE) from the Bangladesh University of Engineering and Technology (BUET), Dhaka, Bangladesh, in 2012 and 2015, respectively. Currently, He is doing his Ph.D. in the department of ECE at The University of Alabama, Tuscaloosa, USA. Prior to this, he was a Lecturer in EEE department at Pabna University of Science and Technology (PUST), Pabna, Bangladesh. His research interests include biomedical signal processing, signal and image processing, and medical imaging.

Delwar Hossain received the bachelor’s degree in electrical engineering from the Khulna University of Engineering and Technology, Khulna, Bangladesh, and currently pursuing Ph.D. degree in electrical engineering at the University of Alabama, Tuscaloosa, AL, USA. His research interests include the development of wearable systems, sensor networks, and machine learning algorithms for preventive, diagnostic, and assistive health technology with a special focus on physical activity and dietary intake monitoring.

Masudul H Imtiaz is currently a Post-Doctoral Fellow at the Department of Electrical and Computer Engineering at the University of Alabama, Tuscaloosa, AL, USA. In summer 2019, he received his Ph.D. degree from the University of Alabama majoring at Electrical Engineering. Previously, Masudul received the bachelor’s and master’s degree in Applied Physics, Electronics and Communication Engineering from the University of Dhaka, Bangladesh in 2010 and 2011, respectively. His research interests include the development of wearable systems, biomedical signal processing, pattern recognition, machine learning and deep learning algorithms for preventive, diagnostic, and assistive health technology with a special focus on physical activity and cigarette smoking monitoring.

Edward Sazonov (IEEE M’02, SM’11) received the Diploma of Systems Engineer from Khabarovsk State University of Technology, Russia, in 1993 and the Ph.D. degree in Computer Engineering from West Virginia University, Morgantown, WV, in 2002. Currently, he is a Professor in the Department of Electrical and Computer Engineering at the University of Alabama, Tuscaloosa, AL and the head of the Computer Laboratory of Ambient and Wearable Systems (http://claws.eng.ua.edu). His research interests span wearable devices, sensor-based behavioral informatics, and methods of biomedical signal processing and pattern recognition. Devices developed in his laboratory include a wearable sensor for objective detection and characterization of food intake; a highly accurate physical activity and gait monitor integrated into a shoe insole; a wearable sensor system for monitoring of cigarette smoking; and others. His research has been supported by the National Institutes of Health, National Science Foundation, National Academies of Science, as well as by state agencies, private industry, and foundations. Dr. Sazonov served as an Associate Editor for several IEEE publications.
Footnotes
Conflict of Interest
The authors declare that the research was conducted in the absence of any commercial or financial relationships that could be construed as a potential conflict of interest.
Contributor Information
Abul Doulah, The University of Alabama, Tuscaloosa, AL 35401 USA. He is now with the Department of Electrical and Electronics Engineering, University of Liberal Arts Bangladesh, Dhaka, Bangladesh..
Tonmoy Ghosh, Department of Electrical and Computer Engineering, The University of Alabama, Tuscaloosa, AL 35401 USA..
Delwar Hossain, Department of Electrical and Computer Engineering, The University of Alabama, Tuscaloosa, AL 35401 USA..
Masudul H Imtiaz, Department of Electrical and Computer Engineering, The University of Alabama, Tuscaloosa, AL 35401 USA..
Edward Sazonov, Department of Electrical and Computer Engineering, The University of Alabama, Tuscaloosa, AL 35401 USA..
References
- [1].Wilfley DE, Schwartz MB, Spurrell EB, and Fairburn CG, “Using the eating disorder examination to identify the specific psychopathology of binge eating disorder,” Int. J. Eat. Disord, vol. 27, no. 3, pp. 259–269, April. 2000. [DOI] [PubMed] [Google Scholar]
- [2].Fairburn CG, “Eating Disorders,” in eLS, John Wiley & Sons, Ltd, 2001. [Google Scholar]
- [3].De Castro JM, “Methodology, Correlational Analysis, and Interpretation of Diet Diary Records of the Food and Fluid Intake of Free-living Humans,” Appetite, vol. 23, no. 2, pp. 179–192, October. 1994, doi: 10.1006/appe.1994.1045. [DOI] [PubMed] [Google Scholar]
- [4].Day N, McKeown N, Wong M, Welch A, and Bingham S, “Epidemiological assessment of diet: a comparison of a 7-day diary with a food frequency questionnaire using urinary markers of nitrogen, potassium and sodium,” Int. J. Epidemiol, vol. 30, no. 2, pp. 309–317, April. 2001, doi: 10.1093/ije/30.2.309. [DOI] [PubMed] [Google Scholar]
- [5].Jonnalagadda SS et al. , “Accuracy of energy intake data estimated by a multiple-pass, 24-hour dietary recall technique,” J. Am. Diet. Assoc, vol. 100, no. 3, pp. 303–308; quiz 309–311, March. 2000. [DOI] [PubMed] [Google Scholar]
- [6].Schoeller DA, Bandini LG, and Dietz WH, “Inaccuracies in self-reported intake identified by comparison with the doubly labelled water method,” Can. J. Physiol. Pharmacol, vol. 68, no. 7, pp. 941–949, July. 1990. [DOI] [PubMed] [Google Scholar]
- [7].Doulah A et al. , “Meal Microstructure Characterization from Sensor-Based Food Intake Detection,” Front. Nutr, vol. 4, 2017, doi: 10.3389/fnut.2017.00031. [DOI] [PMC free article] [PubMed] [Google Scholar]
- [8].Fontana J and Sazonov E, “Detection and characterization of food intake by wearable sensors,” in Wearable Sensors: Fundamentals, Implementation and Applications, 1st edition., Academic Press, 2014, pp. 591–616. [Google Scholar]
- [9].Martin CK et al. , “Validity of the Remote Food Photography Method (RFPM) for Estimating Energy and Nutrient Intake in Near Real-Time,” Obesity, vol. 20, no. 4, pp. 891–899, December. 2011, doi: 10.1038/oby.2011.344. [DOI] [PMC free article] [PubMed] [Google Scholar]
- [10].Kong F and Tan J, “DietCam: Automatic dietary assessment with mobile camera phones,” Pervasive Mob. Comput, vol. 8, no. 1, pp. 147–163, February. 2012, doi: 10.1016/j.pmcj.2011.07.003. [DOI] [Google Scholar]
- [11].Fang S, Liu C, Zhu F, Delp EJ, and Boushey CJ, “Single-View Food Portion Estimation Based on Geometric Models,” in Proceedings of the IEEE International Symposium on Multimedia, Miami, Florida, 2015. [DOI] [PMC free article] [PubMed] [Google Scholar]
- [12].Zhu F, Bosch Ruiz M, Khanna N, Boushey C, and Delp E, “Multiple Hypotheses Image Segmentation and Classification with Application to Dietary Assessment,” IEEE J. Biomed. Health Inform, pp. 19(1):377–388, January. 2015, doi: 10.1109/JBHI.2014.2304925; [DOI] [PMC free article] [PubMed] [Google Scholar]
- [13].Myers A et al. , “Im2Calories: Towards an Automated Mobile Vision Food Diary,” in 2015 IEEE International Conference on Computer Vision (ICCV), 2015, pp. 1233–1241, doi: 10.1109/ICCV.2015.146. [DOI] [Google Scholar]
- [14].Rahman MH et al. , “Food Volume Estimation in a Mobile Phone Based Dietary Assessment System,” in 2012 Eighth International Conference on Signal Image Technology and Internet Based Systems, 2012, pp. 988–995, doi: 10.1109/SITIS.2012.146. [DOI] [Google Scholar]
- [15].Sun M et al. , “eButton: A Wearable Computer for Health Monitoring and Personal Assistance,” Proc. Des. Autom. Conf. Des. Autom. Conf, vol. 2014, pp. 1–6, 2014, doi: 10.1145/2593069.2596678. [DOI] [PMC free article] [PubMed] [Google Scholar]
- [16].Schrempft S, van Jaarsveld CH, and Fisher A, “Exploring the Potential of a Wearable Camera to Examine the Early Obesogenic Home Environment: Comparison of SenseCam Images to the Home Environment Interview,” J. Med. Internet Res, vol. 19, no. 10, October. 2017, doi: 10.2196/jmir.7748. [DOI] [PMC free article] [PubMed] [Google Scholar]
- [17].Jia W et al. , “Automatic food detection in egocentric images using artificial intelligence technology,” Public Health Nutr, pp. 1–12, March. 2018, doi: 10.1017/S1368980018000538. [DOI] [PMC free article] [PubMed] [Google Scholar]
- [18].Kelly P et al. , “An ethical framework for automated, wearable cameras in health behavior research,” Am. J. Prev. Med, vol. 44, no. 3, pp. 314–319, March. 2013, doi: 10.1016/j.amepre.2012.11.006. [DOI] [PubMed] [Google Scholar]
- [19].Dong Y, Hoover A, Scisco J, and Muth E, “A New Method for Measuring Meal Intake in Humans via Automated Wrist Motion Tracking,” Appl. Psychophysiol. Biofeedback, vol. 37, no. 3, pp. 205–215, September. 2012, doi: 10.1007/s10484-012-9194-1. [DOI] [PMC free article] [PubMed] [Google Scholar]
- [20].Dong Y, Scisco J, Wilson M, Muth E, and Hoover A, “Detecting periods of eating during free-living by tracking wrist motion,” IEEE J. Biomed. Health Inform, vol. 18, no. 4, pp. 1253–1260, July. 2014, doi: 10.1109/JBHI.2013.2282471. [DOI] [PubMed] [Google Scholar]
- [21].Kalantarian H and Sarrafzadeh M, “Audio-based detection and evaluation of eating behavior using the smartwatch platform,” Comput. Biol. Med, vol. 65, pp. 1–9, October. 2015, doi: 10.1016/j.compbiomed.2015.07.013. [DOI] [PubMed] [Google Scholar]
- [22].Thomaz E, Zhang C, Essa I, and Abowd GD, “Inferring Meal Eating Activities in Real World Settings from Ambient Sounds: A Feasibility Study,” IUI Int. Conf. Intell. User Interfaces Int. Conf. Intell. User Interfaces, vol. 2015, pp. 427–431, 2015, doi: 10.1145/2678025.2701405. [DOI] [PMC free article] [PubMed] [Google Scholar]
- [23].Amft O, “A wearable earpad sensor for chewing monitoring,” in 2010 IEEE Sensors, 2010, pp. 222–227, doi: 10.1109/ICSENS.2010.5690449. [DOI] [Google Scholar]
- [24].Thomaz E, Essa I, and Abowd GD, “A Practical Approach for Recognizing Eating Moments with Wrist-mounted Inertial Sensing,” in Proceedings of the 2015 ACM International Joint Conference on Pervasive and Ubiquitous Computing, New York, NY, USA, 2015, pp. 1029–1040, doi: 10.1145/2750858.2807545. [DOI] [PMC free article] [PubMed] [Google Scholar]
- [25].Shuzo M et al. , “Wearable Eating Habit Sensing System Using Internal Body Sound,” J. Adv. Mech. Des. Syst. Manuf, vol. 4, no. 1, pp. 158–166, 2010. [Google Scholar]
- [26].Päßler S and Fischer W-J, “Acoustical method for objective food intake monitoring using a wearable sensor system,” in 2011 5th International Conference on Pervasive Computing Technologies for Healthcare and Workshops, PervasiveHealth 2011, 2011, pp. 266–269. [Google Scholar]
- [27].Sazonov E and Fontana JM, “A Sensor System for Automatic Detection of Food Intake Through Non-Invasive Monitoring of Chewing,” IEEE Sens. J, vol. 12, no. 5, pp. 1340–1348, 2012, doi: 10.1109/JSEN.2011.2172411. [DOI] [PMC free article] [PubMed] [Google Scholar]
- [28].Fontana JM, Farooq M, and Sazonov E, “Automatic Ingestion Monitor: A Novel Wearable Device for Monitoring of Ingestive Behavior,” IEEE Trans. Biomed. Eng, vol. 61, no. 6, pp. 1772–1779, June. 2014, doi: 10.1109/TBME.2014.2306773. [DOI] [PMC free article] [PubMed] [Google Scholar]
- [29].Farooq M and Sazonov E, “Comparative testing of piezoelectric and printed strain sensors in characterization of chewing,” in 2015 37th Annual International Conference of the IEEE Engineering in Medicine and Biology Society (EMBC), 2015, pp. 7538–7541, doi: 10.1109/EMBC.2015.7320136. [DOI] [PubMed] [Google Scholar]
- [30].Bedri A, Verlekar A, Thomaz E, Avva V, and Starner T, “Detecting Mastication: A Wearable Approach,” in Proceedings of the 2015 ACM on International Conference on Multimodal Interaction, New York, NY, USA, 2015, pp. 247–250, doi: 10.1145/2818346.2820767. [DOI] [Google Scholar]
- [31].Fueki K, Sugiura T, Yoshida E, and Igarashi Y, “Association between food mixing ability and electromyographic activity of jaw-closing muscles during chewing of a wax cube,” J. Oral Rehabil, vol. 35, no. 5, pp. 345–352, May 2008, doi: 10.1111/j.1365-2842.2008.01849.x. [DOI] [PubMed] [Google Scholar]
- [32].Kohyama K, Hatakeyama E, Sasaki T, Azuma T, and Karita K, “Effect of sample thickness on bite force studied with a multiple-point sheet sensor,” J. Oral Rehabil, vol. 31, no. 4, pp. 327–334, April. 2004, doi: 10.1046/j.1365-2842.2003.01248.x. [DOI] [PubMed] [Google Scholar]
- [33].Bousdras VA et al. , “A novel approach to bite force measurements in a porcine model in vivo,” Int. J. Oral Maxillofac. Surg, vol. 35, no. 7, pp. 663–667, July. 2006, doi: 10.1016/j.ijom.2006.01.023. [DOI] [PubMed] [Google Scholar]
- [34].Fontana JM and Sazonov ES, “Evaluation of Chewing and Swallowing Sensors for Monitoring Ingestive Behavior,” Sens. Lett, vol. 11, no. 3, pp. 560–565, March. 2013, doi: 10.1166/sl.2013.2925. [DOI] [PMC free article] [PubMed] [Google Scholar]
- [35].Sazonov E et al. , “Non-invasive monitoring of chewing and swallowing for objective quantification of ingestive behavior,” Physiol. Meas, vol. 29, no. 5, pp. 525–541, May 2008, doi: 10.1088/0967-3334/29/5/001. [DOI] [PMC free article] [PubMed] [Google Scholar]
- [36].Makeyev O, Lopez-Meyer P, Schuckers S, Besio W, and Sazonov E, “Automatic food intake detection based on swallowing sounds,” Biomed. Signal Process. Control, vol. 7, no. 6, pp. 649–656, November. 2012, doi: 10.1016/j.bspc.2012.03.005. [DOI] [PMC free article] [PubMed] [Google Scholar]
- [37].Mertes G, Hallez H, Vanrumste B, and Croonenborghs T, “Detection of chewing motion in the elderly using a glasses mounted accelerometer in a real-life environment,” in 2017 39th Annual International Conference of the IEEE Engineering in Medicine and Biology Society (EMBC), 2017, pp. 4521–4524, doi: 10.1109/EMBC.2017.8037861. [DOI] [PubMed] [Google Scholar]
- [38].Farooq M and Sazonov E, “A Novel Wearable Device for Food Intake and Physical Activity Recognition,” Sensors, vol. 16, no. 7, p. 1067, July. 2016, doi: 10.3390/s16071067. [DOI] [PMC free article] [PubMed] [Google Scholar]
- [39].Farooq M and Sazonov E, “Accelerometer-Based Detection of Food Intake in Free-Living Individuals,” IEEE Sens. J, vol. 18, no. 9, pp. 3752–3758, May 2018, doi: 10.1109/JSEN.2018.2813996. [DOI] [PMC free article] [PubMed] [Google Scholar]
- [40].Liu J et al. , “An Intelligent Food-Intake Monitoring System Using Wearable Sensors,” in 2012 Ninth International Conference on Wearable and Implantable Body Sensor Networks, 2012, pp. 154–160, doi: 10.1109/BSN.2012.11. [DOI] [Google Scholar]
- [41].Sen S, Subbaraju V, Misra A, Balan RK, and Lee Y, “The case for smartwatch-based diet monitoring,” in 2015 IEEE International Conference on Pervasive Computing and Communication Workshops (PerCom Workshops), 2015, pp. 585–590, doi: 10.1109/PERCOMW.2015.7134103. [DOI] [Google Scholar]
- [42].Gemming L et al. , “Wearable cameras can reduce dietary under-reporting: doubly labelled water validation of a camera-assisted 24 h recall,” Br. J. Nutr, vol. 113, no. 2, pp. 284–291, January. 2015, doi: 10.1017/S0007114514003602. [DOI] [PubMed] [Google Scholar]
- [43].Farooq M and Sazonov E, “Automatic Measurement of Chew Count and Chewing Rate during Food Intake,” Electronics, vol. 5, no. 4, p. 62, September. 2016, doi: 10.3390/electronics5040062. [DOI] [PMC free article] [PubMed] [Google Scholar]
- [44].Farooq M and Sazonov E, “Segmentation and Characterization of Chewing Bouts by Monitoring Temporalis Muscle Using Smart Glasses with Piezoelectric Sensor,” IEEE J. Biomed. Health Inform, vol. PP, no. 99, pp. 1–1, 2016, doi: 10.1109/JBHI.2016.2640142. [DOI] [PMC free article] [PubMed] [Google Scholar]
- [45].Subar AF et al. , “The Automated Self-Administered 24-Hour Dietary Recall (ASA24): A Resource for Researchers, Clinicians and Educators from the National Cancer Institute,” J. Acad. Nutr. Diet, vol. 112, no. 8, pp. 1134–1137, August. 2012, doi: 10.1016/j.jand.2012.04.016. [DOI] [PMC free article] [PubMed] [Google Scholar]
- [46].“aTimeLogger 2 - mobile time tracking app | aLoggers.” [Online]. Available: http://www.atimelogger.com/. [Accessed: 18-Jun-2018].
- [47].“Food Processor Nutrition Analysis Software,” ESHA Research. [Online]. Available: https://www.esha.com/products/food-processor-nutrition-analysis-software/. [Accessed: 15-Jun-2018].
- [48].Po JMC, Kieser JA, Gallo LM, Tésenyi AJ, Herbison P, and Farella M, “Time-Frequency Analysis of Chewing Activity in the Natural Environment,” J. Dent. Res, vol. 90, no. 10, pp. 1206–1210, October. 2011, doi: 10.1177/0022034511416669. [DOI] [PubMed] [Google Scholar]
- [49].Peng H, Long F, and Ding C, “Feature selection based on mutual information criteria of max-dependency, max-relevance, and min-redundancy,” IEEE Trans. Pattern Anal. Mach. Intell, vol. 27, no. 8, pp. 1226–1238, August. 2005, doi: 10.1109/TPAMI.2005.159. [DOI] [PubMed] [Google Scholar]
- [50].Cortes C and Vapnik V, “Support-vector networks,” Mach. Learn, vol. 20, no. 3, pp. 273–297, 1995. [Google Scholar]
- [51].O. of the P. C. of Canada, “2016. Survey of Canadians on Privacy,” 26-Jan-2017. [Online]. Available: https://www.priv.gc.ca/en/opc-actions-and-decisions/research/explore-privacy-research/2016/por_2016_12/. [Accessed: 09-Jun-2018].