

Abstract
Background
Human cell division cycle associated 8 (CDCA8) a key regulator of mitosis, has been described as a potential prognostic biomarker for a variety of cancers, such as breast, colon and lung cancers. We aimed to evaluate the potential role of CDCA8 expression in the prognosis of liver cancer by analysing data from The Cancer Genome Atlas (TCGA).
Methods
The Wilcoxon rank-sum test was used to compare the difference in CDCA8 expression between liver cancer tissues and matched normal tissues. Then, we applied logistic regression and the Wilcoxon rank-sum test to identify the association between CDCA8 expression and clinicopathologic characteristics. Cox regression and the Kaplan–Meier method were used to examine the clinicopathologic features correlated with overall survival (OS) in patients from the TCGA. Gene set enrichment analysis (GSEA) was performed to explore possible mechanisms of CDCA8 according to the TCGA dataset.
Results
CDCA8 expression was higher in liver cancer tissues than in matched normal tissues. Logistic regression and the Wilcoxon rank-sum test revealed that the increased level of CDCA8 expression in liver cancer tissues was notably related to T stage (OR = 1.64 for T1/2 vs. T3/4), clinical stage (OR = 1.66 for I/II vs. III/IV), histologic grade (OR = 6.71 for G1 vs. G4) and histological type (OR = 0.24 for cholangiocarcinoma [CHOL] vs. hepatocellular carcinoma [LIHC]) (all P-values < 0.05). Kaplan–Meier survival analysis indicated that high CDCA8 expression was related to a poor prognosis in liver cancer (P = 2.456 × 10⁻⁶). Univariate analysis showed that high CDCA8 expression was associated with poor OS in liver cancer patients, with a hazard ratio (HR) of 1.85 (95% confidence interval [CI]: 1.47–2.32; P = 1.16 × 10⁻⁷). Multivariate analysis showed that CDCA8 expression was independently correlated with OS (HR = 1.74; CI: 1.25–12.64; P = 1.27 × 10⁻⁵). GSEA revealed that the apoptosis, cell cycle, ErbB, MAPK, mTOR, Notch, p53 and TGF-β signaling pathways were differentially enriched in the CDCA8 high expression phenotype.
Conclusions
High CDCA8 expression is a potential molecular predictor of a poor prognosis in liver cancer.
Keywords: CDCA8, Liver cancer, Prognosis, The Cancer Genome Atlas
Background
Primary liver cancer is the sixth most common malignant tumour and the mortality caused by liver cancer ranks fourth in the world [1, 2]. There are approximately 841,000 new cases and 782,000 deaths worldwide each year, with a survival duration of only 6–20 months without any intervention [3]. Currently, surgical resection is still the main treatment method for liver carcinoma. Although increasing progress has been made in the diagnosis and treatment of liver cancer, owing to the metastasis and recurrence of liver cancer, the 5-year survival rate of patients is less than 8% [4]. Thus, more effective or novel tumour biomarkers that can be used to accurately diagnose and better predict prognosis in liver cancer are urgently needed.
The CDCA8 gene encodes the Borealin/Dasra B protein and is a component of the chromosome passenger complex (CPC). The CPC is an important dynamic structure during cell division and consists of four parts: INCENP, Survivin, Aurora B and Borealin/Dasra B [5]. CDCA8 plays critical roles in locating the CPC to the centromere, correcting kinetochore binding errors, and stabilizing bipolar spindles [6, 7]. Previous studies have reported CDCA8 overexpression contributes to the proliferation of tumour cells, such as colorectal cancer and lung cancer cells [8, 9]. In addition, high CDCA8 expression was found to represent a poor prognosis for gastric cancer [10]. However, the relationship between CDCA8 expression and clinicopathological parameters in liver cancer is unclear.
In this study, we sought to use existing data from the TCGA to assess the value of CDCA8 expression in liver cancer prognosis. Then, GSEA was performed to elucidate the biological pathways regulated by CDCA8 that are involved in the pathogenesis of liver cancer. Ultimately, our results showed that increased CDCA8 expression correlated with a poor prognosis in liver cancer. GSEA also indicated that the CDCA8 high expression phenotype was related to the apoptosis, cell cycle, ErbB, MAPK, mTOR, Notch, p53 and TGF-β signaling pathways. We may find a novel biomarker of prognosis and potential molecular mechanisms that affect prognosis in liver cancer.
Methods
Data mining the TCGA database
CDCA8 expression data (418 samples, Workflow Type: HTSeq-Counts) and corresponding clinical characteristic data were extracted from the official website of the TCGA liver cancer cohort (https://cancergenome.nih.gov/). In this study, we obtained the genomic expression information of CDCA8 that was calculated by high-throughput sequencing from the TCGA database. Ethical approval was not required, as all are publicly available. After excluding normal liver tissues (58 samples), the expression differences according to discrete variables were visualized using boxplots [11]. Eventually, R software (version 3.5.1) was used to further analyse the RNA-Seq gene expression HTSeq-Counts data of liver cancer patients and clinical data.
Gene set enrichment analysis (GSEA)
In the present research, the gene set “c2.cp.kegg.v6.2.symbols.gmt”, which served as a reference gene set, was downloaded from the Molecular Signatures Database (MSigDB) (http://software.broadinstitute.org/gsea/msigdb). We performed GSEA to reveal significant survival differences between the high and low CDCA8 expression groups. Gene set arrangements were repeated 1,000 times for each analysis, and the expression level of CDCA8 was treated as a phenotype label. We used the nominal P-value and normalized enrichment score (NES) to analyse pathway enrichment. The NES, enrichment score (ES), false discovery rate (FDR) and P-value were considered four key statistics in the GSEA. A gene set was considered significantly enriched when the P-value was less than 0.05 and the FDR was less than 0.25.
Statistical analysis
Statistical analysis was performed using R (v.3.5.1). The Wilcoxon rank-sum test was used to compare the expression of CDCA8 between the liver cancer and normal groups. We performed the Wilcoxon signed-rank test and logistic regression to estimate the relationship between CDCA8 and clinicopathological variables. Subjects were divided into two groups according to the median value of gene expression, and patients with incomplete clinical data were excluded. We used Kaplan–Meier analysis to compare OS between the high and low CDCA8 expression groups. Cox regression and the Kaplan–Meier method were used to examine the clinicopathological features correlated with OS in patients from the TCGA. P < 0.05 was considered statistically significant.
Results
Clinical characteristics of liver cancer patients in the TCGA
The characteristics of 418 patients with liver cancer, including sex, TNM classification, clinical stage, histological type, histologic grade, race, and vital status, were downloaded from the TCGA database (Table 1). In our study cohort, the median age at diagnosis was 61 years and ranged from 16 to 90 years. The median follow-up for subjects alive at last contact was 419 days and ranged from 0 to 3258 days.
Table 1.
TCGA liver cancer patient characteristics
| Characteristics | Number of sample, n (%) | |
|---|---|---|
| n | Percentage (%) | |
| Age (years) | ||
| ≤ 61 | 195 | 46.65 |
| > 61 | 181 | 43.30 |
| Unknown | 42 | 10.05 |
| Gender | ||
| Male | 272 | 65.07 |
| Female | 146 | 34.93 |
| T stage | ||
| T1 | 204 | 48.80 |
| T2 | 107 | 25.60 |
| T3 | 90 | 21.53 |
| T4 | 14 | 3.35 |
| TX | 1 | 0.24 |
| Unknown | 2 | 0.48 |
| N stage | ||
| N0 | 290 | 69.38 |
| N1 | 8 | 1.91 |
| NX | 119 | 28.47 |
| M stage | ||
| MO | 303 | 72.49 |
| M1 | 8 | 1.91 |
| MX | 107 | 25.60 |
| Stage | ||
| I | 194 | 46.41 |
| II | 98 | 23.44 |
| III | 90 | 21.53 |
| IV | 12 | 2.87 |
| Unknown | 24 | 5.74 |
| Histologic grade | ||
| G1 | 55 | 13.16 |
| G2 | 180 | 43.06 |
| G3 | 124 | 29.67 |
| G4 | 13 | 3.11 |
| Unknown | 46 | 11.00 |
| Histological type | ||
| LIHC | 377 | 90.41 |
| CHOL | 41 | 9.59 |
| Vital status | ||
| Living | 271 | 64.83 |
| Deceased | 147 | 35.17 |
| Race | ||
| White | 222 | 53.11% |
| Not white | 186 | 44.50% |
| Unknown | 10 | 2.39% |
| Total | 418 | 100.00% |
LIHC Liver hepatocellular carcinoma, CHOL Cholangiocarcinoma, TCGA The Cancer Genome Atlas
CDCA8 is highly expressed in liver cancer tissues
We used the Wilcoxon-rank sum test to analyse the relationship between CDCA8 expression and different tissue characteristics, and the results showed that CDCA8 expression was significantly higher in liver cancer tissues than in normal tissues (P = 1.724 × 10⁻³²) (Fig. 1a). Subsequently, we used the Wilcoxon signed-rank test to determine CDCA8 expression in 57 liver cancer tissues and matched adjacent normal tissues. CDCA8 expression was significantly lower in normal tissues than in cancer tissues (P = 1.794 × 10⁻¹⁹)(Fig. 1b).
Fig. 1.
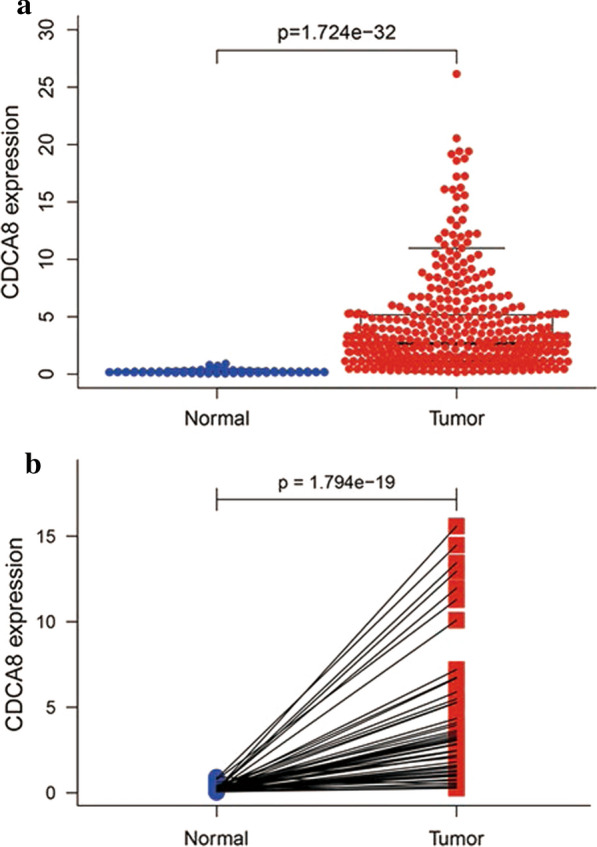
CDCA8 expression is significantly higher in liver cancer tissues than in adjacent normal tissues. a CDCA8 expression was significantly higher in cancer tissues than in normal tissues (P = 1.724e−32). b CDCA8 expression was significantly higher in liver cancer tissues (P = 1.794e−19) than in 50 paired noncancerous adjacent tissues (Wilcoxon signed-rank test)
Relationships between CDCA8 expression and clinicopathological variables in liver cancer patients
Logistic regression and the Wilcoxon rank-sum test revealed that the upregulation of CDCA8 was obviously correlated with T stage (P = 7.446 × 10⁻⁴), clinical stage (P = 0.002), histologic grade (P = 8.881 × 10⁻⁸) and histological type (P = 0.006), as shown in Fig. 2. Afterward, univariate analysis using logistic regression was adopted to analyse the relationship between CDCA8 expression (based on a median expression value of 2.64) and poor clinicopathologic variables. These results showed that high CDCA8 expression was notably correlated with T stage (OR = 1.64 for T1/2 vs. T3/4), clinical stage (OR = 1.66 for I/II vs. III/IV), a high histologic grade (OR = 6.71 for G1 vs. G4), and histological type (OR = 0.24 for CHOL vs. LIHC) (Table 2), indicating that compared with patients with low CDCA8 expression, those with high CDCA8 expression tend to have a more advanced stage.
Fig. 2.

Relationship between CDCA8 expression and clinicopathological characteristics. a–c TNM classification, d clinical stage, e age, f sex, g histologic grade, h histological type, and i race. LIHC, liver hepatocellular carcinoma; CHOL, cholangiocarcinoma; TCGA, The Cancer Genome Atlas; T, topography distribution; N, lymph node metastasis; M, distant metastasis
Table 2.
CDCA8 expression correlated with clinical pathological characteristics (logistic regression)
| Clinical characteristics | Total (N) | Odds ratio in CDCA8 expression | P-value |
|---|---|---|---|
| T stage (T1/2 vs. T3/4 ) | 415 | 1.64 (1.03–2.62) | 0.035 |
| N stage (N0 vs. N1 ) | 298 | 3.11 (0.70-21.48) | 0.169 |
| M stage (M0 vs. M1 ) | 311 | 0.74 (0.14–3.44) | 0.703 |
| Clinical stage (I/II vs. III/IV) | 394 | 1.66 (1.04–2.67) | 0.034 |
| Age (≤ 61 vs.> 61) | 376 | 1.30 (0.86–1.95) | 0.212 |
| Gender (Female vs. Male) | 418 | 0.70 (0.47–1.06) | 0.095 |
| Histologic grade (G1 vs.G4) | 68 | 6.71 (1.76–33.18) | 0.009 |
| Histological type (CHOL vs. LIHC) | 418 | 0.24 (0.10–0.54) | 0.001 |
| Race (Not white vs. White) | 408 | 0.88 (0.594–1.31) | 0.544 |
Categorical dependent variable, greater or less than the median expression level. Italic represents P‑values < 0.005. LIHC, Liver hepatocellular carcinoma; CHOL, Cholangiocarcinoma; T, topography distribution; N, lymph node metastasis; M, distant metastasis
CDCA8 may be an independent predictor of prognosis in liver cancer
Kaplan–Meier survival analysis was performed to examine the role of CDCA8 expression in predicting the prognosis of liver cancer patients. The results showed that patients with high CDCA8 expression experienced a shorter OS duration than those with low CDCA8 expression (P = 2.456 × 10⁻⁶)(Fig. 3a). Accordingly, we assessed the prognostic variables correlated with OS using univariate and multivariate Cox regression analyses (Table 3). The univariate Cox model revealed that high CDCA8 expression was strongly associated with worse OS (HR = 1.85; 95% CI: 1.47–2.32; P = 1.16 × 10⁻⁷), as was clinical stage and T classification. As shown in Fig. 3b, high CDCA8 expression was the only independent prognostic factor associated with OS (HR = 1.74; 95% CI: 1.36–2.23; P = 1.27 × 10⁻⁵) in the multivariate analysis.
Fig. 3.

Survival outcomes and multivariate analysis. a The effect of CDCA8 expression on overall survival in liver cancer patients in the TCGA cohort. The median score was used to divide patients into high expression and low expression groups. b A forest map of the results of the multivariate analysis. T, topography distribution; N, lymph node metastasis; M, distant metastasis
Table 3.
Univariate analysis and multivariate analysis of liver cancer patients overall survival
| Characteristics | Univariate analysis | Multivariate analysis | ||||
|---|---|---|---|---|---|---|
| HR | 95 % CI | P | HR | 95 % CI | P | |
| T stage | 1.8 | 1.43–2.27 | 4.73 × 1− 7 | 1.39 | 0.58–3.35 | 0.466 |
| N stage | 2.02 | 0.49–8.28 | 0.328 | |||
| M stage | 3.85 | 1.21–12.28 | 0.022 | |||
| Clinical stage | 1.86 | 1.46–2.39 | 8.06 × 10⁻⁷ | 1.13 | 0.43–2.99 | 0.804 |
| Age | 1.00 | 0.99–1.02 | 0.591 | |||
| Gender | 0.78 | 0.49–1.25 | 0.301 | |||
| Histologic grade | 1.02 | 0.75–1.39 | 0.914 | |||
| CDCA8 | 1.85 | 1.47–2.32 | 1.16 × 10− 7 | 1.74 | 1.36–2.23 | 1.27 × 10⁻⁵ |
Italic values indicate P‑values < 0.05, HR, hazard ratio; CI, confidence interval; T, topography distribution; N, lymph node metastasis; M, distant metastasis
CDCA8-related signaling pathways according to GSEA
The GSEA results showed significant differences between the high and low CDCA8 expression datasets based on the MSigDB enrichment analysis (c2.cp.kegg.v6.2.symbols.gmt). In the high CDCA8 expression phenotype, the eight most significantly enriched signaling pathways (selected according to the NES) were the apoptosis, cell cycle, ErbB, MAPK, mTOR, Notch, p53 and TGF-β signaling pathways (Fig. 4, Table 4).
Fig. 4.

Enrichment plots from the gene set enrichment analysis (GSEA). GSEA results showing the apoptosis (a), cell cycle (b), ErbB signaling pathway (c), MAPK signaling pathway (d), mTOR signaling pathway (e), Notch signaling pathway (f), p53 signaling pathway (g),and TGF-beta signaling pathway (h). Multiple GSEA enrichment plots (i) of genes that are differentially enriched in CDCA8-related liver cancer. NES, normalized enrichment score; ES, enrichment score; FDR, false discovery rate
Table 4.
Gene sets enriched in the high CDCA8 expression phenotype
| Gene set name | ES | NES | NOM P-val | FDR Q-val |
|---|---|---|---|---|
| KEGG_CELL_CYCLE | 0.778 | 2.219 | 0.000 | 0.000 |
| KEGG_P53_SIGNALING_PATHWAY | 0.588 | 1.894 | 0.000 | 0.009 |
| KEGG_MTOR_SIGNALING_PATHWAY | 0.636 | 1.874 | 0.000 | 0.009 |
| KEGG_ERBB_SIGNALING_PATHWAY | 0.600 | 1.848 | 0.000 | 0.011 |
| KEGG_TGF_BETA_SIGNALING_PATHWAY | 0.575 | 1.829 | 0.000 | 0.013 |
| KEGG_NOTCH_SIGNALING_PATHWAY | 0.621 | 1.822 | 0.000 | 0.013 |
| KEGG_APOPTOSIS | 0.561 | 1.782 | 0.006 | 0.019 |
| KEGG_MAPK_SIGNALING_PATHWAY | 0.501 | 1.764 | 0.002 | 0.021 |
Gene sets with NOM P-value < 0.05 and FDR Q-value < 0.25 were considered significant ES, enrichment score; NES, normalized enrichment score; NOM, nominal; FDR, false discovery rate
Discussion
CDCA8 is a critical regulatory gene in mitosis. It plays an important role in different types of cancer, (e.g., promoting cell proliferation and invasion) and may act as an oncogene [12, 13]. Previous studies have reported the increased transcriptional activity of CDCA8 in embryos, embryonic stem cells and cancer cells however, CDCA8 is not expressed or is very weakly expressed in normal tissues [14]. Thus, the aberrant expression of CDCA8 is strongly associated with cancer pathogenesis. Li et al. showed that CDCA8 encodes the protein Borealin/Dasra B, which plays a critical role in regulating postnatal liver development, damage-induced hepatic progenitor-like cell regeneration, and liver tumorigenesis in mice [15]. These results suggest that CDCA8 may impact the occurrence and progression of related liver diseases by modulating the function of the CPC in mitosis. However, only a few studies have explored the association between CDCA8 and hepatitis, cirrhosis, and liver cancer. Our current study focused on the prognostic value of CDCA8 in liver cancer.
Previous studies have reported that upregulated CDCA8 expression plays an important role in malignant transformation, cancer growth and progression. Yu et al. showed that CDCA8 induces tamoxifen resistance and promotes cell proliferation by inhibiting cell apoptosis and promoting cell cycle progression in breast cancer cells [16]. Ci et al. demonstrated that CDCA8 knockdown inhibited cell proliferation, migration, and invasion in cutaneous melanoma cells via the Rho-associated coiled-coil-containing protein kinase (ROCK) signaling pathway [12]. Furthermore, CDCA8 knockdown also inhibits cell proliferation and promotes cell differentiation in lung cancer, colorectal cancer, and human embryonic stem cells [8, 9, 17]. As described in the above studies, high CDCA8 expression plays a key role in many types of cancer. Recently, an increasing number of studies have examined CDCA8 as a potential prognostic marker. Gu et al. performed RNA-Seq data analysis and found that CDCA8 is a prognostic gene in kidney renal clear cell carcinoma [18]. In addition, Ci et al. demonstrated that the overall survival of cutaneous melanoma patients with high CDCA8 expression was significantly lower than that of patients with low expression, suggesting CDCA8 as an independent predictor of prognosis in cutaneous melanoma [12]. Similar findings were previously observed in gastric cancer, lung cancer, breast cancer, and colorectal cancer [10, 19]. Consistent with these findings, our findings revealed that CDCA8 expression was significantly upregulated in liver cancer tissues compared to matched normal tissues, indicating that the high expression of CDCA8 is associated with the development of liver cancer. In addition, the increased levels of CDCA8 expression in liver tissues were associated with an advanced T stage, an advanced clinical stage, a high histological grade, histological type and poor overall survival, suggesting that CDCA8 is closely related to the malignant degree of liver cancer and predicts a poor prognosis for liver cancer. Cox model analysis demonstrated that high CDCA8 expression was an independent prognostic factor in liver cancer, highlighting that CDCA8 may be a potential biomarker for liver cancer prognosis.
In this study, we found that the CDCA8 high expression phenotype was associated with the apoptosis, cell cycle, ErbB, MAPK, mTOR, Notch, p53 and TGF-β signaling pathways by GSEA. These pathways have been reported to be associated with the tumorigenesis, development and malignant phenotype of several cancers. Recently, many studies have shown that the occurrence and development of liver cancer involves the deregulation of several cellular signaling pathways. For instance, abnormal P53 expression is associated with concurrent acetylation and methylation at H3K27, which is associated with a more aggressive liver cancer cell tumour phenotype [20]. Liu et al. study showed that targeting the MAPK pathway has additive and synergistic effects when with other pathways important for liver cancer cell proliferation, such as the mammalian target of rapamycin (mTOR) and Wnt/β-catenin pathways [21]. The natural compound psilostachyin-A exerts its cytotoxic effects on liver cancer by blocking the ERK/MAPK pathway [22]. In addition, overexpression and aberrant signaling of the ErbB family of receptors have been implicated in liver cancer, but the mechanisms underlying ErbB overexpression are unclear [23]. Thus, these results indicate that CDCA8 promotes cell growth and cancer metastasis and leads to poor survival in liver cancer patients through the above signaling pathways, and that CDCA8 could serve as a new therapeutic target and prognostic marker in liver cancer. Further study is needed to elucidate the regulatory mechanisms.
Therefore, CDCA8 overexpression is involved in the pathogenesis of several cancers and has potential value as a prognostic biomarker for liver cancer. However, our study still has some limitations. To fully elucidate the specific role of CDCA8 in liver cancer, various clinical factors should be considered. Another limitation is the lack of such information or inconsistent data collection processes because the data were collected in different laboratories. Additionally, the data we analysed were derived from only a single public database. Hence, to avoid analysis bias caused by the retrospective nature of the current study, we should conduct prospective studies in the future. Finally, the current research is based on high-throughput gene sequencing data from the TCGA database. Therefore, we could not assay the expression of CDCA8 with a single cell-based strategy, nor could we clearly assess the direct mechanism by which CDCA8 is involved in the development of liver cancer. Therefore, further research, such as cell-based protein expression assays, is necessary to detect heterogeneity, and we will continue working hard to explore the direct mechanism of liver cancer.
Conclusions
In conclusion, we found that the level of CDCA8 expression was increased in liver cancer tissues and associated with a poor prognosis, suggesting that CDCA8 may be a potential prognostic molecular predictor for liver cancer patients. Moreover, the apoptosis, cell cycle, ErbB, MAPK, mTOR, Notch, p53 and TGF-β signaling pathways may be related signaling pathways regulated by CDCA8 in liver cancer.
Supplementary Information
Additional file 1: Table S1. Characteristics of all patients with liver cancer from the TCGA database. Clinicopathological features of all liver cancer patients from the TCGA database.
Additional file 2: Table S2. Expression of CDCA8 in normal tissues and liver cancer tissues.CDCA8 expression is significantly higher in liver cancer tissues than in matched to normal tissues tissues in the TCGA dataset.
Additional file 3: Table S3. Kaplan–Meier survival analyses for OS analysis in liver cancer patients. Kaplan–Meier survival analysis was used to compare OS in liver cancer patients in the high and low CDCA8 expression groups in liver cancer patients.
Acknowledgements
The results shown here are in whole or part based upon data generated by the TCGA Research Network: http://cancergenome.nih.gov/..
Abbreviations
- CDCA8
Cell division cycle associated 8
- TCGA
The Cancer Genome Atlas
- OS
Overall survival
- CHOL
Cholangiocarcinoma
- LIHC
Hepatocellular carcinoma
- HR
Hazard ratio
- CI
Confidence interval
- GSEA
Gene set enrichment analysis
- CPC
Chromosome passenger complex
- MSigDB
Molecular Signatures Database
- NES
Normalized enrichment score
- ES
Enrichment score
- FDR
False discovery rate
Authors’ contributions
GZ and YS conceived and designed the experiments. YS performed the experiments and analyzed the data. YS, EF, GF, QZ and QC participated with editing the drafted manuscript and submission of the article. All authors read and approved the final manuscript.
Funding
This work was supported by the National Natural Science Foundation of China (No. 81260370).
Availability of data and materials
Data and materials of this work are available from the corresponding author on reasonable request.
Declarations
Ethics approval and consent to participate
Not applicable.
Consent for publication
Not applicable.
Competing interests
The authors declare no conflict of interest.
Footnotes
Publisher’s note
Springer Nature remains neutral with regard to jurisdictional claims in published maps and institutional affiliations.
Contributor Information
Yu Shuai, Email: 846303135@qq.com.
Erxi Fan, Email: 2608472239@qq.com.
Qiuyue Zhong, Email: 2363905489@qq.com.
Qiying Chen, Email: 1179431204@qq.com.
Guangyong Feng, Email: 576976592@qq.com.
Xiaoxia Gou, Email: angela7695@163.com.
Guihai Zhang, Email: zghzhuhai@163.com.
Supplementary Information
The online version contains supplementary material available at 10.1186/s12935-021-01850-x.
References
- 1.Bray F, Ferlay J, Soerjomataram I, et al. Global cancer statistics 2018: GLOBOCAN estimates of incidence and mortality worldwide for 36 cancers in 185 countries. Cancer J Clin. 2018;68(6):394–424. doi: 10.3322/caac.21492. [DOI] [PubMed] [Google Scholar]
- 2.Liu XN, Wang S, Yang Q, et al. ESC reverses epithelial mesenchymal transition induced by transforming growth factor-β via inhibition of Smad signal pathway in HepG2 liver cancer cells. Cancer Cell Int. 2015;15:114. doi: 10.1186/s12935-015-0265-2. [DOI] [PMC free article] [PubMed] [Google Scholar]
- 3.Yan H, Li Z, Shen Q, Wang Q, et al. Aberrant expression of cell cycle and material metabolism related genes contributes to hepatocellular carcinoma occurrence. Pathol Res Pract. 2017;213(4):316–21. doi: 10.1016/j.prp.2017.01.019. [DOI] [PubMed] [Google Scholar]
- 4.Li K, Wang HT, He YK, et al. New idea for treatment strategies for Barcelona Clinic Liver Cancer stages based on a network meta-analysis. Medicine. 2017;96(20):e6950. doi: 10.1097/MD.0000000000006950. [DOI] [PMC free article] [PubMed] [Google Scholar]
- 5.Carmena M, Wheelock M, Funabiki H, et al. The chromosomal passenger complex (CPC): from easy rider to the godfather of mitosis. Nat Rev Mol Cell Biol. 2012;13(12):789–803. doi: 10.1038/nrm3474. [DOI] [PMC free article] [PubMed] [Google Scholar]
- 6.Gassmann R, Carvalho A, Henzing AJ, et al. Borealin: a novel chromosomal passenger required for stability of the bipolar mitotic spindle. J Cell Biol. 2004;166(2):179–91. doi: 10.1083/jcb.200404001. [DOI] [PMC free article] [PubMed] [Google Scholar]
- 7.Sampath SC, Ohi R, Leismann O, et al. The chromosomal passenger complex is required for chromatin-induced microtubule stabilization and spindle assembly. Cell. 2004;118(2):187–202. doi: 10.1016/j.cell.2004.06.026. [DOI] [PubMed] [Google Scholar]
- 8.Hayama S, Daigo Y, Yamabuki T, et al. Phosphorylation and activation of cell division cycle associated 8 by aurora kinase B plays a significant role in human lung carcinogenesis. Cancer Res. 2007;67(9):4113–22. doi: 10.1158/0008-5472.CAN-06-4705. [DOI] [PubMed] [Google Scholar]
- 9.Wang Y, Zhao Z, Bao X, et al. Borealin/Dasra B is overexpressed in colorectal cancers and contributes to proliferation of cancer cells. Med Oncol (Northwood Lond Engl) 2014;31(11):248. doi: 10.1007/s12032-014-0248-5. [DOI] [PubMed] [Google Scholar]
- 10.Chang JL, Chen TH, Wang CF, et al. Borealin/Dasra B is a cell cycle-regulated chromosomal passenger protein and its nuclear accumulation is linked to poor prognosis for human gastric cancer. Exp Cell Res. 2006;312(7):962–73. doi: 10.1016/j.yexcr.2005.12.015. [DOI] [PubMed] [Google Scholar]
- 11.Chang JL, Chen TH, Wang CF, et al. Automated multigroup outlier identification in molecular high-throughput data using bagplots and gemplots. BMC Bioinform. 2017;18(1):232. doi: 10.1186/s12859-017-1645-5. [DOI] [PMC free article] [PubMed] [Google Scholar]
- 12.Ci C, Tang B, Lyu D, et al. Overexpression of CDCA8 promotes the malignant progression of cutaneous melanoma and leads to poor prognosis. Int J Mol Med. 2019;43(1):404–12. doi: 10.3892/ijmm.2018.3985. [DOI] [PMC free article] [PubMed] [Google Scholar]
- 13.Bi Y, Chen S, Jiang J, et al. CDCA8 expression and its clinical relevance in patients with bladder cancer. Medicine. 2018;497(34):e11899. doi: 10.1097/MD.0000000000011899. [DOI] [PMC free article] [PubMed] [Google Scholar]
- 14.Marko NF, Weil RJ, Schroeder JL, et al. Extent of resection of glioblastoma revisited: personalized survival modeling facilitates more accurate survival prediction and supports a maximum-safe-resection approach to surgery. J Clin Oncol. 2014;32(8):774–82. doi: 10.1200/JCO.2013.51.8886. [DOI] [PMC free article] [PubMed] [Google Scholar]
- 15.Li L, Li D, Tian F, et al. Hepatic Loss of Borealin Impairs Postnatal Liver Development, Regeneration, and Hepatocarcinogenesis. J Biol Chem. 2016;291(40):21137–47. doi: 10.1074/jbc.M116.736173. [DOI] [PMC free article] [PubMed] [Google Scholar]
- 16.Yu D, Shi L, Bu Y, et al. Cell division cycle associated 8 is a key regulator of tamoxifen resistance in breast cancer. J Breast Cancer. 2019;22(2):237–47. doi: 10.4048/jbc.2019.22.e29. [DOI] [PMC free article] [PubMed] [Google Scholar]
- 17.Dai C, Miao CX, Xu XM, et al. Transcriptional activation of human CDCA8 gene regulated by transcription factor NF-Y in embryonic stem cells and cancer cells. J Biol Chem. 2015;290(37):22423–34. doi: 10.1074/jbc.M115.642710. [DOI] [PMC free article] [PubMed] [Google Scholar]
- 18.Gu Y, Lu L, Wu L, Chen H, et al. Identification of prognostic genes in kidney renal clear cell carcinoma by RNA–seq data analysis. Mol Med Rep. 2017;15(4):1661–7. doi: 10.3892/mmr.2017.6194. [DOI] [PMC free article] [PubMed] [Google Scholar]
- 19.Bu Y, Shi L, Yu D, et al. CDCA8 is a key mediator of estrogen-stimulated cell proliferation in breast cancer cells. Gene. 2019;703:1–6. doi: 10.1016/j.gene.2019.04.006. [DOI] [PubMed] [Google Scholar]
- 20.Hayashi A, Yamauchi N, Shibahara J, et al. Concurrent activation of acetylation and tri-methylation of H3K27 in a subset of hepatocellular carcinoma with aggressive behavior. PLoS ONE. 2014;9(3):e91330. doi: 10.1371/journal.pone.0091330. [DOI] [PMC free article] [PubMed] [Google Scholar]
- 21.Gedaly R, Angulo P, Hundley J, et al. PI-103 and sorafenib inhibit hepatocellular carcinoma cell proliferation by blocking Ras/Raf/MAPK and PI3K/AKT/mTOR pathways. Anticancer Res. 2010;30(12):4951–8. [PMC free article] [PubMed] [Google Scholar]
- 22.Liu J, Liu Y, Liu Y, Huang L, et al. Anticancer action of psilostachyin-A in 5-fluorouracil-resistant human liver carcinoma are mediated through autophagy induction, G2/M phase cell cycle arrest and inhibiting. Med Sci Monitor. 2019;25:6711–8. doi: 10.12659/MSM.916635. [DOI] [PMC free article] [PubMed] [Google Scholar] [Retracted]
- 23.Shao X, Lu Q, Wang G, et al. Reduced expression of Nrdp1 predicts a poor prognosis in human hepatocellular carcinoma. OncoTargets Ther. 2018;11:4955–63. doi: 10.2147/OTT.S160638. [DOI] [PMC free article] [PubMed] [Google Scholar]
Associated Data
This section collects any data citations, data availability statements, or supplementary materials included in this article.
Supplementary Materials
Additional file 1: Table S1. Characteristics of all patients with liver cancer from the TCGA database. Clinicopathological features of all liver cancer patients from the TCGA database.
Additional file 2: Table S2. Expression of CDCA8 in normal tissues and liver cancer tissues.CDCA8 expression is significantly higher in liver cancer tissues than in matched to normal tissues tissues in the TCGA dataset.
Additional file 3: Table S3. Kaplan–Meier survival analyses for OS analysis in liver cancer patients. Kaplan–Meier survival analysis was used to compare OS in liver cancer patients in the high and low CDCA8 expression groups in liver cancer patients.
Data Availability Statement
Data and materials of this work are available from the corresponding author on reasonable request.