

Abstract
Background
The effect of sarcopenia based on the total psoas muscle area (TPMA) on CT is inconclusive in patients undergoing abdominal aortic aneurysm (AAA) intervention. The aim of this prospective cohort study was to evaluate morphometric sarcopenia as a method of risk stratification in patients undergoing elective AAA intervention.
Methods
TPMA was measured on preintervention CT images of patients undergoing elective endovascular aneurysm repair (EVAR) or open aneurysm repair. Mortality was assessed in relation to preintervention TPMA using Cox regression analysis, with calculation of hazard ratios at 30 days, 1 year and 4 years. Postintervention morbidity was evaluated in terms of postintervention care, duration of hospital stay and 30-day readmission. Changes in TPMA on surveillance EVAR imaging were also evaluated.
Results
In total, 382 patient images acquired between March 2008 and December 2016 were analysed. There were no significant intraobserver and interobserver differences in measurements of TPMA. Preintervention TPMA failed to predict morbidity and mortality at all time points. The mean(s.d.) interval between preintervention and surveillance imaging was 361·3(111·2) days. A significant reduction in TPMA was observed in men on surveillance imaging after EVAR (mean reduction 0·63(1·43) cm2 per m2; P < 0·001). However, this was not associated with mortality (adjusted hazard ratio 1·00, 95 per cent c.i. 0·99 to 1·01; P = 0·935).
Conclusion
TPMA is not a suitable risk stratification tool for patients undergoing effective intervention for AAA.
Graphical Abstract
The total psoas muscle area (TPMA), as a measure of sarcopenia and frailty, has been demonstrated previously to be a potential method of risk stratification in surgical patients. In this study, TPMA did not appear to be associated with mortality and morbidity in patients undergoing elective abdominal aortic aneurysm intervention. Therefore TPMA may not be a suitable method of risk stratification for routine clinical practice.
Graphical Abstract.

Not predictive
Introduction
Preoperative risk stratification is an important component of surgical practice. High-quality randomized trials from the UK, Europe and USA have all highlighted the importance of patient selection when planning elective abdominal aortic aneurysm (AAA) intervention, either by endovascular aneurysm repair (EVAR) or open aneurysm repair (OAR)1–3. This is important in terms of perioperative risk and long-term survival. Cardiopulmonary exercise testing is frequently used to help stratify periprocedural risk and can predict short-term survival4,5. Several methods of long-term risk stratification have been investigated, the most recent being the Carlisle risk score6. These have yet to be shown to be of clear prognostic relevance following AAA intervention and fail to predict long-term mortality, especially in patients with multiple morbidities7. With this in mind, a simple objective method for long-term risk stratification would be clinically useful2.
Patients with an AAA are typically aged over 65 years; the estimated prevalence of sarcopenia in this group is 41·1 per cent1,8. Sarcopenia, determined by assessment of psoas muscle size, is an accepted measure of frailty9. Contemporary evaluation of patients with AAA typically involves preoperative CT angiography (CTA) to assess AAA morphology and suitability for endovascular intervention. It is well established that sarcopenia can be quantified on CT images by measuring the total psoas muscle area (TPMA), and this has been shown to have prognostic value in patients undergoing curative cancer resection10. It has been shown recently that manual tracing of the TPMA is both reproducible and independent of observer bias11. The hypothesis of this study was that TPMA might therefore be a useful clinical adjunct for risk stratification in patients with an AAA. Associations between sarcopenia and adverse outcomes have been reported following elective AAA intervention12–17. This finding was not, however, replicated by Heard and colleagues8 in a cohort of vascular patients in the UK. In the existing studies there has been disparity in the statistical stratification of patients based on TPMA, with some studies categorizing patients into tertiles, whereas others have adopted a cut-off for sarcopenia of around 5·5 cm2 per m2 in men and 4·0 cm2 per m2 in women8,10.
The primary purpose of this study was to investigate whether there is a relationship between sarcopenia, determined by the TPMA, and mortality and morbidity following elective AAA intervention using a range of statistical approaches. Second, the study investigated whether TPMA changed following intervention and if this had any prognostic value.
Methods
Preoperative cross-sectional CTA images from patients who underwent a primary elective intervention for AAA at a tertiary vascular surgery centre in the UK were analysed. Consecutive patients were identified from the Health Quality Improvement Partnership's prospectively maintained national database, the National Vascular Registry (NVR)18. A sample of patients who had intervention between January 2010 and December 2015 was compared against Hospital Episode Statistics (HES) data to ensure that the sample used in the present study was representative of local practice.
Patients were included into the study if they had preintervention CT of the abdomen within 12 months of their AAA intervention available on the hospital picture archiving and communications system (PACS). Imaging was performed using a Siemens Somatom Definition AS CT scanner (Siemens Healthcare, Forchheim, Germany) with the patient supine, with a breath-hold to minimize motion artefact. Cross-sectional images were retrieved, and analysis undertaken at the level of the third lumbar vertebra. Patients were excluded from the study if the psoas muscles could not be visualized in their entirety on the cross-sectional imaging.
Ethical approval was granted by the local radiology research authorization group and Health Research Authority (IRAS project identifier 228484). The authors conformed to the Helsinki Declaration, 1996.
Data collection and outcome measures
The following demographic data were retrieved from the NVR and refined from the hospital medical records: age, sex, weight, height, AAA diameter, ASA fitness grade and smoking status. Patient co-morbidity data were collected regarding: diabetes, hypertension, ischaemic heart disease, chronic heart failure, chronic kidney disease, cerebrovascular disease and chronic pulmonary disease.
The primary outcome measures of this study were patient morbidity and mortality. The date of death was collected from an electronic patient record system (Patient Pathway Manager plus; PPM+). Patient morbidity data collected included: postoperative destination (ward, high-dependency unit (HDU) or ICU), duration of hospital stay and 30-day readmission. These were obtained from the NVR and corroborated with data from PPM+.
Image analysis
The TPMA was measured on all preintervention CT images, regardless of treatment modality. CTA imaging surveillance following OAR is not done routinely19. Therefore, the association between changes in TPMA before and after the procedure and mortality was assessed only in patients undergoing EVAR with postintervention imaging at least 6 months after endografting.
All images were assessed for inclusion by a single investigator who did not participate in the analysis of images. Morphometric measurements were performed using the PACS viewer Impax (Agfa-Gevaert, Mortsel, Belgium). Transverse cross-sectional images were identified by counting up from the sacrum to the third lumbar vertebra on the sagittal view of the abdomen on multiplanar reconstruction. The TPMA was measured by two trained independent raters (R1 and R2), who were blinded to the patient characteristics, by manually tracing around the left and right psoas muscle (Fig. 1).
Fig. 1.

Cross-sectional measurement of the total psoas muscle area on CT angiography. X denotes the right psoas
Statistical analysis
TPMA, age, height, weight and AAA size were found to be normally distributed using the Shapiro–Wilk test. These were reported using mean(s.d.) and were compared using the unpaired Student's t test. Categorical variables were reported as absolute numbers and percentages, and comparisons were made using either the χ2 test or Kruskal–Wallis test. P < 0·050 was considered significant.
The TPMA was measured in cm2. Each image was analysed by R1 twice (R1a and R1b) and once by R2, as described previously11. Images were presented to the raters in a random order and raters were blinded to the clinical data. Intraobserver and interobserver differences in TPMA measurements were evaluated using Bland–Altman plots and paired t tests. The limits of agreement were illustrated as two standard deviations from the mean differences observed. Measurements from R1a were used solely to derive standardized TPMA measurements, as single-observer measurement was likely to represent the potential clinical application of this method. Measurements of TPMA were standardized against the patients' height-squared (reported as cm per m2)10.
To identify any associations between TPMA and mortality, Cox regression analysis was used to derive hazard ratios (HRs) and 95 per cent confidence intervals reported at 30 days, 1 year, 4 years and overall. In this analysis, TPMA was treated as an independent continuous co-variable. Similarly, changes in TPMA on surveillance imaging (versus baseline) were compared to identify any association with mortality. Patients were subsequently categorized into tertiles, and also using single TPMA cut-off values of 5·5 cm2 per m2 in men and 4·0 cm2 per m2 in women as these methods have been employed extensively in other studies10. Patients in tertile 1 had the highest TPMA measurements, and those in tertile 3 the lowest. Kaplan–Meier survival analysis was undertaken and differences in overall survival assessed using log rank tests.
Morbidity analysis was grouped according to type of intervention, as the postintervention management is different for EVAR and OAR. The association between TPMA and postintervention destination was assessed using logistic regression. In patients who underwent EVAR, TPMA was evaluated in relation to type of postintervention care (HDU/ICU versus ward care). In patients who had OAR, TPMA was compared between patients who required ICU care versus HDU care after the intervention. Thirty-day readmission was assessed by means of logistic regression, and the association between TPMA and duration of hospital stay was evaluated using linear regression analysis. All regression analysis was reported unadjusted, and adjusted for age, sex and intervention type.
Post hoc analysis was performed by type of intervention owing to baseline differences in the EVAR and OAR cohorts. Analysis based on sex was not possible because of the small number of women in this study.
Statistical analyses were done using SPSS® version 23 (IBM, Armonk, New York, USA) and Minitab® (Minitab, State College, Pennsylvania, USA).
Results
In total, 430 patients who had an AAA intervention between January 2008 and December 2016 were identified. Overall, 253 of the 382 patients included in the study (66·2 per cent) had an EVAR and 129 (33·8 per cent) an OAR. Data capture in the NVR was 83·6 per cent compared with equivalent HES data. All patients had a minimum of 12 months of clinical follow-up unless the patient had died within this time. Mean(s.d.) follow-up was 4·0(2·7) years. After exclusions, preintervention images from 382 patients and postintervention images from 211 patients were analysed (Fig. 2). The mean age was 75·0(7·6) years and 333 patients (87·2 per cent) were men. The mean height was 1·74(0·08) m. Patient demographics are summarized in Table 1.
Fig. 2.

Flow chart illustrating the inclusion and exclusion of patients identified from the National Vascular Registry (NVR). AAA, abdominal aortic aneurysm; EVAR, endovascular aneurysm repair; OAR, open aneurysm repair
Table 1.
Patient demographics, overall and by intervention
| Overall | EVAR | OAR | ||
|---|---|---|---|---|
| (n = 382) | (n = 253) | (n = 129) | P ‡ | |
| Age (years)* | 75·0(7·6) | 76·4(7·4) | 72·3(7·2) | < 0·001§ |
| Sex ratio (M : F) | 333 : 49 | 221 : 32 | 112 : 17 | 0·873 |
| Weight (kg)* | 83·8(19·3) | 83·8(18·3) | 83·8(21·6) | 0·997§ |
| Height (m)* | 1·74(0·08) | 1·74(0·08) | 1·75(0·07) | 0·359§ |
| AAA diameter (mm)* | 62·6(8·4) | 61·5(6·8) | 64·9(10·5) | 0·002§ |
| ASA fitness grade† | III (II–III) | III (II–III) | III (II–III) | 0·005 |
| Smoking status | ||||
| Smoker | 82 (21·5) | 42 (16·6) | 40 (31·0) | 0·001 |
| Ex-smoker | 115 (30·1) | 88 (34·8) | 27 (20·9) | 0·004 |
| Co-morbidities | ||||
| Diabetes | 45 (11·8) | 36 (14·2) | 9 (7·0) | 0·044 |
| Hypertension | 137 (35·9) | 103 (40·7) | 34 (26·4) | 0·007 |
| Ischaemic heart disease | 100 (26·2) | 84 (33·2) | 16 (12·4) | < 0·001 |
| Chronic heart failure | 12 (3·1) | 10 (4·0) | 2 (1·6) | 0·352 |
| Chronic kidney disease | 30 (7·9) | 26 (10·3) | 4 (3·1) | 0·015 |
| Cerebrovascular disease | 14 (3·7) | 11 (4·3) | 3 (2·3) | 0·399 |
| Chronic pulmonary disease | 51 (13·4) | 45 (17·8) | 6 (4·7) | < 0·001 |
| Sarcopenia | ||||
| TPMA (cm2)* | 19·1(6·1) | 20·0(6·0) | 17·4(6·0) | < 0·001§ |
| Standardized TPMA (cm2 per m2)* | 6·3(1·9) | 6·6(1·8) | 5·7(1·9) | < 0·001§ |
Values in parentheses are percentages unless indicated otherwise; values are
mean(s.d.) and
median (i.q.r.). EVAR, endovascular aneurysm repair; OAR, open aneurysm repair; AAA, abdominal aortic aneurysm; TPMA, total psoas muscle area.
χ2 test, except
Student's t test.
Image analysis
The mean interval between imaging and intervention was 80·6(74·0) days. Only measurements from preintervention imaging were used to assess observer differences. This comprised 1146 blinded measurements of TPMA, 764 measurements by R1 and 382 by R2. There were no significant intraobserver (mean difference –0·02(0·78) cm2; P = 0·669) or interobserver (mean difference 0·04(0·75) cm2; P = 0·222) differences in TPMA measurements (Fig. 3). The mean standardized preintervention TPMA for all patients was 6·3(1·9) cm2 per m2.
Fig. 3.

Bland–Altman analysis of intraobserver and interobserver agreement in total psoas muscle area (TPMA) measurements. a Intraobserver and b interobserver differences in TPMA measurements. Solid and dashed lines represent the mean and limits of agreement respectively. R1a and R1b, first and second measurements from the first reader; R2, single measurement by the second reader
Primary outcome
Overall, no patients died in the first 30 days after the procedure. There were 26 deaths (6·8 per cent) within 1 year, 81 (21·2 per cent) within 4 years, and 109 patients (28·5 per cent) had died by the end of the study. As a continuous variable in Cox regression analysis, TPMA was not a significant independent predictor of death at any of the time points analysed (Table 2). Survival analysis based on patients categorized by TPMA tertile also failed to demonstrate any relationship between TPMA and mortality (unadjusted HR 1·00, 95 per cent c.i. 0·81 to 1·28, P = 0·919; adjusted HR 1·00, 0·77 to 1·18, P = 0·779) (Fig. 4a). Analysis based on the suggested sarcopenia cut-off value of 5·5 cm2 per m2 in men and 4·0 cm2 per m2 in women indicated that 110 of 380 patients (28·9 per cent) were sarcopenic. As in the other analyses, categorization based on this method also failed to show TPMA to be predictive of mortality (unadjusted HR 0·83, 0·52 to 1·22, P = 0·224; adjusted HR 0·90, 0·57 to 1·41, P = 0·657) (Fig. 4b).
Table 2.
Cox regression analysis for mortality at 30 days, 1 year, 4 years and overall with hazard ratios for standardized total psoas muscle area as a continuous variable
| Unadjusted analysis | Adjusted analysis* | |||
|---|---|---|---|---|
| Hazard ratio | P | Hazard ratio | P | |
| 30 days | 0·73 (0·45, 1·20) | 0·221 | 0·80 (0·44, 1·46) | 0·468 |
| 1 year | 0·92 (0·75, 1·14) | 0·458 | 0·92 (0·73, 1·15) | 0·455 |
| 4 years | 0·94 (0·83, 1·07) | 0·361 | 0·96 (0·83, 1·11) | 0·580 |
| Overall | 0·99 (0·89, 1·09) | 0·769 | 0·97 (0·87, 1·08) | 0·603 |
Values in parentheses are 95 per cent confidence intervals.
Adjusted for age, sex and intervention type.
Fig. 4.
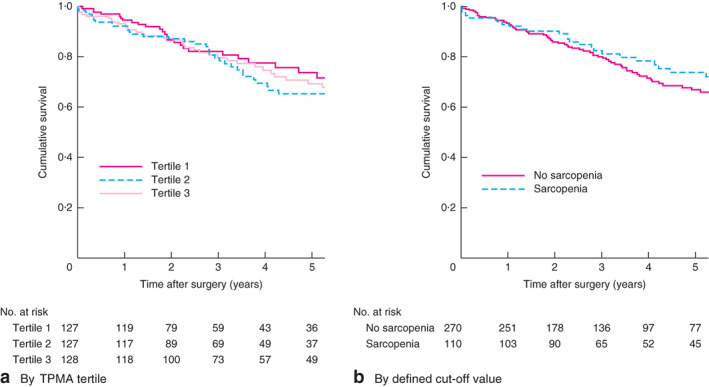
Kaplan–Meier curves showing survival in relation to total psoas muscle area (TPMA). a By TPMA tertiles and b by defined cut-off values
Of patients who underwent EVAR, the majority received ward-based rather than HDU/ICU care (58·5 versus 37·9 per cent respectively) (Table 3). TPMA was not predictive of the need for higher-level care after EVAR (unadjusted odds ratio (OR) 0·96, 95 per cent c.i. 0·84 to 1·11, P = 0·585; adjusted OR 0·93, 0·80 to 1·07, P = 0·301) or OAR (unadjusted OR 0·82, 0·67 to 1·00, P = 0·050; adjusted OR 0·85, 0·68 to 1·06, P = 0·142).
Table 3.
Patient morbidity following endovascular and open aneurysm repair
| EVAR | OAR | |
|---|---|---|
| (n = 253) | (n = 129) | |
| Postoperative destination | ||
| Ward | 148 (58·5) | 3 (2·3) |
| HDU | 75 (29·6) | 49 (38·0) |
| ICU | 21 (8·3) | 64 (49·6) |
| Unknown | 9 (3·6) | 13 (10·1) |
| Duration of hospital stay (days)* | 3 (2–5) | 8 (6–12) |
| Readmission within 30 days | 13 (5·1) | 3 (2·3) |
Values in parentheses are percentages unless indicated otherwise;
values are median (i.q.r.). EVAR, endovascular aneurysm repair; OAR, open aneurysm repair; HDU, high-dependency unit.
The median duration of hospital stay was 3 (i.q.r. 2–5) days after EVAR and 8 (6–12) days after OAR. There was no significant association between TPMA and duration of hospital stay following EVAR (unadjusted regression coefficient –0·22, 95 per cent c.i. –1·82 to 1·38, P = 0·789; adjusted regression coefficient –0·27, –1·95 to 1·41; P = 0·752) or OAR (unadjusted regression coefficient 0·03, –0·97 to 1·03, P = 0·955; adjusted regression coefficient 0·31, –0·75 to 1·36, P = 0·564). Sixteen patients (4·2 per cent) were readmitted within 30 days. TPMA did not predict readmission (unadjusted OR 0·99, 0·76 to 1·28, P = 0·914; adjusted OR 0·98, 0·73 to 1·31, P = 0·902).
Secondary outcome
Of the 253 patients who underwent EVAR, 211 (83·4 per cent) had a suitable postintervention CT image for analysis. The mean interval between preintervention and surveillance imaging was 361·3(111·2) days. Mean standardized TPMA at surveillance was 6·2(2·0) cm2 per m2. There was a significant decrease in TPMA after EVAR compared with the preintervention value (mean difference 0·63(1·43) cm2 per m2; P < 0·001). A reduction in TPMA was not, however, associated with increased mortality (unadjusted HR 1·00, 95 per cent c.i. 0·99 to 1·01, P = 0·893; adjusted HR 1·00, 0·99 to 1·01, P = 0·935).
Post hoc analysis
Patients undergoing EVAR were significantly older, had a smaller aneurysm at the time of intervention, and had a higher ASA grade owing to a higher prevalence of co-morbidities, than those undergoing OAR (Table 1). They also had a significantly higher standardized TPMA (6·6(1·8) versus 5·7(1·9) cm2 per m2; P < 0·001). It was therefore important to determine whether TPMA performed differently as a predictor of mortality in the two treatment groups, which were clearly not well matched.
In patients undergoing EVAR, preintervention TPMA analysed as a continuous variable did not predict mortality (unadjusted HR 0·90, 95 per cent c.i. 0·80 to 1·02, P = 0·088; adjusted HR 0·93, 0·82 to 1·06, P = 0·260). Similarly, in analyses based on stratification by tertiles (unadjusted HR 1·15, 0·88 to 1·50, P = 0·304; adjusted HR 1·10, 0·84 to 1·44, P = 0·508) and the predefined cut-off values for sarcopenia (unadjusted HR 0·86, 0·49 to 1·48, P = 0·581; adjusted HR 0·86, 0·50 to 1·49, P = 0·593), TPMA did not predict mortality following EVAR.
In patients undergoing OAR, preintervention TPMA analysed as a continuous variable also did not predict mortality (unadjusted HR 1·02, 0·84 to 1·26, P = 0·819; adjusted HR 1·11, 0·88 to 1·41, P = 0·386). Furthermore, analyses based on stratification by tertiles (unadjusted HR 0·86, 0·55 to 1·37, P = 0·529; adjusted HR 0·78, 0·48 to 1·28, P = 0·324) and the predefined cut-off values for sarcopenia (unadjusted HR 0·98, 0·47 to 2·03, P = 0·948; adjusted HR 0·96, 0·46 to 2·01, P = 0·077) confirmed that TPMA did not predict mortality following OAR.
Age was the only significant predictor of outcome at all time points (P < 0·001). A significant negative correlation was observed between preintervention TPMA and age (Pearson correlation –0·13, P = 0·011) (Fig. 5). Some 104 patients (27·2 per cent) were aged above 80 years, a cohort previously described to have a poor outcome following vascular surgery compared with younger patients20. The mean standardized TPMA before intervention in this group was 6·0(1·6) cm2 per m2, compared with 6·4(2·0) cm2 per m2 in patients aged 80 years or less (P = 0·072). TPMA also failed to predict mortality in this high-risk patient group (unadjusted HR 1·08, 0·90 to 1·29, P = 0·407; adjusted HR 1·02, 0·84 to 1·25, P = 0·823).
Fig. 5.

Scatter plot illustrating relationship between standardized preintervention total psoas muscle area (TPMA) and age
Discussion
It has been suggested that TPMA as a simple measure of sarcopenia might be useful in predicting outcomes in surgical patients and therefore be suitable as a clinical risk stratification tool. Existing evidence for TPMA in patients with an AAA is conflicting. Previous studies have not used robust statistical methodology and are at risk of bias.
In this study, TPMA was assessed in an unselected cohort of patients undergoing elective AAA repair at a single UK centre. There was no association between TPMA and mortality at 30 days, 1 year or 4 years. This was the case whether TPMA was used as a continuous variable in Cox regression analysis, or in cohort analysis by tertiles of TPMA, or using TPMA cut-off values from the literature to define sarcopenia. TPMA did not identify the need for higher-level care, prolonged hospital stay or 30-day readmission. There was a significant reduction in TPMA 1 year after EVAR, but this was not predictive of outcome. The reasons behind the continued reduction in TPMA were beyond the scope of this study; however, it is clear from the demographic data that these patients had multiple co-morbidities and AAA intervention did not affect TPMA reduction.
The only patient characteristic that did predict mortality in this study was age at intervention. When TPMA was evaluated in a selected group of high-risk octogenarian patients, there was no significant association between TPMA and mortality.
Existing methods of long-term risk stratification, such as the vascular POSSUM score and Glasgow Aneurysm Score, have been criticized as they predict long-term outcomes poorly7. Such methods require the careful evaluation of patient characteristics, co-morbidities, physiology and results from investigations. They have not been adopted widely. The ability to predict long-term survival from a simple quantifiable assessment such as TPMA is appealing. There is a growing body of evidence that sarcopenia measured by TPMA is a prognostic indicator in surgical patients undergoing curative cancer resection, liver transplantation and emergency surgery21–23. It is important to recognize the differences between these cohorts and the types of patient who develop AAA. Patients undergoing AAA intervention are typically elderly, current or ex-smokers with a high prevalence of cardiovascular and pulmonary co-morbidity24–27. Therefore, it is important to appreciate that it may be challenging to capture the complex frail co-morbid nature of this patient group with a single measure such as the TPMA.
Nor is there evidence that TPMA is associated with patient morbidity following AAA intervention8,14–15,28. Thurston et al.14 and Newton and colleagues15 both reported a longer hospital stay in sarcopenic patients undergoing EVAR; however, they failed to adjust for patient age and sex. Despite this, sarcopenia was not associated with either early or late complications here, findings supported by Kays and co-workers28. Similar to the present findings, Heard et al.8 demonstrated that sarcopenia did not influence postintervention discharge destination.
In this study, TPMA was measured in preference to the total abdominal muscle area, as this measurement could be performed manually by tracing around the left and right psoas muscle after limited training, without the need for specialist software8,11,13,28. Similar to previous findings, measurement of TPMA was reproducible, as demonstrated by the absence of intraobserver and interobserver differences. The method is feasible using most standard PACS viewers, so did not need any additional resources, and was representative of likely clinical application. However, the potential benefit of using a Hounsfield-based method of image analysis has been described by Kays and colleagues28, who demonstrated sarcopenic myosteatosis to be associated with increased mortality, suggesting that simply measuring the psoas muscle area may be an inaccurate representation of actual muscle bulk. This study attempted to accommodate analytical variations previously described as there is no universal consensus on measurements of muscle bulk indicating sarcopenia in vascular surgery.
This study is limited by the fact it is from a single UK centre and may therefore not be representative of all cohorts of patients with an AAA. The patient characteristics in this study were, however, in keeping with those reported by the major international randomized trials. Data used in this study were primarily from the NVR, which is populated by clinicians and site-specific administrators.
As TPMA is not a suitable tool for predicting mortality after AAA intervention, other measures of frailty, such as grip strength, gait speed and frailty scoring, should be tested in these patients.
Acknowledgements
M.A.B. and D.J.A.S. contributed equally to this work. M.A.W. and M.D. are clinical research training fellows supported by the British Heart Foundation. M.A.B. is an intermediate clinical fellow supported by the British Heart Foundation. No external sources of funding were used to conduct this work.
Disclosure: The authors declare no conflict of interest.
References
- 1. Powell JT, Sweeting MJ, Ulug P, Blankensteijn JD, Lederle FA, Becquemin JPet al.; EVAR-1, DREAM, OVER and ACE Trialists. Meta-analysis of individual-patient data from EVAR-1, DREAM, OVER and ACE trials comparing outcomes of endovascular or open repair for abdominal aortic aneurysm over 5 years. Br J Surg 2017; 104: 166–178. [DOI] [PMC free article] [PubMed] [Google Scholar]
- 2. EVAR trial participants . Endovascular aneurysm repair and outcome in patients unfit for open repair of abdominal aortic aneurysm (EVAR trial 2): randomised controlled trial. Lancet 2005; 365: 2187–2192. [DOI] [PubMed] [Google Scholar]
- 3. Patel R, Sweeting MJ, Powell JT. Endovascular versus open repair of abdominal aortic aneurysm in 15-years' follow-up of the UK endovascular aneurysm repair trial 1 (EVAR trial 1): a randomised controlled trial. J Vasc Surg 2017; 65: 585. [DOI] [PubMed] [Google Scholar]
- 4. Grant SW, Hickey GL, Wisely NA, Carlson ED, Hartley RA, Pichel ACet al. Cardiopulmonary exercise testing and survival after elective abdominal aortic aneurysm repair. Br J Anaesth 2015; 114: 430–436. [DOI] [PubMed] [Google Scholar]
- 5. Waton S, Katriina H, Cromwell D, Loftus I, Boyle J. National Vascular Registry: 2017 Annual Report (Version 2). Royal College of Surgeons of England: London, 2018. [Google Scholar]
- 6. Carlisle JB, Danjoux G, Kerr K, Snowden C, Swart M. Validation of long-term survival prediction for scheduled abdominal aortic aneurysm repair with an independent calculator using only pre-operative variables. Anaesthesia 2015; 70: 654–665. [DOI] [PubMed] [Google Scholar]
- 7. Patterson BO, Holt PJ, Hinchliffe R, Loftus IM, Thompson MM. Predicting risk in elective abdominal aortic aneurysm repair: a systematic review of current evidence. Eur J Vasc Endovasc Surg 2008; 36: 637–645. [DOI] [PubMed] [Google Scholar]
- 8. Heard R, Black D, Ramsay G, Scott N, Hildebrand D. The prevalence of sarcopaenia in a vascular surgical patient cohort and its impact on outcome. Surgeon 2018; 16: 325–332. [DOI] [PubMed] [Google Scholar]
- 9. Cruz-Jentoft AJ, Baeyens JP, Bauer JM, Boirie Y, Cederholm T, Landi Fet al.; European Working Group on Sarcopenia in Older People. Sarcopenia: European consensus on definition and diagnosis: report of the European Working Group on Sarcopenia in Older People. Age Ageing 2010; 39: 412–423. [DOI] [PMC free article] [PubMed] [Google Scholar]
- 10. Jones K, Gordon-Weeks A, Coleman C, Silva M. Radiologically determined sarcopenia predicts morbidity and mortality following abdominal surgery: a systematic review and meta-analysis. World J Surg 2017; 41: 2266–2279. [DOI] [PMC free article] [PubMed] [Google Scholar]
- 11. Waduud MA, Drozd M, Linton E, Wood B, Manning J, Bailey MAet al. Vascular Surgeons and Interventional Radiologists at the Leeds Vascular Institute. Influences of clinical experience in the quantification of morphometric sarcopaenia: a cohort study. Br J Radiol 2018; [Epub ahead of print]. [DOI] [PMC free article] [PubMed] [Google Scholar]
- 12. Lee JS, He K, Harbaugh CM, Schaubel DE, Sonnenday CJ, Wang SCet al.; Michigan Analytic Morphomics Group (MAMG). Frailty, core muscle size, and mortality in patients undergoing open abdominal aortic aneurysm repair. J Vasc Surg 2011; 53: 912–917. [DOI] [PubMed] [Google Scholar]
- 13. Hale AL, Twomey K, Ewing JA, Langan EM, Cull DL, Gray BH. Impact of sarcopenia on long-term mortality following endovascular aneurysm repair. Vasc Med 2016; 21: 217–222. [DOI] [PubMed] [Google Scholar]
- 14. Thurston B, Pena GN, Howell S, Cowled P, Fitridge R. Low total psoas area as scored in the clinic setting independently predicts midterm mortality after endovascular aneurysm repair in male patients. J Vasc Surg 2018; 67: 460–467. [DOI] [PubMed] [Google Scholar]
- 15. Newton DH, Kim C, Lee N, Wolfe L, Pfeifer J, Amendola M. Sarcopenia predicts poor long-term survival in patients undergoing endovascular aortic aneurysm repair. J Vasc Surg 2018; 67: 453–459. [DOI] [PubMed] [Google Scholar]
- 16. Indrakusuma R, Zijlmans JL, Jalalzadeh H, Planken RN, Balm R, Koelemay MJW. Psoas muscle area as a prognostic factor for survival in patients with an asymptomatic infrarenal abdominal aortic aneurysm: a retrospective cohort study. Eur J Vasc Endovasc Surg 2018; 55: 83–91. [DOI] [PubMed] [Google Scholar]
- 17. Chowdhury MM, Ambler GK, Al Zuhir N, Walker A, Atkins ER, Winterbottom Aet al. Morphometric assessment as a predictor of outcome in older vascular surgery patients. Ann Vasc Surg 2018; 47: 90–97. [DOI] [PubMed] [Google Scholar]
- 18. Waton S, Johal A, Heikkilä K, Cromwell D, Loftus I. National Vascular Registry: 2015 Annual Report. Technical Report; 2015. [Google Scholar]
- 19. Moll FL, Powell JT, Fraedrich G, Verzini F, Haulon S, Waltham Met al.; European Society for Vascular Surgery. Management of abdominal aortic aneurysms clinical practice guidelines of the European Society for Vascular Surgery. Eur J Vasc Endovasc Surg 2011; 41(Suppl 1): S1–S58. [DOI] [PubMed] [Google Scholar]
- 20. Henebiens M, Vahl A, Koelemay MJ. Elective surgery of abdominal aortic aneurysms in octogenarians: a systematic review. J Vasc Surg 2008; 47: 676–681. [DOI] [PubMed] [Google Scholar]
- 21. Masuda T, Shirabe K, Ikegami T, Harimoto N, Yoshizumi T, Soejima Yet al. Sarcopenia is a prognostic factor in living donor liver transplantation. Liver Transpl 2014; 20: 401–407. [DOI] [PubMed] [Google Scholar]
- 22. Montano-Loza AJ, Meza-Junco J, Baracos VE, Prado CM, Ma M, Meeberg Get al. Severe muscle depletion predicts postoperative length of stay but is not associated with survival after liver transplantation. Liver Transpl 2014; 20: 640–648. [DOI] [PubMed] [Google Scholar]
- 23. Du Y, Karvellas CJ, Baracos V, Williams DC, Khadaroo RG; Acute Care and Emergency Surgery (ACES) Group . Sarcopenia is a predictor of outcomes in very elderly patients undergoing emergency surgery. Surgery 2014; 156: 521–527. [DOI] [PubMed] [Google Scholar]
- 24. Greenhalgh RM, Brown LC, Kwong GP, Powell JT, Thompson SG; EVAR Trial Participants . Comparison of endovascular aneurysm repair with open repair in patients with abdominal aortic aneurysm (EVAR trial 1), 30-day operative mortality results: randomised controlled trial. Lancet 2004; 364: 843–848. [DOI] [PubMed] [Google Scholar]
- 25. Blankensteijn JD, de Jong SE, Prinssen M, van der Ham AC, Buth J, van Sterkenburg SMet al.; Dutch Randomized Endovascular Aneurysm Management (DREAM) Trial Group. Two-year outcomes after conventional or endovascular repair of abdominal aortic aneurysms. N Engl J Med 2005; 352: 2398–2405. [DOI] [PubMed] [Google Scholar]
- 26. Lederle FA, Freischlag JA, Kyriakides TC, Padberg FT Jr, Matsumura JS, Kohler TRet al.; Open Versus Endovascular Repair (OVER) Veterans Affairs Cooperative Study Group. Outcomes following endovascular vs open repair of abdominal aortic aneurysm: a randomized trial. JAMA 2009; 302: 1535–1542. [DOI] [PubMed] [Google Scholar]
- 27. Becquemin JP, Pillet JC, Lescalie F, Sapoval M, Goueffic Y, Lermusiaux Pet al.; ACE trialists . A randomized controlled trial of endovascular aneurysm repair versus open surgery for abdominal aortic aneurysms in low- to moderate-risk patients. J Vasc Surg 2011; 53: 1167–1173.e1. [DOI] [PubMed] [Google Scholar]
- 28. Kays JK, Liang TW, Zimmers TA, Milgrom DP, Abduljabar H, Young Aet al. Sarcopenia is a significant predictor of mortality after abdominal aortic aneurysm repair. J Cachexia Sarcopenia Muscle 2018;(3): 1–12. [PMC free article] [PubMed] [Google Scholar]