Abstract
We present a detailed description of the TES methanol (CH3OH) retrieval algorithm, along with initial global results showing the seasonal and spatial distribution of methanol in the lower troposphere. The full development of the TES methanol retrieval is described, including microwindow selection, error analysis, and the utilization of a priori and initial guess information provided by the GEOS-Chem chemical transport model. Retrieval simulations and a sensitivity analysis using the developed retrieval strategy show that TES: (i) generally provides less than 1.0 piece of information, (ii) is sensitive in the lower troposphere with peak sensitivity typically occurring between ~900–700 hPa (~1–3 km) at a vertical resolution of ~5 km, (iii) has a limit of detectability between 0.5 and 1.0 ppbv Representative Volume Mixing Ratio (RVMR) depending on the atmospheric conditions, corresponding roughly to a profile with a maximum concentration of at least 1 to 2 ppbv, and (iv) in a simulation environment has a mean bias of 0.16 ppbv with a standard deviation of 0.34 ppbv. Applying the newly derived TES retrieval globally and comparing the results with corresponding GEOS-Chem output, we find generally consistent large-scale patterns between the two. However, TES often reveals higher methanol concentrations than simulated in the Northern Hemisphere spring, summer and fall. In the Southern Hemisphere, the TES methanol observations indicate a model overestimate over the bulk of South America from December through July, and a model underestimate during the biomass burning season.
1. Introduction
Global high-spectral resolution nadir measurements from the Tropospheric Emission Spectrometer (TES), a Fourier Transform Spectrometer (FTS) on NASA’s Aura platform, enable the simultaneous retrieval of a number of tropospheric pollutants and trace gases, in addition to the TES standard operationally retrieved products such as carbon monoxide and ozone. Methanol (CH3OH) is one of the additional species that can be retrieved in conjunction with the TES standard products, and is important for local, regional, and global tropospheric chemistry studies. Methanol is the most abundant non-methane volatile organic compound (VOC). Oxidation of methanol is a major source of carbon monoxide (CO) and formaldehyde (HCHO) (Hu et al., 2011) and leads to production of tropospheric ozone (O3) (Tie et al., 2003). However, methanol sources and sinks are poorly quantified, with estimated global emissions ranging from 120 to 340 Tg yr−1 (Millet et al., 2008). The main source of atmospheric methanol is biogenic emissions from terrestrial and marine biota, with other sources including photochemical production, biomass burning, and anthropogenic emissions (MacDonald and Fall, 2003; Heikes et al., 2002; Tyndall et al., 2001; Holzinger et al., 1999; de Gouw et al., 2005). The predominant methanol sinks are photochemical oxidation by OH, ocean uptake, and deposition (Millet et al., 2008; Stavrakou et al., 2011).
The first satellite retrievals of methanol were based on observations from the Atmospheric Chemistry Experiment Fourier Transform Spectrometer (ACE-FTS) (Dufour et al., 2006, 2007). The ACE-FTS provides limb measurements, which are confined to the upper troposphere and lower stratosphere. The first satellite observations of lower tropospheric methanol were reported by Beer et al. (2008) using TES-Aura nadir infrared FTS spectra. That study presented preliminary TES retrievals over China and Southern California for two limited time periods. The Infrared Atmospheric Sounding Interferometer (IASI) instrument, also an FTS, retrieves CH3OH in nadir viewing mode using the thermal infrared spectral region. The excellent spatial coverage of the IASI instrument, coupled with a very simple and fast retrieval based on the conversion of brightness temperature differences into total column concentrations, has provided a global picture of the distribution of atmospheric methanol (Razavi et al., 2011).
TES has a high spectral resolution of 0.06 cm−1, compared to 0.5–1.0 cm−1 for the other infrared satellite sensors currently flying. TES’s combination of high spectral resolution and good signal-to-noise ratio (SNR) in the methanol region (Shephard et al., 2008) provides the capacity to measure methanol concentrations close to the surface. Furthermore, Aura’s sun-synchronous orbit has a daytime local overpass time of 1330 mean solar time, providing favorable conditions for high thermal contrast and thus increased sensitivity to boundary layer methanol. In comparison, IASI has an apodized spectral resolution of 0.5 cm−1 and a local overpass time of 930 mean solar time. Both instruments have night-time overpasses 12 h later. As a result, TES has the potential to be more sensitive to near-source methanol variations than other available sensors. Another important advantage of high spectral resolution is that it allows for selection of spectral regions (microwindows) that reduce the impact of interfering species, and therefore of systematic errors in the retrievals. These sensor characteristics, coupled with a sophisticated global retrieval algorithm, can provide high-fidelity information on atmospheric methanol over a wide range of temporal and spatial scales.
A comparison of TES methanol retrievals with aircraft measurements from numerous campaigns (Wells et al., 2012) showed that the TES data are consistent with in situ measurements. This validation provided the basis for using the TES data to quantify the seasonality of biogenic methanol emissions from temperate landscapes (Wells et al., 2012). Xiao et al. (2012) showed that CH3OH/CO ratios obtained from TES observations during the MILAGRO campaign in Mexico, where there are strong anthropogenic methanol sources, were distinctly different from those over the Amazon region, where emissions are principally biogenic. This study demonstrates that TES has sufficient sensitivity to provide valuable information on global sources of methanol.
This paper describes the TES methanol retrieval algorithm and illustrates its capabilities by examining seasonal methanol variability across the globe during 2009. Section 2 provides a description of the optimal estimation retrieval approach and algorithm strategy, including the selected methanol spectral microwindows, a priori profiles, and constraints. Section 3 examines the sensitivity of the algorithm, provides error estimates, and introduces a useful metric for comparing TES methanol with model output and in situ observations. Section 4 compares TES methanol retrievals with simulated concentrations from the GEOS-Chem model during 2009, and provides an assessment of the algorithm performance. Section 5 provides a summary and discusses the potential for future improvements to the algorithm performance.
2. TES methanol retrieval algorithm
2.1. Retrieval methodology
The TES methanol retrieval is based on an optimal estimation approach that minimizes the difference between the observed spectral radiances and a nonlinear radiative transfer model driven by the atmospheric state, subject to the constraint that the estimated state must be consistent with an a priori probability distribution for that state (Bowman et al., 2006). If the estimated (retrieved) state is close to the actual state, then the estimated state can be expressed in terms of the actual state through the linear retrieval (Rodgers, 2000):
| (1) |
where , xa, and x are the retrieved, a priori, and the “true” state vectors, respectively. For TES trace gas retrievals, these are expressed as the natural logarithm of volume mixing ratio (VMR). G is the gain matrix, which maps from measurement (spectral radiance) space into retrieval (profile) space. The vector n represents the noise on the spectral radiances. The vector b represents the true state for those parameters that also affect the modeled radiance (e.g., concentrations of interfering gases, calibration, etc.). The vector ba holds the corresponding a priori values, and the Jacobian Kb = ∂L/∂b describes the dependence of the forward model radiances L on the vector b.
The averaging kernel, A, describes the sensitivity of the retrieval to the true state:
| (2) |
where K is the sensitivity of the forward model radiances to the state vector (K = ∂L/∂x). Sn is the noise covariance matrix, representing the noise in the measured radiances, and Sa is the constraint matrix for the retrieval.
For profile retrievals, the rows of A are functions with some finite width that give a measure of the vertical resolution of the retrieval. The sum of each row of A provides a measure of the fraction of retrieval information that comes from the measurement rather than the a priori (Rodgers, 2000) at the corresponding altitude, provided that the retrieval is relatively linear. The trace of the averaging kernel matrix gives the number of degrees of freedom for signal (DOFS) from the retrieval.
An advantage of the optimal estimation retrieval approach is that an error estimate can be computed in a straightforward manner based on retrieval input parameters. The total error on the retrieved profile can be expressed as the sum of the smoothing error, the measurement error and the systematic errors (Worden et al., 2004). The total error covariance matrix Sx for a given parameter x on the retrieved levels i is given by:
| (3) |
where Sb is the expected covariance of the non-retrieved parameters. The first term on the right-hand-side is the smoothing error, i.e. the uncertainty due to unresolved fine structure in the profile; the second term is the error originating from random noise in the spectrum; while the last term represents the error from uncertainties in the non-retrieved forward model parameters, some of which are systematic and some of which change from retrieval to retrieval. The estimated errors will be discussed in Sect. 3.4.
The relatively low spectral contribution of the methanol infrared nadir signal (~1K brightness temperature for an enhanced profile) to the top of the atmosphere (TOA) radiance compared with that of the background atmospheric state presents additional retrieval challenges relative to more abundant species such as ozone or water vapor. We have therefore provided here a detailed algorithm description. The methanol retrievals are carried out after the retrievals of temperature, water vapor, ozone, methane, carbon dioxide, cloud optical depth and height, and surface temperature and emissivity (Kulawik et al., 2006). For this initial study we only performed retrievals where the TES retrieved cloud optical depths were ≤ 1.0. Details on the Line-By-Line Radiative Transfer Model (LBLRTM) and the fast forward model (OSS-TES) used for the forward model calculations can be found in Clough et al. (2005), Moncet et al. (2008) and Shephard et al. (2009).
2.2. TES CH3OH microwindows
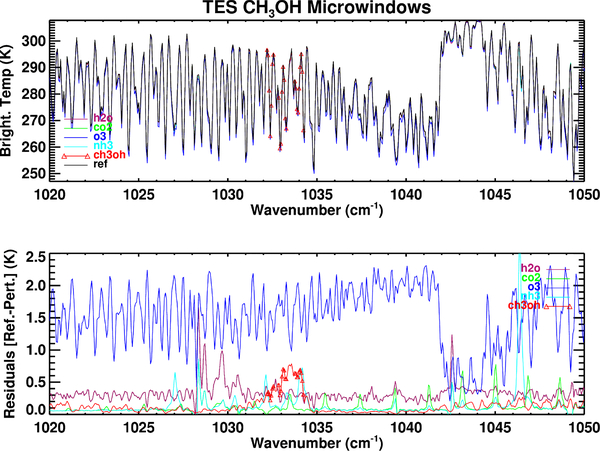
Rather than using an entire TES band, the TES retrieval algorithms define spectral microwindows for retrieving each parameter, in order to reduce the impact of interfering species and increase computational speed. Appropriate microwindow selection is non-trivial for CH3OH, as it is active in the P-branch of the ozone band, and ozone dominates the TOA radiance in this spectral region. We tried two approaches: a CH3OH-only retrieval, and a simultaneous CH3OH/O3 retrieval with highly constrained O3. In each case various microwindows were evaluated based on how the retrievals compared to an ensemble of airborne in situ measurements described by Wells et al. (2012). These measurements included data from recent North American aircraft campaigns over the US, Canada and Mexico during 2006 and 2008. Wells et al. (2012) used the GEOS-Chem model as a transfer standard for comparing the TES retrievals with the aircraft data since there was limited direct overlap between the space-borne and airborne measurements. The best TES performance, based on consistency between the aircraft:model and TES:model slopes and correlation coefficients, was obtained for the methanol-only retrievals, and when using microwindows that include only those spectral regions with the highest CH3OH signal. Figure 1 uses simulated sensitivities to show the radiatively active species in this region. The background and enhanced values used to calculate these sensitivities are shown in Table 1.
Fig. 1.
TES simulated spectra and residuals. Top panel: TES simulated spectra for background amounts of H2O, CO2, O3, NH3, and CH3OH (black line), and for enhanced amounts of each molecule (colored lines). Note that in several cases the perturbed spectra are obscured by the reference spectrum. Bottom panel: residuals computed as the reference spectrum minus the perturbed spectra. In both panels the red triangles show the microwindows used for the methanol retrieval. See Table 1 for background and enhance amounts.
Table 1.
Background and molecular amounts used in Fig. 1.
| Molecule | Background (molec cm−2) | Enhanced (molec cm−2) |
|---|---|---|
| H2O | 5.42×10²² | 5.96×10²² |
| CO2 | 8.09×10²¹ | 8.49×10²¹ |
| O3 | 7.35×10¹⁸ | 8.08×10²¹ |
| NH3 | 1.05×10¹⁴ | 4.91×10¹⁶ |
| CH3OH | 3.16×10¹⁵ | 3.82×10¹⁶ |
The ozone signal is dominant in this spectral region and there are no spectral lines free of ozone influence. Thus an accurate CH3OH retrieval requires an ozone retrieval with minimal residuals. Water vapor and ammonia are active on the edges of the selected CH3OH microwindow, but since these regions are only weakly weighted by the CH3OH Jacobian we decided to include them in order to maximize the signal: only three spectral points around the maximum of the water line near 1032.78 cm−1 were excluded to avoid undue interference from water vapor in the methanol retrievals. The microwindows for the TES CH3OH retrieval are presented in Table 2.
Table 2.
Microwindows for TES CH3OH retrievals*.
| Index | TES Filter | ν1 (cm−1) | ν2 (cm−1) |
|---|---|---|---|
| 1 | 1B2 | 1032.32 | 1032.56 |
| 2 | 1B2 | 1032.86 | 1034.48 |
ν1 and ν2 represent the left and right edges of the microwindows.
2.3. A priori profiles and constraints
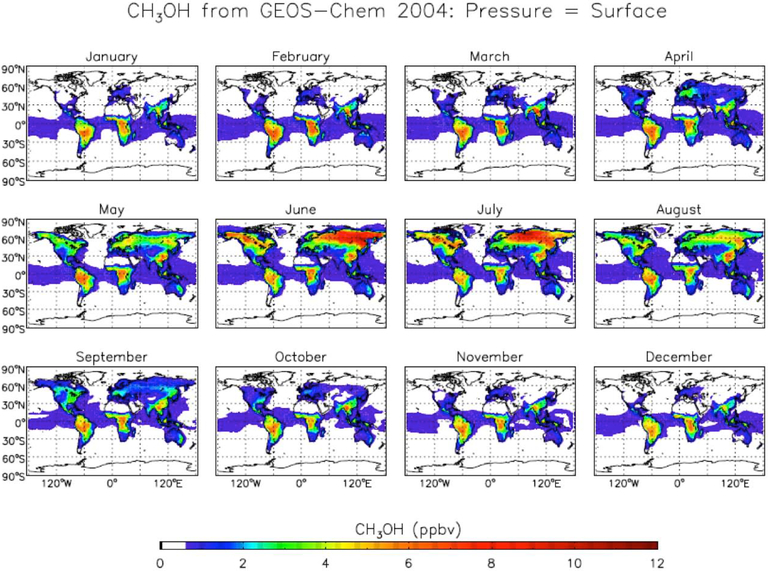
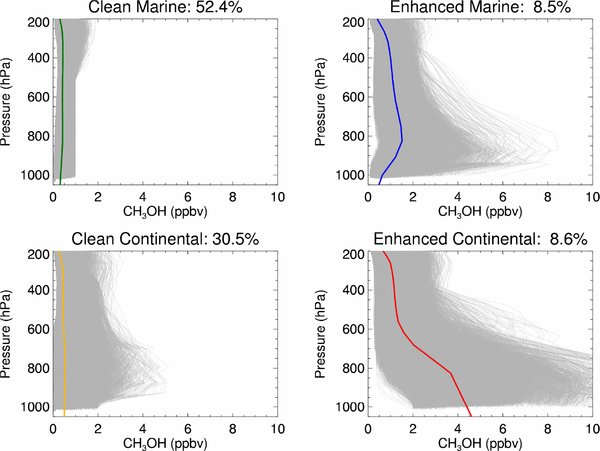
Atmospheric CH3OH varies substantially both geographically and seasonally, as illustrated in Fig. 2, which shows GEOS-Chem monthly mean CH3OH volume mixing ratios at the surface. The GEOS-Chem methanol simulation as used here is described in detail by Millet et al. (2008). Four a priori profiles were generated, two over ocean and two over land, starting from a GEOS-Chem model run on a 2° latitude by 2.5° longitude grid for 2004. Over the ocean, profiles were classified as clean if the maximum concentration below 500 hPa was less than 1.0 ppbv, and enhanced otherwise. The enhanced profile over ocean corresponds to scenarios with outflow from continental regions. Profiles over land were classified as clean if the surface concentration was below 2 ppbv, and enhanced otherwise. Figure 3 shows the individual profiles and the averaged profiles for each category. We employ these four average profiles as the TES a priori profiles, with each model grid box and month assigned one of these representative profiles. At the start of the TES retrieval, the observation coordinates and month are used to select the appropriate stored a priori profile; this initiates the retrieval in the most likely region in retrieval space, and increases the probability of finding an optimal solution. The initial guess for each retrieval is always set to an enhanced profile, either ocean or land, in order to avoid falling into null space on the first retrieval step. Note that the a priori profile may thus differ from the initial guess.
Fig. 2.
Methanol in surface air as simulated by the GEOS-Chem model for 2004.
Fig. 3.
Methanol profiles simulated by GEOS-Chem over the entire globe for 2004 binned by type (in grey). The mean profiles for each category, shown in color, are used as a priori profiles in the TES methanol retrieval. See text for details.
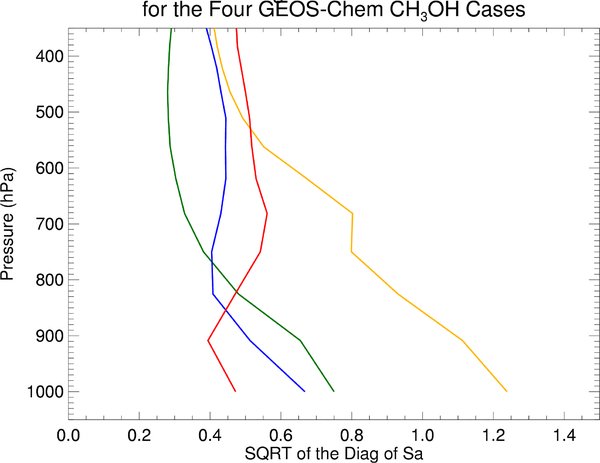
The variability in each of the four a priori profiles is also derived from the GEOS-Chem model data. Since the TES retrieval algorithms operate in log space in order to span the wide range of concentrations and avoid negative results, the constraint matrices and the averaging kernels are also calculated in this space. Figure 4 shows the square roots of the diagonals of the covariance matrices, which are the basis for generating the constraint matrices used in the retrievals. The diagonals were modified to reflect the sensitivity of TES: where there is no TES sensitivity (e.g., above 400 hPa), the variability is reduced in order to obtain tighter constraints at levels with no information from TES. The reduction was achieved by applying a Gaussian based tapering to the diagonals of the covariance matrix. The off-diagonals of the constraint matrix were generated based on a 1-km correlation length.
Fig. 4.
Square root of the diagonal of the covariance matrices for each of the profile types shown in Fig. 3 (green: clean marine, blue: enhanced marine, yellow: clean continental, red: enhanced continental). Note that the covariance matrix is calculated in log space.
3. TES methanol product
3.1. TES CH3 OH retrieval characteristics
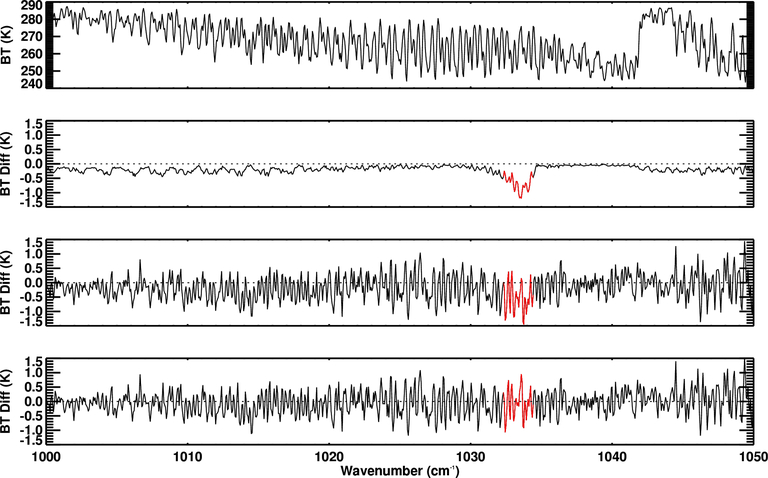
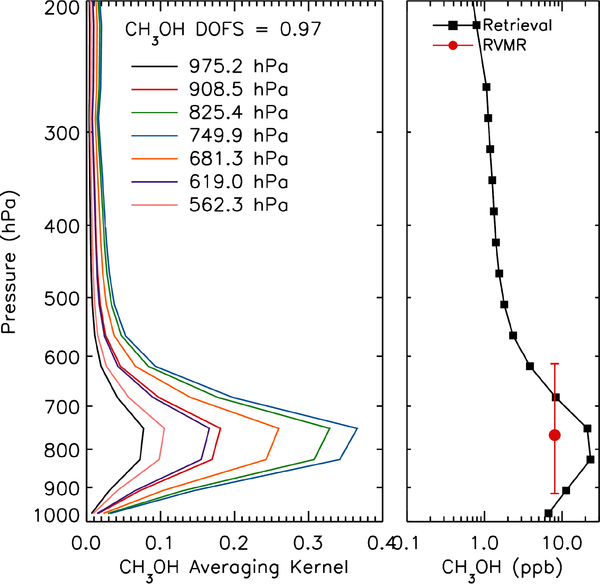
CH3OH is active in the P-branch of the 9.6 μm ozone band. Figure 5 illustrates the methanol signal in a TES spectrum obtained during the second phase of the Arctic Research of the Composition of the Troposphere from Aircraft and Satellites (ARCTAS) campaign (Jacob et al., 2010) over central Canada in June 2008, and shows the reduction of the original residual via the retrieval process. While in this example the methanol feature is clearly visible in the residuals, it is still a relatively weak signal and the amount of information that can be obtained from the TES spectrum is limited. This is confirmed by an analysis of the averaging kernel, shown in the left panel of Fig. 6. The averaging kernel is the sensitivity of the TES retrieval at each level; for this observation (scan) TES is most sensitive to a 3 km region centered at ~800 hPa (~2 km), with ~1.0 degrees of freedom for signal (DOFS). The shape of the averaging kernels shown here is common to the vast majority of the CH3OH retrievals performed, with peak sensitivity typically ranging from 900 to 700 hPa depending on the atmospheric state. The DOFS are usually substantially lower than shown in the example: for the over 2000 successful retrievals performed over land from the TES Global Surveys during July 2009, 52% had DOFS>0.5, and 21% had DOFS>0.8. For the more limited and homogeneous dataset formed by the TES retrievals coincident with the second phase of the ARCTAS campaign during June and July of 2008 over Canada, 81% had DOFS>0.5 and 45% had DOFS>0.8. These higher DOFS reflect stronger signals due to active plant growth and biomass burning. Given the expectation that detectable CH3OH signals would rarely be found over ocean, only a limited number of marine retrievals were performed, of which 8% had DOFS>0.5. However, for a set of 26 retrievals over the Pacific Ocean downwind of the Australian Black Saturday fires during February 2009, 84% had DOFS>0.7.
Fig. 5.
Sample TES methanol measurement over central Canada (59.34◦ N, 106.52◦ W) on 23 June 2008, which coincided with the second phase of the NASA ARCTAS campaign. Top panel: spectral brightness temperature observed by TES. Second panel: CH3OH signal, obtained by differencing third and fourth panels. Third panel: measurement-model residuals based on the initial guess methanol profile. Fourth panel: measurement-model residuals following the methanol retrieval.
Fig. 6.
Averaging kernel (left) and retrieved methanol profile (right) from the TES spectrum in Fig. 5. The red circle shows the methanol Representative Volume Mixing Ratio (RVMR) and the red lines show the vertical extent over which the RVMR applies.
Having typical retrievals with DOFS on the order of one or less signifies that there is at most only one piece of information. Therefore, the shape of the retrieved profile is strongly determined by the a priori profile. It would therefore seem reasonable to retrieve column scale factors, but the sensitivity of the retrieval at any given level varies substantially from profile-to-profile depending on the atmospheric state, so that it is in fact advantageous to retrieve CH3OH at a number of levels. However, for creating maps or comparing with model output or in situ observations, it is useful to collapse each TES profile into a single value that reflects the information provided by the satellite, and is minimally affected by the retrieval a priori. To address this issue, Beer et al. (2008) used an averaging kernel weighted volume mixing ratio (AKVMR) for TES ammonia and methanol retrievals, while Payne et al. (2009) developed a representative tropospheric volume mixing ratio (RTVMR) metric for TES methane profiles. Building from the concepts used in these two approaches, Shephard et al. (2011) developed a more general Representative Volume Mixing Ratio (RVMR) metric that maps the VMR values from all the retrieval levels into a subset that is more representative of the information provided by the measurement (Eq. 4),
| (4) |
where for each level i, w is the weighting function derived from the TES sensitivity, as represented by the averaging kernel, and x is the log of the retrieved mixing ratio.
The RVMR represents an averaged value with the influence of the a priori reduced as much as possible. The level to which the influence is reduced depends on the available information content for the observation: if there is one piece of information from a given retrieval then a single RVMR value can be generated with almost all of the a priori removed (Shepherd et al., 2011). As described by Payne et al. (2009), removing the effect of the a priori simplifies comparisons with in situ data. This is especially true for a species with low DOFS such as CH3OH, where the profile shape, and thus the value at any given level, is strongly determined by the a priori.
By collapsing all the available information to a single value, the RVMR becomes a metric that is sensitive to different atmospheric conditions but can be easily correlated with point measurements. In principle, comparisons with model output would not require the RVMR calculation, but use of the RVMR reduces the impact of the choice of the a priori, and enables model/measurement comparisons that encompass all the available information.
The right panel of Fig. 6 illustrates this mapping from profile to a single RVMR point for the ARCTAS case discussed above. The mapping also provides the vertical range over which the RVMR is valid, which corresponds to the TES vertical resolution for CH3OH. Please see the Supplement for further discussion of the RVMR.
3.2. Evaluating retrieval performance using simulations
To test the performance of the retrieval algorithm, a series of retrievals were performed using simulated TES spectra calculated from 1340 TES Level 2 profiles combined with known methanol profiles. These “truth” profiles were generated from a perturbed GEOS-Chem simulation, corresponding to one of the scenarios modeled by Millet et al. (2008), in which plant growth emissions were increased by 63 %, and total terrestrial emissions by 43 %, relative to the baseline GEOS-Chem simulation used to build the a priori profiles. These profiles were employed by the radiative transfer model to generate TOA radiances. Random noise based on TES instrument noise characteristics was then added to the calculated radiances.
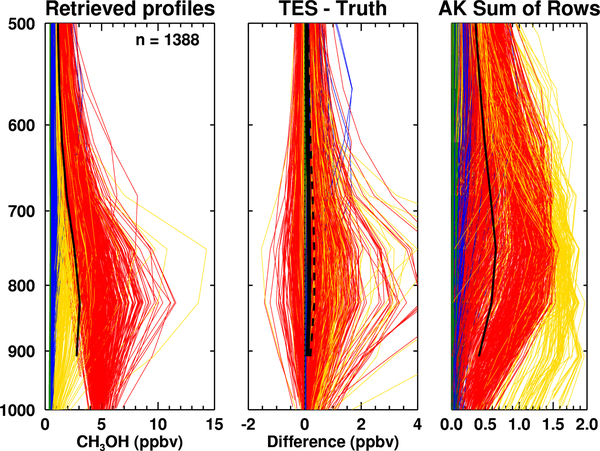
These simulated radiances were provided as inputs to the retrieval algorithm, and the retrieved profiles compared against the known “true” profiles. For these simulated retrievals, the a priori profile for each case was selected from one of the four a priori profiles described above based on time of year and location. The initial guess profiles for the retrievals were determined by location only, and set to either enhanced marine or enhanced continental, as discussed in Sect. 2.3. The retrieved profiles have a mean positive bias of 0.16 ppbv at 825 hPa with respect to the true profiles with TES operator applied (Fig. 7). This low value indicates that the retrieval is performing well under ideal conditions, and that the systematic errors inherent in the algorithm are minor.
Fig. 7.
Simulated methanol retrievals over North America in July 2008. Colored curves indicate the a priori selection (green: clean marine, blue: enhanced marine, yellow: clean continental, red: enhanced continental). Left panel: retrieved profiles, with the mean retrieved profile in black. Middle panel: retrieved minus true profiles. The solid line shows the mean bias, while the dashed line shows the standard deviation of the bias. Right panel: sum of the averaging kernel rows (SRAK) for each profile, with the mean in black. Means and standard deviations are not calculated for the surface level, since the height of this levels ranges from above 1000 to less than 800 hPa.
A more refined picture of the retrieval bias and variance was obtained by binning by a priori type, as show in Table 3. Note that the set of profiles classified as clean marine had a mean RVMR below the detection limit of the algorithm (~1 ppbv, see Sect. 3.3). The mean DOFS for this set was 0.03, thus the retrieval had virtually no information and essentially returned the a priori profile. Retrievals using the “enhanced marine” a priori had a mean positive bias of approximately 16 %, driven by proximity to the low end of the algorithm sensitivity. The “clean continental” profiles presented a similar bias, which in this set was caused by the retrieval occasionally significantly overshooting the true answer. Finally, the enhanced continental cases, for which the methanol signal is relatively strong, show a 6% positive bias.
Table 3.
Simulated retrieval results at level of maximum sensitivity (825 hPa for continental and clean marine cases, 619 hPa for enhanced marine case).
| A priori | Mean (ppbv) | Bias (ppbv) | SD (σ) |
|---|---|---|---|
| Clean Marine | 0.46 | 0.02 (4%) | ±0.02 (4%) |
| Enhanced Marine | 0.83 | 0.13 (16%) | ±0.10 (12%) |
| Clean Continental | 2.3 | 0.52 (22%) | ±0.56 (24%) |
| Enhanced Continental | 4.9 | 0.30 (6%) | ±0.57 (12 %) |
While the bias is small, an examination of the retrieved profiles in Fig. 7 reveals that the algorithm tends to increase the amount of methanol in the region where TES is most sensitive, between 700 and 900 hPa, distorting the profile shape. This provides an additional argument for using the RVMR when comparing TES data with in situ measurements or model output, as it removes the impact of this artifact.
3.3. TES methanol detection limits
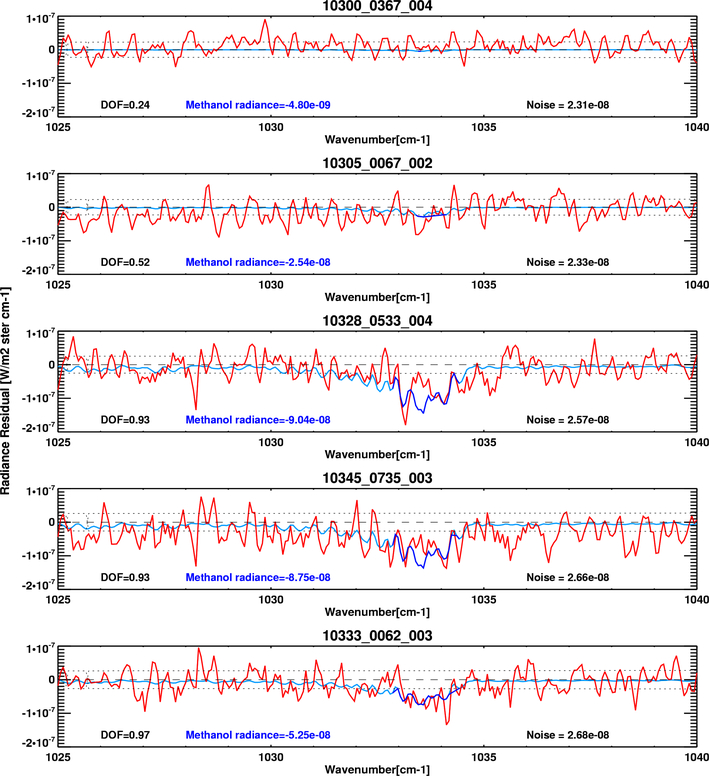
A key parameter for assessing the utility of the TES CH3OH retrievals is the limit of detection: i.e., the minimum concentration threshold for detecting this species, or more explicitly the atmospheric CH3OH concentration required for the retrieval to return a value that is appreciably different from the a priori. To quantify this, we focused on a series of observations from a TES Global Survey (GS) run from February 2009 during the NASA Intercontinental Transport Experiment-Phase B (INTEX-B) aircraft campaign (Singh et al., 2009). A sample of the results is shown in Fig. 8. In each case we computed simulated radiances using the standard TES retrieved variables (water vapor, ozone, methane, surface temperature, emissivity, and cloud optical depth and height) and the retrieved CH3OH profile; this calculation was then repeated for the same atmosphere without CH3OH. The measured residual in the methanol band was computed by subtracting the latter radiance from the measured TES spectrum (red curve in Fig. 8).
Fig. 8.
Methanol spectral signal in the TES observations. Shown are sample differences between measured TES spectra and forward model runs with no methanol (red curves), and the corresponding differences between forward model runs with retrieved methanol and no methanol (light blue curves). The methanol radiance is the mean of the latter over the spectral range highlighted in dark blue. The dotted lines indicate the expected noise level.
We then calculated the methanol signal by differencing the two simulated radiances (light blue curve in Fig. 8). The estimated TES noise level in this spectral region is shown as dotted lines. We defined the “methanol radiance” as the mean of the methanol signal (dark blue) over the spectral points where this signal was greater than the noise in the retrieval window; if the methanol signal never rose above the noise we calculated the methanol radiance as the mean methanol signal over the three points closest to the peak of the methanol feature. In Fig. 8, the top panel shows no methanol signal, the second panel a very weak signal, the bottom three panels very clear methanol signals. This analysis illustrates that the measured residuals match the methanol radiances quite well, and that the agreement increases with increasing signal strength. This not only provides confidence that the retrieval is robust, but suggests a reasonable metric for determining detection: the ratio of the methanol radiance to the expected noise, or signal-to-noise ratio (SNR).
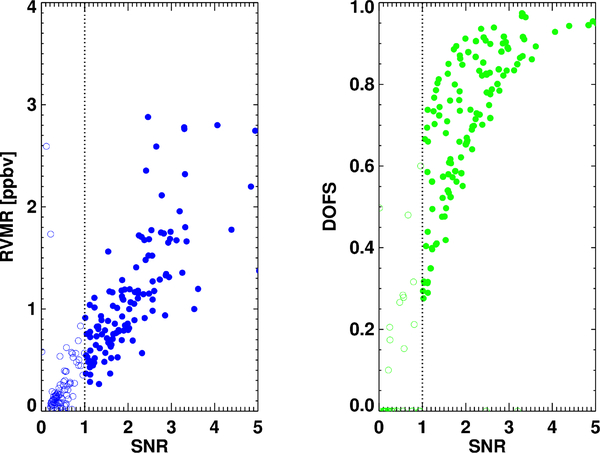
The SNR was calculated for all the successful TES CH3OH retrievals over land from an October 2009 Global Survey. Figure 9a shows the corresponding RVMR values plotted as a function of the SNR. There is a linear relationship, with some scatter, between RVMR and SNR for RVMR less than 2. For most RVMR values greater than 0.5, the SNR is greater than 1 (circles are filled), and even for RVMR values less than 0.5 there are a number of cases with SNR greater than 1. Thus, the minimum detectable RVMR lies in the range of 0.5 and 1.0 ppbv, depending on the atmospheric conditions. This corresponds roughly to a profile that reaches a peak concentration of at least 1 to 2 ppbv.
Fig. 9.
Signal-to-noise ratio (SNR) and degrees of freedom for signal (DOFS) in the TES methanol observations. Left panel: RVMR values as a function of the SNR for a Global Survey from October 2009. Right panel: DOFS as a function of SNR for the same Global Survey. Empty circles have SNR<1.0.
Users of the TES methanol product will not be provided as a matter of course with the methanol radiance value. A plausible proxy for the methanol radiance is the DOFS, which is calculated during the retrieval. Figure 9b shows that the DOFS and the methanol radiance are strongly correlated. If we impose the condition that the methanol radiance should be greater than noise level, then we see that in general the DOFS for these cases are greater than 0.5. This does not necessarily mean that cases with DOFS less than 0.5 should be rejected, but rather that the user needs to be aware they will be strongly influenced by the prior, or equivalently, that the retrieval added little to the estimate of the true state. Scenes with low DOFS frequently correspond to cases with limited signal due to relatively clean conditions, but they can also occur in cloudy conditions and in cases where there is little thermal contrast between the surface and the atmospheric layers containing methanol.
3.4. TES CH3OH error estimates
The error estimate for the optimal estimation algorithm is given in Sect. 2.1 by Eq. (3). The smoothing error (first term) and the error from the noise in the radiance measurement (second term) are direct by-products of the retrieval process. These errors can be mapped into RVMR space as follows:
| (5) |
where E is the error in the RVMR, W is the weighting function that maps from profile to RVMR space, and H is the Hessian, given by
| (6) |
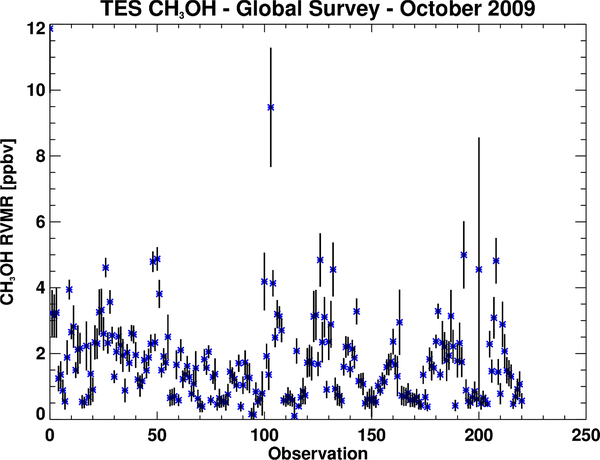
Estimated errors were calculated for the same October 2009 Global Survey used to generate the relationships shown in Fig. 9. The median of the estimated absolute errors is 0.29 ppbv, with 50% of the errors between 0.23 and 0.45 ppbv (Fig. 10); this translates into uncertainties ranging from 6% (on larger values) to 35% or more. The higher relative errors usually occur for smaller RVMR values close to the detection limit (see Sect. 3.3).
Fig. 10.
Sequence of retrieved methanol RVMR values from TES for the October 2009 GS used in Fig. 9. The x-axis values are simply an index indicating order in time. The error bars include both noise and smoothing error.
The last term in Eq. (3) contains the systematic errors, which we have not included in the calculation above. One potential source of systematic error in the retrieval is uncertainty in the spectroscopic parameters. The spectroscopic parameters originate from the HITRAN 2004 compilation (Rothman et al., 2005) and are described in the paper by Xu et al. (2004). Intensities and positions for CH3OH (atomic mass of 32) in the 10 μm region are based on two sets of laboratory measurements. Air-broadened width, self-broadened width, and temperature dependence are fixed at 0.1, 0.5 and 0.75, respectively. The uncertainty in line intensities is estimated at 9 %; this will translate almost directly into an equivalent uncertainty in the CH3OH RVMR.
Another source of systematic error is propagation of the error in the ozone retrieval into the methanol error. While the calculation is straightforward, it requires storing Jacobians and gain matrices, which we were not able to do for a dataset sufficiently large to provide reliable statistics. Note that the ozone retrieval itself does not need to be perfectly accurate for the methanol retrieval to return a valid result. A profile that reduces the residuals to, or close to the noise level, is all that is required.
4. Results from TES global surveys
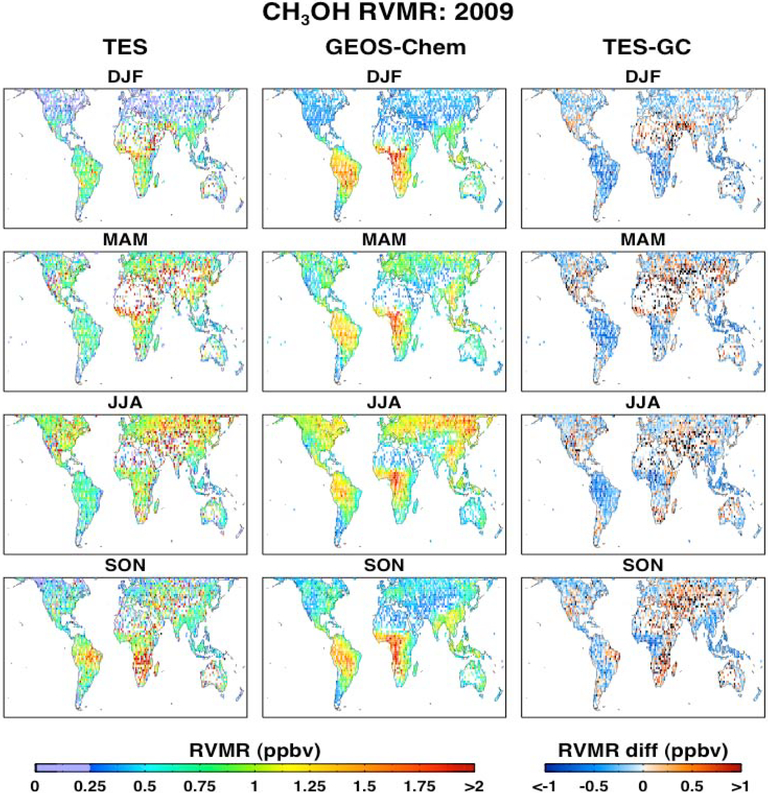
We carried out an initial assessment of the TES retrieval performance by comparing all 2009 TES Global Surveys over land with the corresponding GEOS-Chem values (Fig. 11, left panels). The GEOS-Chem values are calculated using the simulation described in Millet et al. (2008), with GEOS-5 assimilated meteorological fields degraded to 2°×2.5° resolution and 47 vertical levels, and emissions updates as described in Wells et al. (2012). The terrestrial biogenic emissions are calculated using the MEGANv2.1 parameterization (Stavrakou et al., 2011), and the biomass burning emissions are taken from the monthly GFEDv2 database (van der Werf et al., 2006). GFEDv2 only extends through 2008, so that 2008 emissions are used for the 2009 simulation.
Fig. 11.
Seasonally averaged CH3OH RVMR on a 2×2.5° grid for 2009. Left panels: retrieved values from TES. Midde panels: simulated values from GEOS-Chem with TES averaging kernel applied. Right panels: TES-GEOS-Chem.
The retrieved TES values were seasonally averaged over the 2×2.5° GEOS-Chem model grid boxes. Each retrieval was matched with a collocated GEOS-Chem profile, to which the TES observational operator and RVMR weighting were applied. Model results were also temporally averaged in the same manner as the TES retrievals (Fig. 10, middle panels). The TES data in general are more spatially variable than the simulated values from GEOS-Chem. The dearth of retrievals over North Africa and the Arabian Peninsula is due to issues with retrieving accurate surface emissivity for these barren areas. We are evaluating an emissivity threshold to reject possible spurious methanol retrievals over barren regions.
The TES and GEOS-Chem maps exhibit some similar large-scale patterns. In the northern extratropics, the TES methanol observations and the simulated concentrations from GEOS-Chem both show substantially higher methanol abundance during summer, when the biosphere is active, and low values during the boreal winter. In tropical sub-Saharan Africa, the TES data reveal elevated concentrations throughout the year. However, the observed seasonal variation in methanol over South America, with higher TES values during the dry season and lower TES values in other months, is substantially stronger than in the model (Fig. 11). The model simulation uses the GFEDv2 (van der Werf et al., 2006) biomass burning inventory, which extends only through 2008, whereas the satellite data are for 2009. Nonetheless, it may be that the model is underestimating the seasonal importance of biomass burning methanol emissions in these tropical regions. It is also possible that biogenic methanol emissions from tropical forests undergo stronger seasonal swings than presently thought (Myneni et al., 2007).
Figure 11 shows that the TES CH3OH measurements are lower than predicted by GEOS-Chem over certain parts of the northern hemisphere, including Canada, Siberia, and the US Southeast. However, the most striking differences occur over arid regions such as Central Asia and the US Southwest, where the model values are significantly too low. This is consistent with a comparison between IASI satellite measurements and the IMAGESv2 model presented by Stravrakou et al. (2011). In the southern hemisphere, the methanol concentrations measured by TES are lower than those simulated by GEOS-Chem over the bulk of South America during southern hemisphere summer, fall and winter, but higher during the biomass burning season. A high model bias is also seen over southern Africa during summer, but the difference pattern has more spatial variability in the other seasons, with the southernmost and eastern regions exhibiting higher TES values more frequently as the year progresses.
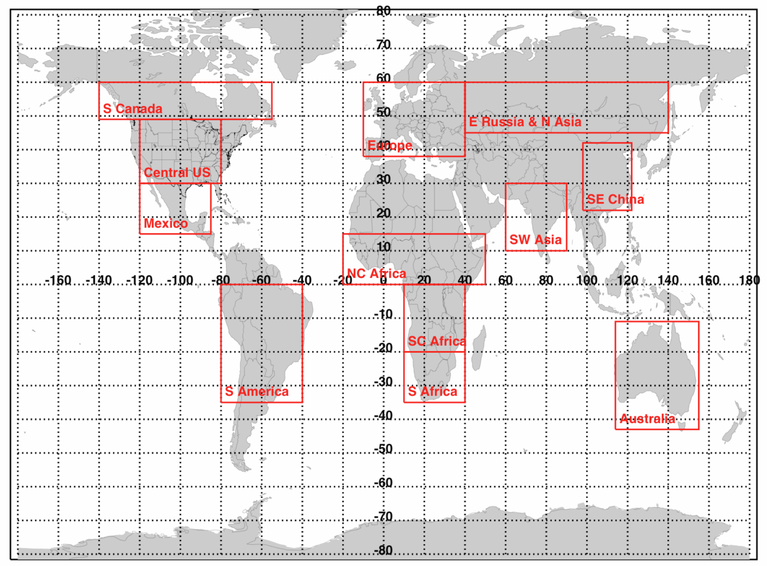
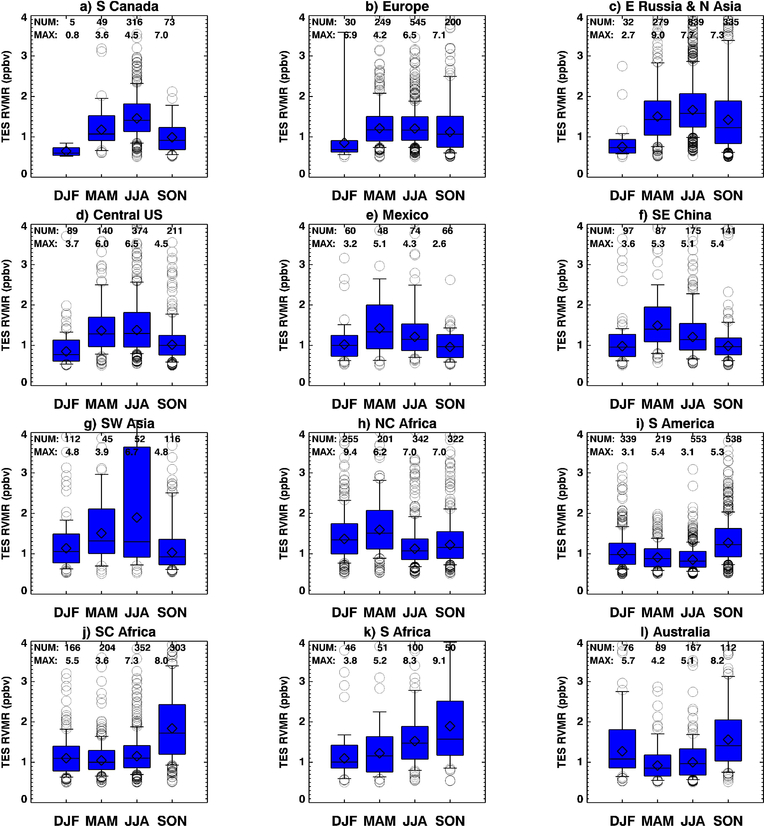
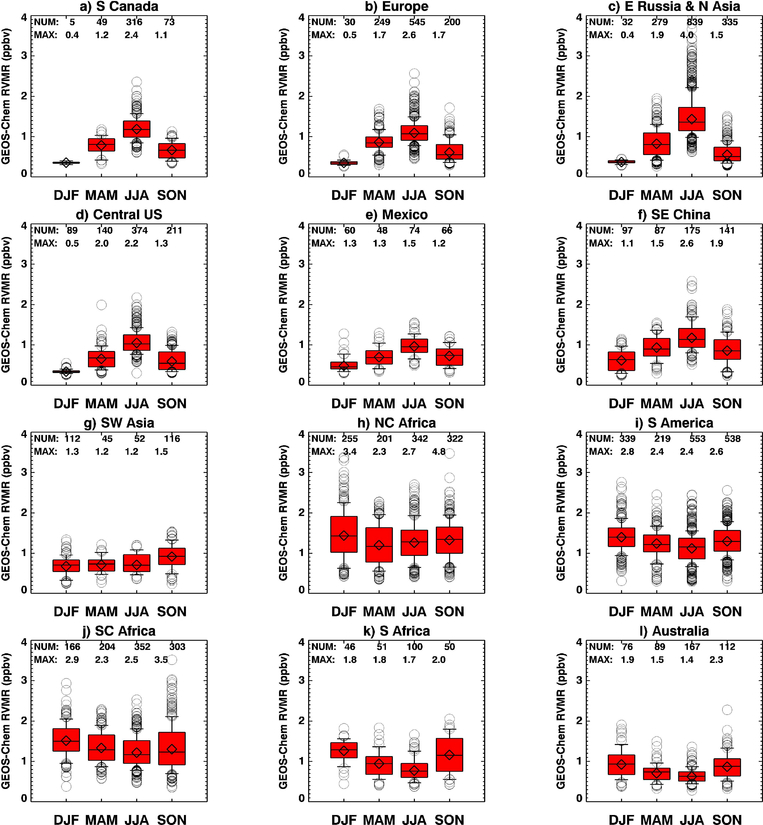
By aggregating over large regions (Fig. 12) it becomes possible to resolve more coherent patterns. Figure 13 presents a statistical summary of the seasonal patterns observed by TES over the regions of Fig. 12. Figure 14 shows the corresponding statistics for GEOS-Chem. Over the northern midlatitudes (panels a–f of Figs. 13 and 14) GEOS-Chem underestimates the observed methanol concentrations. This is the same conclusion reached by Wells et al. (2012) in their analysis of aircraft measurements over North America. On the other hand, Stavakrou et al. (2011) did not see significant differences between IASI methanol measurements and simulated values from the IMAGESv2 model over this region, except over the arid western US, where they did infer a model underestimate. These differing results could either reflect the greater sensitivity of TES to methanol concentrations close to the surface, or differences between the canopy models and meteorological fields used in GEOS-Chem and IMAGESv2. TES measures much higher CH3OH than simulated by GEOS-Chem over southwest Asia (Figs. 13g and 14g) for all seasons, and reveals a strong summer peak that is not captured by the model. In the southern hemisphere, we see a stronger spring peak in the TES observations than is apparent in the model (panels i–l of Figs. 13 and 14); Stavrakou et al. (2011) found a similar signal in the IASI methanol data over western Australia, but not over South America, where the IMAGESv2 model was found to overestimate atmospheric methanol with respect to IASI measurements in all seasons. These concurrent measurements from space from instruments with significantly different capabilities (TES with greater sensitivity, IASI with greater temporal and spectral coverage) demonstrate the power of satellite data to test and improve current models, as well as the need for more validation data to better characterize the uncertainty in the measurements.
Fig. 12.
Regions employed for the seasonal analyses in Figs. 13 and 14.
Fig. 13.
Statistics of the TES CH3OH RVMR values in Fig. 11 for each region in Fig. 12. Boxes show the 25th and 75th percentiles, the line and diamond show the median and the mean, the whiskers show the 10th and 90th percentiles, and the outliers are indicated by the circles.
Fig. 14.
Statistics of the GEOS-Chem CH3OH RVMR values in Fig. 11 for each region in Fig. 12. Plotting conventions are as in Fig. 13.
5. Conclusions
An approach for retrieving atmospheric methanol from TES spectra has been developed and tested. The algorithm has been designed to run after retrievals of temperature, water vapor, ozone, cloud optical depth and height, and surface temperature and emissivity, at which point in the processing the radiance residuals are expected to be on the order of the TES noise level. Various CH3OH retrieval strategy approaches were evaluated; the best results, based on comparisons with aircraft measurements, were obtained by performing a single molecule sequential retrieval using a narrow spectral region centered on the peak of the methanol absorption feature around 1034 cm−1, and microwindowing around a strong water vapor line. Utilizing this small methanol spectral region minimizes any impact from interfering species.
The retrieval has maximum sensitivity between 900 and 700 hPa, and a resolution of about 5 km. The DOFS are usually below 1.0, implying that the a priori significantly influences the shape of the retrieved profile. In order to reduce the impact from the a priori, a representative volume mixing ratio (RVMR) was used to compare with model output. The minimum detectable RVMR is typically between 0.5 and 1.0 ppbv, depending on atmospheric conditions, corresponding to profiles with peak methanol abundance of at least 1 to 2 ppbv.
Retrievals for a set of simulated TES radiances over North America in July 2008 showed a 0.16 ppbv mean bias with standard deviation of 0.34 ppbv at 825 hPa. The average relative bias ranged from 6% to 22 %, depending on the a priori type. In general the largest differences from the “true” profiles for these simulated retrievals occurred at the peak of the averaging kernel, as the retrieval tends to place methanol at the peak level of instrument sensitivity. Employing the RVMR when interpreting the TES data reduces the impact of this effect. The estimated errors for retrievals based on measured radiances range from 6 to 35 %, with the largest relative errors corresponding to low methanol abundance.
A global ensemble of TES methanol retrievals for 2009 shows general agreement with the large-scale features simulated by GEOS-Chem, but also reveals significant regional discrepancies in seasonality and amplitude. Most notably, TES reveals a stronger-than-predicted springtime peak in the northern hemisphere midlatitudes, as also found by Wells et al. (2012). Other seasonal discrepancies, especially during the biomass burning season, are apparent over regions such as Southwest Asia, South America, and parts of Africa. Future work will apply the TES data to investigate these differences in terms of their implications for our understanding of methanol emission processes. The algorithm described in this paper is under implementation at JPL and will become part of the operational retrieval code (V006) in 2013.
Supplementary Material
Acknowledgements.
We thank Tom Connor, Alan Lipton, Jean-Luc Moncet, and Gennady Uymin of AER for building an OSS version for TES. Research at JPL was supported under contract to the National Aeronautics and Space Administration (NASA). Research at AER was supported under contract to NASA and the University of Minnesota. Work at UMN was supported by NASA through the Atmospheric Chemistry Modeling and Analysis Program (Grant #NNX10AG65G) and by the University of Minnesota Supercomputing Institute.
Footnotes
Supplementary material related to this article is available online at: http://www.atmos-chem-phys.net/12/8189/2012/acp-12-8189-2012-supplement.pdf.
References
- Beer R, Glavich TA, and Rider DM: Tropospheric emission spectrometer for the Earth Observing System’s Aura satellite, Appl. Optics 40, 2356–2367, 2001. [DOI] [PubMed] [Google Scholar]
- Beer R, Shephard MW, Kulawik SS, Clough SA, Eldering A, Bowman KW, Sander SP, Fisher BM, Payne VH, Luo M, Osterman GB, and Worden JR: First satellite observations of lower tropospheric ammonia and methanol, Geophys. Res. Lett, 35, L09801, doi: 10.1029/2008GL033642, 2008. [DOI] [Google Scholar]
- Bowman KW, Rodgers CD, Sund-Kulawik S, Worden J, Sarkissian E, Osterman G, Steck T, Luo M, Eldering A, Shephard MW, Worden H, Clough SA, Brown PD, Rinsland CP, Lampel M, Gunson M, and Beer R, Tropospheric emission spectrometer: Retrieval method and error analysis, IEEE Geosci. Remote Sens, 44, 1297–1307, doi: 10.1109/TGRS.2006.871234, 2006. [DOI] [Google Scholar]
- Clough SA, Shephard MW, Mlawer EJ, Delamere JS, Iacono MJ, Cady-Pereira K, Boukabara S, and Brown RD: Atmospheric radiative transfer modeling: a summary of the AER codes, J. Quant. Spectrosc. Radiat. Transfer, 91, 233–244, 2005. [Google Scholar]
- Clough SA, Shephard MW, Worden J, Brown PD, Worden HM, Luo M, Rodgers CD, Rinsland CP, Goldman A, Brown L, Kulawik SS, Eldering A, Lampel MC, Osterman G, Beer R, Bowman K, Cady-Pereira KE, and Mlawer EJ: Forward Model and Jacobians for Tropospheric Emission Spectrometer Retrievals, IEEE Trans. Geosci. Remote Sens, 44, 1308–1323, 2006. [Google Scholar]
- de Gouw JA, Middlebrook AM, Warneke C, Goldan PD, Kuster WC, Roberts JM, Fehsenfeld FC, Worsnop DR, Canagaratna MR, Pszenny AAP, Keene WC, Marchewka M, Bertman SB, and Bates TS: Budget of organic carbon in a polluted atmosphere: Results from the New England Air Quality Study in 2002, J. Geophys. Res, 110, D16305, doi: 10.1029/2004JD005623, 2005. [DOI] [Google Scholar]
- Dufour G, Boone CD, Rinsland CP, and Bernath PF: First space-borne measurements of methanol inside aged southern tropical to mid-latitude biomass burning plumes using the ACE-FTS instrument, Atmos. Chem. Phys, 6, 3463–3470, doi: 10.5194/acp-6-3463-2006, 2006. [DOI] [Google Scholar]
- Dufour G, Szopa S, Hauglustaine DA, Boone CD, Rinsland CP, and Bernath PF: The influence of biogenic emissions on upper-tropospheric methanol as revealed from space, Atmos. Chem. Phys, 7, 6119–6129, doi: 10.5194/acp-7-6119-2007, 2007. [DOI] [Google Scholar]
- Eldering A, Kulawik SS, Worden J, Bowman K, and Osterman G: Implementation of cloud retrievals for TES atmospheric retrievals: 2. Characterization of cloud top pressure and effective optical depth retrievals, J. Geophys. Res, 113, D16S37, doi: 10.1029/2007JD008858, 2008. [DOI] [Google Scholar]
- Heikes BG, Chang WN, Pilson MEQ, Swift E, Singh HB, Guenther A, Jacob DJ, Field BD, Fall R, Riemer D, and Brand L: Atmospheric methanol budget and ocean implication, Global Biogeochem. Cy, 16, 1133, doi: 10.1029/2002GB001895, 2002. [DOI] [Google Scholar]
- Holzinger R, Warneke C, Hansel A, Jordan A, Lindinger W, Scharffe DH, Schade G, and Crutzen PJ: Biomass burning as a source of formaldehyde, acetaldehyde, methanol, acetone, acetonitrile, and hydrogen cyanide, Geophys. Res. Lett, 26, 1161–1164, 1999. [Google Scholar]
- Hu L, Millet DB, Mohr MJ, Wells KC, Griffis TJ, and Helmig D: Sources and seasonality of atmospheric methanol based on tall tower measurements in the US Upper Midwest, Atmos. Chem. Phys, 11, 11145–11156, doi: 10.5194/acp-11-11145-2011, 2011. [DOI] [Google Scholar]
- Jacob DJ, Crawford JH, Maring H, Clarke AD, Dibb JE, Emmons LK, Ferrare RA, Hostetler CA, Russell PB, Singh HB, Thompson AM, Shaw GE, McCauley E, Pederson JR, and Fisher JA: The Arctic Research of the Composition of the Troposphere from Aircraft and Satellites (ARCTAS) mission: design, execution, and first results, Atmos. Chem. Phys, 10, 5191–5212, doi: 10.5194/acp-10-5191-2010, 2010. [DOI] [Google Scholar]
- Kulawik SS, Worden J, Eldering A, Bowman K, Gunson M, Osterman GB, Zhang L, Clough S, Shephard MW and Beer R: Implementation of cloud retrievals for Tropospheric Emission Spectrometer (TES) atmospheric retrievals: part 1. Description and characterization of errors on trace gas retrievals, J. Geophys. Res, 111, D24204, doi: 10.1029/2005JD006733, 2006. [DOI] [Google Scholar]
- Macdonald RC and Fall R: Detection of substantial emissions of methanol from plants to the atmosphere, Atmos. Environ, 27, 1709–1713, 1993. [Google Scholar]
- Millet DB, Jacob DJ, Custer TG, de Gouw JA, Goldstein AH, Karl T, Singh HB, Sive BC, Talbot RW, Warneke C, and Williams J: New constraints on terrestrial and oceanic sources of atmospheric methanol, Atmos. Chem. Phys, 8, 6887–6905, doi: 10.5194/acp-8-6887-2008, 2008. [DOI] [Google Scholar]
- Moncet J-L, Uymin G, Lipton AE, and Snell HE: Infrared radiance modeling by optimal spectral sampling, J. Atmos. Sci, 65, 3917–3934, 2008. [Google Scholar]
- Myneni RB, Yang W, Nemani RR, Huete AR, Dickinson RE, Knyazikhin Y, Didan K, Fu R, Negrón Juárez RI, Saatchi SS, Hashimoto H, Ichii K, Shabanov NV, Tan B, Ratana P, Privette JL, Morisette JT, Vermote EF, Roy DP, Wolfe RE, Friedl MA, Running SW, Votava P, El-Saleous N, Devadiga S, Su Y, and Salomonson VV: Large seasonal changes in leaf area of Amazon rainforests, Proc. Natl. Acad. Sci, 104, 4820–4823, doi: 10.1073/pnas.0611338104, 2007. [DOI] [PMC free article] [PubMed] [Google Scholar]
- Payne VH, Clough SA, Shephard MW, Nassar R, and Logan JA: Information-centered representation of retrievals with limited degrees of freedom for signal: Application to methane from the Tropospheric Emission Spectrometer, J. Geophys. Res, 114, D10307, doi: 10.1029/2008JD010155, 2009. [DOI] [Google Scholar]
- Razavi A, Karagulian F, Clarisse L, Hurtmans D, Coheur PF, Clerbaux C, Müller JF, and Stavrakou T: Global distributions of methanol and formic acid retrieved for the first time from the IASI/MetOp thermal infrared sounder, Atmos. Chem. Phys, 11, 857–872, doi: 10.5194/acp-11-857-2011, 2011. [DOI] [Google Scholar]
- Rodgers CD: Inverse methods for atmospheric Sounding: Theory and Practice, World Sci., Hackensack, NJ, USA, 2000. [Google Scholar]
- Rothman LS, Jaquemart D, Barbe A, Benner CD, Birk M, Brown LR, Carleer MR, Chackerian C, Chance K, Coudert LH, Dana V, Devi VM, Flaud J-M, Gamache RR, Goldman A, Hartmann J-M, Jucks KW, Maki AG, Mandin J-Y, Massie ST, Orphal J, Perrin A, Rinsland CP, Smith MAH, Tennyson J, Tolchenov RN, Toth RA, Vander Auwera J, Varanasi P, and Wagner G: The HITRAN 2004 molecular spectroscopic database, J. Quant. Spectrosc. Radiat. Transfer, 96, 139–204, 2005. [Google Scholar]
- Shephard MW, Worden HM, Cady-Pereira KE, Lampel M, Luo M, Bowman KW, Sarkissian E, Beer R, Rider DM, Tobin DC, Revercomb HE, Fisher BM, Tremblay D, Clough SA, Osterman GB, and Gunson M: Tropospheric Emission Spectrometer Spectral Radiance Comparisons, J. Geophys. Res, 113, D15S05, doi: 10.1029/2007JD008856, 2008. [DOI] [Google Scholar]
- Shephard MW, Clough SA, Payne VH, Smith WL, Kireev S, and Cady-Pereira KE: Performance of the line-by-line radiative transfer model (LBLRTM) for temperature and species retrievals: IASI case studies from JAIVEx, Atmos. Chem. Phys, 9, 7397–7417, doi: 10.5194/acp-9-7397-2009, 2009. [DOI] [Google Scholar]
- Shephard MW, Cady-Pereira KE, Luo M, Henze DK, Pinder RW, Walker JT, Rinsland CP, Bash JO, Zhu L, Payne VH, and Clarisse L: TES ammonia retrieval strategy and global observations of the spatial and seasonal variability of ammonia, Atmos. Chem. Phys, 11, 10743–10763, doi: 10.5194/acp-11-10743-2011, 2011. [DOI] [Google Scholar]
- Singh HB, Brune WH, Crawford JH, Flocke F, and Jacob DJ: Chemistry and transport of pollution over the Gulf of Mexico and the Pacific: spring 2006 INTEX-B campaign overview and first results, Atmos. Chem. Phys, 9, 2301–2318, doi: 10.5194/acp-9-2301-2009, 2009. [DOI] [Google Scholar]
- Stavrakou T, Guenther A, Razavi A, Clarisse L, Clerbaux C, Coheur PF, Hurtmans D, Karagulian F, De Maziere M, Vigouroux C, Amelynck C, Schoon N, Laffineur Q, Heinesch B, Aubinet M, Rinsland C, and Muller JF: First space-based derivation of the global atmospheric methanol emission fluxes, Atmos. Chem. Phys, 11, 4873–4898, doi: 10.5194/acp-11-4873-2011, 2011. [DOI] [Google Scholar]
- Tie X, Guenther A, and Holland E: Biogenic methanol and its impacts on tropospheric oxidants, Geophys. Res. Lett, 30, 1881, doi: 10.1029/2003GL017167, 2003 [DOI] [Google Scholar]
- Tyndall GS, Cox RA, Granier C, Lesclaux R, Moortgat GK, Pilling MJ, Ravishankara AR, and Wallington TJ: Atmospheric chemistry of small organic peroxy radicals, J. Geophys. Res, 106, 12157–12182, 2001. [Google Scholar]
- van der Werf GR, Randerson JT, Giglio L, Collatz GJ, Kasibhatla PS, and Arellano AF Jr.: Interannual variability in global biomass burning emissions from 1997 to 2004, Atmos. Chem. Phys, 6, 3423–3441, doi: 10.5194/acp-6-3423-2006, 2006. [DOI] [Google Scholar]
- Wells KC, Millet DB, Hu L, Cady-Pereira KE, Xiao Y, Shephard MW, Clerbaux CL, Clarisse L, Coheur P-F, Apel EC, de Gouw J, Warneke C, Singh HB, Goldstein AH, and Sive BC: Tropospheric methanol observations from space: retrieval evaluation and constraints on the seasonality of biogenic emissions, Atmos. Chem. Phys, 12, 5897–5912, doi: 10.5194/acp-12-5897-2012, 2012. [DOI] [PMC free article] [PubMed] [Google Scholar]
- Worden J, Kulawik SS, Shephard MW, Clough SA, Worden H, Bowman K, and Goldman A: Predicted errors of tropospheric emission spectrometer nadir retrievals from spectral window selection, J. Geophys. Res, 109, D09308, doi: 10.1029/2004JD004522, 2004. [DOI] [Google Scholar]
- Xiao Y, Cady-Pereira KE, Payne VH, Millet DB, Shephard MW, Luo M, Alvarado M, Wells KC, Apel EC, Campos TL, Singh HB, and Sachse GW: Methanol-CO correlations in Mexico City pollution outflow from aircraft and satellite during MILAGRO, Atmos. Chem. Phys. Discuss, 12, 5705–5738, doi: 10.5194/acpd-12-5705-2012, 2012. [DOI] [Google Scholar]
- Xu LH, Lees RM, Wang P, Brown LR, Kleiner I, and Johns JWC: New assignments, line intensities, and HITRAN database for CH3 OH at 10 mm, J. Mol. Spectrosc, 228, 453–470, 2004. [Google Scholar]
Associated Data
This section collects any data citations, data availability statements, or supplementary materials included in this article.


