

Abstract
Cancer immunotherapies, including immune checkpoint inhibitor (ICI)-based therapies, have revolutionized cancer treatment. However, patient response to ICIs is highly variable, necessitating the development of methods to quickly assess efficacy. In this study, an array of miniaturized bioreactors has been developed to model tumor-immune interactions. This immunotherapeutic high-throughput observation chamber (iHOC) is designed to test the effect of anti-PD-1 antibodies on cancer spheroid (MDA-MB-231, PD-L1+) and T cell (Jurkat) interactions. This system facilitates facile monitoring of T cell inhibition and re-activation using metrics such as tumor infiltration and interleukin-2 (IL-2) secretion. Status of the tumor-immune interactions can be easily captured within the iHOC by measuring IL-2 concentration using micropillar array where sensitive, quantitative detection is allowed after antibody coating on the surface of array. The iHOC is a platform that can be used to model and monitor cancer-immune interactions in response to immunotherapy in a high-throughput manner.
Keywords: cancer-on-a-chip, drug screening, immune checkpoint inhibitor, cancer immunotherapy, high-throughput
Graphical Abstract

Patient responses to immune checkpoint inhibitor (ICI)-based therapies are highly variable, calling for a rapid evaluation approach. Here, a cancer-on-a-chip platform is designed to monitor ICI-associated cancer-immune interactions between cancer spheroids and T cells in a high-throughput manner. The system is a promising screening platform for drug discovery, drug safety assessment, and personalized medicine.
1. Introduction
Immunotherapies have revolutionized cancer treatment with improved efficacy and reduced systemic toxicity when compared against traditional chemotherapeutics. These agents activate and enhance the patient’s immune system to fight malignant cells.[1] Immune checkpoint inhibitors (ICIs) are one class of promising immunotherapies. The discovery of immunological checkpoint proteins, such as cytotoxic T lymphocyte-associated antigen 4 (CTLA-4), programmed cell death-1 (PD-1), and PD-1 ligand 1 (PD-L1), has led to the development of drugs based on monoclonal antibodies (mAbs) to inhibit their activation.[2] Since the US Food and Drug Administration (FDA) approved an anti-CTLA-4 antibody, ipilimumab, for the treatment of metastatic melanoma in 2011, additional immunological checkpoint inhibitors, nivolumab, pembrolizumab, cemiplimab, atezolizumab, durvalumab, and avelumab, targeting the PD-1/PD-L1 interaction have been approved for the treatment of a variety of malignancies.[3] More clinical trials are under investigation and the use of ICIs is growing.[4] Despite the progress made thus far, a major challenge to broader clinical use of ICIs is the limited number of patients showing positive antitumor response.[5] Although several predictive biomarkers (PD-L1 expression, mutations and neoantigens, status of immune cells, gene and epigenetic signatures) show some correlation with clinical benefit, there are currently no effective methods for identifying patients likely to respond to therapy.[6] Microphysiological systems that recreate functional units of human tissues have the potential to perform accurate, sensitive, and cost-effective drug screening.[7] However, unlike most chemotherapies, immunotherapies have an indirect mechanism of action against cancer and require immune-competent tissue models. A system to evaluate immunotherapies for cancer must include: (1) high-throughput, easy-to-use devices, (2) reliable recreation of physiologically relevant, immune-competent models, and (3) rapid data collection with standardized analytical methods.
Here, we have developed an immunotherapeutic high-throughput observation chamber (iHOC) to house immune-competent cancer models for assaying ICIs (Figure. 1). An array of conical microwells was prepared by three-dimensional (3D) printing to create discrete spheroids of breast cancer cells (MDA-MB-231). Immune cells (Jurkat T cells) were co-cultured with the tumor spheroids to model the tumor-immune interactions (Figure. 1). A complementary micropillar array was fabrication by photolithography for sampling secreted biomarkers from the microwells. By coating the micropillars with capture antibodies towards interleukin-2 (IL-2), inhibition of the T cells by tumor spheroid and re-activation of T cells by ICIs can be monitored. Furthermore, non-invasive imaging can be performed on iHOC for observing the tumor-infiltration behavior of immune cells.
Figure 1.

Schematic illustration of the immunotherapeutic high-throughput observer chamber (iHOC). The iHOC consists of microwell cell cultures and complimentary micropillar arrays for cytokine monitoring. The interactions among tumor spheroids, immune cells, and ICIs can be directly observed in the mini-bioreactor arrays. I. Micropillars were fabricated using photolithography to generate the mold for subsequent casting of PDMS. II. IL-2 capture antibodies were covalently modified to the surface of micropillars. III. Microwell arrays were fabricated by 3D printing the master mold and casting PDMS. IV. MDA-MB-231 human breast cancer cells were seeded in the microwell arrays to generate tumor spheroids followed by co-culturing with T cells.
2. Results and discussion
2.1. Fabrication and characterization of iHOC
The developed iHOC is composed of a complementary set of microwell and micropillar arrays used for cell culture and biomarker detection, respectively. The unique conical shape of the microwells provides a geometrical niche that encourages 3D tumor spheroid formation, while the corresponding micropillar array facilitates the quantification of soluble biomarker concentration through antibody-based interactions (Figure 1). 3D printing was used to create the master mold of the microwell array and photolithography was used to make the micropillar array. The conical geometry of the master mold for the microwell arrays was achieved by using a commercial stereolithography 3D printer. One of the advantages of 3D printing is that the shapes can be customized.[8] The cone shape is important to facilitate the formation of 3D tumor spheroids. The 3D printed molds have sufficient resolution to meet our need to generate tumor spheroids, and the slight inhomogeneity does not affect the consistency of our study. Polydimethylsiloxane (PDMS) was selected due to its biocompatibility and photo-transparency and cast over the 3D-printed master mold. The PDMS device was peeled off from the master mold to obtain the microwell arrays. Each microwell was composed of a 300 µm-high inverted cone on top of a 600 µm-high, 600 µm diameter cylinder (Figure 2A–D). The sloped bottom of each chamber provided a geometric support for the development of the tumor spheroids. The extra 600 µm depth maintained the spheroids in a physically stable environment during physical handling. The mold for the cylindrical micropillars was created using photolithography with SU-8 2150. PDMS was cast and cured over the SU-8 master mold. As shown in Figure 2E and F, scanning electron microscope (SEM) imaging showed the cylindrical micropillar was 200 µm in diameter and 400 µm in height with a smooth and flat face that can be used for antibody coating. For each micropillar chip, there are four posts on the corners to hold the micropillar (150 µm high) so that it can sample supernatant with negligible stress on the cocultured cells (Figure S1, Supporting Information). By aligning the inverted micropillar array with the wells, each micropillar assayed the contents of a single, unique microwell.
Figure 2.

Characterization of iHOC and 3D tumor spheroids. A) Photograph of iHOC (Scale Bar = 3 mm). B, C) SEM images of PDMS microwell arrays (Scale Bar = 100 μm). D) Side view of microwells and complementary micropillars (Scale Bar = 200 μm). E, F) SEM images of PDMS micropillar arrays. (Scale Bar = 100 μm). G) SEM images of 3D MDA-MB-231 tumor spheroids in iHOC (Scale Bar = 100 μm). H) Schematic for generating 3D MDA-MB-231 tumor spheroids with gradient sizes in iHOC. S1-S6 represent tumor spheroids with initial MDA-MB-231 cell densities ranging from 0.5 × 10⁶ cells mL−1 to 5.0 × 10⁶ cells mL−1. I) LIVE/DEAD assay of 3D MDA-MB-231 tumor spheroids after culturing for 48 h (Scale Bar = 100 μm).
2.2. Generation of 3D breast tumor spheroids in iHOC
The iHOC device offers a way of generating spheroids that recreate the cell-cell interactions found in vivo.[9] In this study, MDA-MB-231 breast cancer cells were chosen as a model tumor cell line due to their elevated expression of PD-L1.[10] We verified PD-L1 expression on the surface of the cells with fluorescence microscopy and flow cytometry (Figure S2, Supporting Information). To load the device, a cell suspension was pipetted onto the sterile iHOC and centrifuged for 5 min at 1500 rpm. Residual cells that had settled outside of the wells were removed from the surface. After 48 h of incubation, microwells were observed via SEM to confirm the formation of tumor spheroids (Figure 2G). To control the diameter of tumor spheroids, six different initial seeding densities (0.5 × 10⁶, 1.0 × 10⁶, 2.0 × 10⁶, 3.0 × 10⁶, 4.0 × 10⁶ and 5.0 × 10⁶ cells mL−1) were employed (Figure 2H). After 48 h of culture, a LIVE/DEAD Viability/Cytotoxicity kit was used to evaluate cell viability and observe the tumor spheroids. As shown in Figure 2I, six tumor spheroids of different diameters named the groups S1-S6 were observed using fluorescence microscope. The strong green calcein AM signal (live cells) and limited red ethidium homodimer signal (dead cells) revealed good viability of the tumor spheroids regardless of size. We further used lactate dehydrogenase (LDH) assay to verify the status of tumor spheroids cultured in microwell arrays after 48 h of culture. Cells release LDH after damage, and it has been widely used to evaluate the presence of damage and toxicity of tissue and cells.[11] LDH releases in S1-S6 groups were compared with those from parallel 2D cultures. The result showed that all the spheroids grew well in each group (Figure S3, Supporting Information). This is consistent with the results of Live/Dead staining in Figure 2I. These preliminary characterizations indicated that the microwells provide a suitable environment for spheroid formation and growth.
2.3. Activation of GFP-Jurkat T cells
To evaluate the immunotherapeutic effect of the ICI, activated green fluorescent protein (GFP)-transfected Jurkat T cells were used as a model T cell line.[12] GFP-Jurkat T cells were pre-stimulated with Phorbol 12-myristate 13-acetate (PMA) and ionomycin to mimic activation by TCR signaling and co-stimulation.[13] PMA possesses structural similarity to diacylglycerol (DAG) and can therefore activate the PKCθ and NF-κB pathways in T cells. Ionomycin induces Ca2+ influx from intracellular Ca2+ storage compartments to activate the NFAT pathway (Figure S4A, Supporting Information).[14] After incubation in stimulation media for 0 – 72 h, flow cytometry and confocal fluorescence microscopy were used to observe cell activation indicated by the expression level of CD69 on the GFP-Jurkat T cell surface. 41.8% of the cells showed significant CD69 presentation after 12 h of incubation (Figure S4B, Supporting Information). In addition, few inactivated GFP-Jurkat T cells expressed PD-1, while increasing incubation time in the activation media increased PD-1 expression to 61.2%, 75.0%, and 81.8% after 24 h, 48 h, and 72 h, respectively (Figure S4C, Supporting Information). These results were also supported by observations with confocal fluorescence microscopy (Figure S5, Supporting Information). In subsequent experiments, GFP-Jurkat T cells were preactivated with 80 nM PMA and 1 µM ionomycin mixture for 48 h before use.
2.4. Evaluation of anti-PD-1 in reversing cell death of GFP-Jurkat T cells
The efficacy of anti-PD-1 mAb in reversing cell death of GFP-Jurkat T cells was performed in the iHOC (Figure 3; Figure S6, Supporting Information). Transfected GFP has been widely used as a rapid reporter for the viability of Jurkat T cells.[15] Previous studies have reported that GFP-transfected cells do not fluoresce after apoptosis[16] and the interactions between PD-1 and PD-L1 can cause apoptosis of T cells;[17] therefore, fluorescence intensity can be used for assessing GFP-Jurkat T survival. Due to the expression of PD-L1 by the MDA-MB-231 cells, it was hypothesized that co-culture of the cancer cells with pre-stimulated Jurkat T cells would lead to inactivation of the T cells through PD-L1/PD-1 interactions. To evaluate the efficacy of anti-PD-1 antibody in inhibiting PD-L1/PD-1 interactions, 5 × 10⁶ cells mL−1 of activated GFP-Jurkat T cells were seeded onto the iHOC loaded with various sizes of MDA-MB-231 spheroids. In one group of Jurkat T cells, the media was supplemented with 10 μg mL−1 anti-PD-1 antibody. The fluorescence intensity of GFP was observed after 48 h of co-culture. In samples without the treatment of anti-PD-1 antibody, a spheroid size-dependent trend was observed in which large tumor spheroids limited Jurkat T cell viability. However, in samples treated with the mAb, the overall fluorescence intensity increased, while the size-dependent trends remained. These results suggest that PD-L1 expressed by MDA-MB-231 cells inhibited GFP-Jurkat T cell proliferation by activating the PD-1-dependent immune checkpoint pathway. Furthermore, administration of anti-PD-1 antibody reversed the inhibition. The tumor-size dependent decrease in GFP fluorescence may be attributed to the greater number of PD-L1 molecules presented by larger spheroids.
Figure 3.
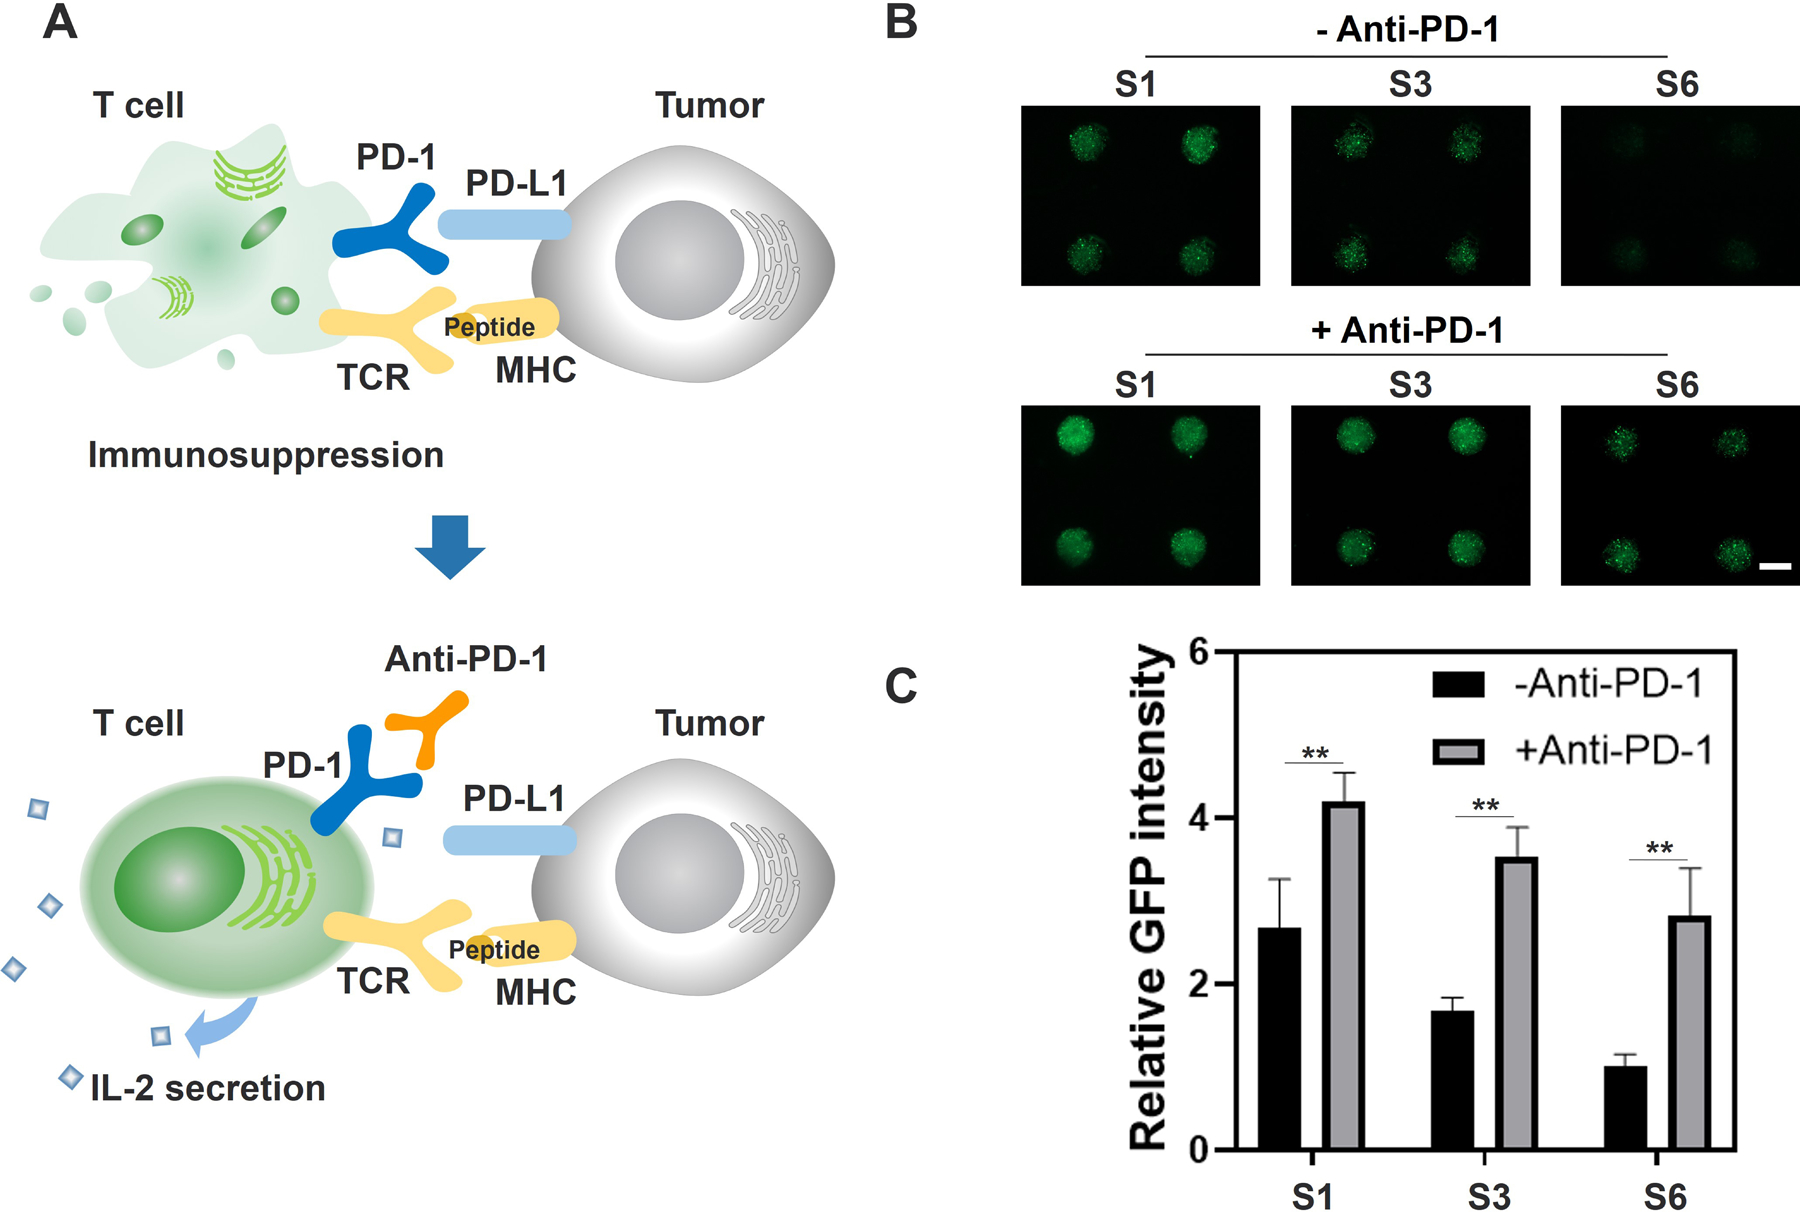
Inhibition of GFP-Jurkat T cells by MDA-MB-231 spheroids and activation with anti-PD-1. A) Mechanism of anti-PD-1 antibody in the interaction of T cells and tumor cells. Contact between PD-1 expressed on the surface of activated T cells and PD-L1 expressed on the surface of tumor cells can induce inhibition and death of activated T cells. The use of anti-PD-1 can reverse immunosuppression caused by the PD-1 / PD-L1 interaction, thus improving IL-2 secretion. B) Representative fluorescence micrographs of activated GFP-Jurkat T cells co-cultured with MDA-MB-231 spheroids with or without anti-PD-1 mAb for 48 h in group S1, S3 and S6. S1, S3 and S6 represent tumor spheroids with initial MDA-MB-231 cell densities of 0.5 × 10⁶, 2.0 × 10⁶, 5.0 × 10⁶ cells mL−1 and initial GFP-Jurkat T cell density was 5 × 10⁶ cells mL−1 (Scale Bar = 500 μm). C) Comparison of relative GFP fluorescence intensity of GFP-Jurkat T cells co-cultured with MDA-MB-231 spheroids with or without anti-PD-1 mAb for 48 h in group S1, S3, S6 (Data represent mean ± SD. n = 4. ** P< 0.01).
2.5. Effects of anti-PD-1 on IL-2 secretion by GFP-Jurkat T cells
We further assessed the therapeutic efficacy of anti-PD-1 mAb by observing IL-2 secretion by GFP-Jurkat T cells. IL-2 is a well-known biomarker of activated T cells in vivo, which is responsible for the amplification of immune responses through immune cell recruitment and stimulation.[18] To detect the secreted level of IL-2 in our in vitro system, we adapted micropillars to assay soluble molecules in each microwell. IL-2 capture antibodies were tethered onto the surface of the micropillars by treating the PDMS surface with oxygen plasma followed by (3-Aminopropyl) triethoxysilane (APTES) and glutaraldehyde solution to generate aldehyde groups. After incubation with the IL-2 capture antibody, the micropillar arrays were used to detect IL-2 in the microwells (Figure S7A, Supporting Information). Similar to the previous experiment, a 5 × 10⁶ cells mL−1 suspension of pre-activated GFP-Jurkat T cells with and without anti-PD-1 antibodies were added onto the microwell arrays (Figure 4A).
Figure 4.

Evaluation of the effects of anti-PD-1 mAb on IL-2 secretion by GFP-Jurkat T cells. A) Schematic of IL-2 detection by iHOC. Capture antibody was modified onto micropillar arrays for IL-2 capture. A Cy5 conjugated detection antibody was used for fluorescence-based quantification of IL-2. Sample groups with or without anti-PD-1 mAb were tested at different time points. The micropillars were placed in the microwells for 1 h at each time point. B) Representative fluorescence images of IL-2 detected by micropillar arrays in group S1, S3 and S6. S1, S3 and S6 represent tumor spheroids with initial MDA-MB-231 cell densities of 0.5 × 10⁶, 2.0 × 10⁶, 5.0 × 10⁶ cells mL−1 (Scale Bar = 1.5 mm). C) Comparison of relative IL-2 secretion detected by iHOC and ELISA for 24 h in group S1, S3, S6. Ab in figure is an abbreviation for the anti-PD-1 mAb. The values were normalized to the initial data point at 2 h. Data represent mean ± SD. n = 36 for iHOC groups, n = 3 for ELISA groups. *P< 0.05 and **P< 0.01.
At 2 h, 6 h, 12 h, and 24 h, IL-2 production was evaluated by the antibody-coated micropillar array. ELISA was used in parallel to evaluate the fidelity of our detection system. After placing the micropillars in the microwells for 60 min, the posts were sequentially incubated in biotinylated detection antibodies and Streptavidin-Cy5. The micropillar array in each group was imaged using a high-throughput fluorescence microscope. To demonstrate that there was no other component in the system to cause false-positive signal, we further used the coated micropillars to detect the Jurkat T-cell-free group directly. No obvious fluorescence was observed, while the group with Jurkat T cells showed strong fluorescence. (Figure S7B, Supporting Information). It was observed that larger tumor spheroids lowered the production of IL-2 in both treated and untreated samples (Figure 4B). This relationship was especially prominent at 12 h and 24 h. When comparing spheroids of the same size, IL-2 production levels were significantly increased by the addition of the anti-PD-1 antibody, indicating that the antibody prevented the deactivation of T cells (Figure 4B, C; Figure S7C, D, Supporting Information). In order to validate micropillar-based detection, all supernatant from the parallel microwell plates was collected by centrifugation for ELISA assay. The trends elucidated by the micropillar array were consistent with parallel ELISA analysis indicating the micropillar system can reliably monitor the cellular microenvironment (Figure 4C; Figure S7D, Supporting Information).
Although PDMS can nonspecifically absorb hydrophobic small molecules, it has negligible absorption for hydrophilic molecules or biomacromolecules.[19] The drug or biomarker in this study are biomacromolecules, which limited the concern for non-specific interactions with PDMS.
Additionally, the results showed that the micropillars’ detection towards IL-2 has not yet reached the upper limit in our system. However, when there is a higher density of T cells in the microwells or the experiment lasts longer for future use, the detection signal can reach a plateau. In that case, we may need to modify micropillar with a higher density of anti-IL-2.
2.6. Effects of anti-PD-1 on GFP-Jurkat T cells infiltration into tumor spheroids
T cell infiltration into solid tumors is one parameter used for evaluating a patient’s response to immunotherapy in the clinical setting as one goal of immunotherapies is to improve the survival and activity of infiltrating immune cells.[20] Non-invasive imaging in our system facilitates the evaluation of T cell infiltration. The transparent PDMS-based iHOC allows direct observation of cell migration within the spheroid. MDA-MB-231 cells labeled with CellTracker™ CM-Dil Dye were seeded at 5.0 × 10⁶ cells mL−1 in the iHOC. Pre-activated GFP-Jurkat T cells were added to the tumor spheroids both with and without 10 μg mL−1 of anti-PD-1 antibody. After coculture for 24 h, non-infiltrating T cells were gently washed away, and only T cells infiltrating into the tumor spheroids were observed in situ by confocal fluorescence microscopy. As shown in Figure 5, treatment with the anti-PD-1 antibody notably increased the number of infiltrating Jurkat T cells with deeper penetrating distance towards the center of spheroids. This indicates that the ICI improves T cell infiltration or survival in the model tumor microenvironment.[21] Additionally, this study shows the feasibility of using the iHOC to characterize T cell infiltration enhancing efficacy of ICIs.
Figure 5.

A) Schematic of T cells infiltration assay with or without anti-PD-1. B) The effect of anti-PD-1 on Jurkat T cell infiltration into MDA-MB-231 tumor spheroids were observed by confocal fluorescence microscopy at 2 h, 12h and 24 h. The cross-section view of the tumor spheroids was shown. Tumor spheroids were stained by CellTracker™ CM-Dil Dye (Red). GFP-Jurkat T cells (Green) were incubated with tumor spheroids for 2 h, 12h, and 24 h. Non-infiltrating T cells outside tumor spheroids were gently washed away. C&D) Quantitative analysis of GFP-Jurkat T cells infiltration into MDA-MB-231 tumor spheroids with or without anti-PD-1 at 2 h, 12 h and 24h. Percentage (%) = (GFP fluorescence area within certain region / Total cross-sectional area) × 100 % (n = 3) (The total cross-sectional area is divided and analyzed as 40 μm rings, specifically 0–40 μm, 40–80 μm, 80–120 μm, 120–160 μm, 160–200 μm, 200–240 μm, 240–280 μm from edge to center). Data represent mean ± SD. n = 3 for each group. (**P< 0.01)
3. Conclusions
In summary, we have fabricated an iHOC device composed of complementary microwell and micropillar arrays to evaluate the efficacy of a cancer immunotherapy. Several features of a tumor microenvironment relevant to the evaluation of immunotherapeutics have been successfully recapitulated: 1. Exposure to cancer cells can inhibit the activity of immune cells. 2. Addition of checkpoint inhibitors can reactivate immune cells. 3. Activated immune cells secrete more cytokines. 4. Activated immune cells can efficiently penetrate tumors. Our combinatorial culture-detection system allows the facile recreation of physiologically relevant model systems and rapid data output. Each conical well functions as an independent micronized bioreactor for functional observation of interactions amongst tumor spheroids, T cells, and therapeutics. The optical transparency of the device allows in situ observation of T cell infiltration with fluorescence and confocal microscopy. PDMS micropillars with capture antibody coatings are an effective tool for the detection of secreted cytokine in a high-throughput way. Additionally, the micropillar assay yielded results comparable to the current golden standard, ELISA. Furthermore, the system can be tailored for personalized medicine approaches by harvesting samples from patients and performing functional assays to better inform clinical decisions. For instance, Jurkat T cells can only mimic the behaviors of CD4+ T cells, including cytokine secretion and tumor penetration.[22] In our future studies, we can use patient-derived T cells, including CD8+ T cells, to mimic the tumor-killing effect. With advantages such as facile handling, reliable biomarker detection, and convenient observation, we conclude that our developed iHOC system is a valuable immunotherapy screening platform that may benefit drug discovery, prediction of patient response, and evaluation of safety.
4. Experimental Section
Materials:
Cell culture media and reagents were obtained from Gibco (NY, USA). MDA-MB-231 cells were purchased from ATCC (VA, USA). The GFP-Jurkat cell line was a gift from Dr. Gwack’s lab at UCLA. The phorbol 12-myristate 13-acetate (PMA), ionomycin, glutaraldehyde solutions and (3-Aminopropyl) triethoxysilane were purchased from Sigma-Aldrich (St. Louis, MO, USA). Anti-human PD-1 (CD279) was purchased from Bio X cell (West Lebanon, NH, USA). PE-labeled CD69 Monoclonal Antibodies (FN50), APC-labeled CD279 (PD-1) Monoclonal Antibodies (MIH4), APC-labeled CD274 (PD-L1, B7-H1) Monoclonal Antibodies (MIH1), Streptavidin-Cy5 and the IL-2 ELISA kit were purchased from Thermo Fisher (Waltham, MA, USA).
Fabrication of the iHOC:
The iHOC cell culture system is composed of an array of 288 conical-shaped wells (600 µm diameter, 900 µm total depth) with a 300 µm cone on the bottom. The conical shape was used to facilitate spheroid formation within the well. This component was fabricated by casting PDMS over a 3D-printed master mold. The master mold was designed in Inventor (Autodesk) and exported as an STL file to PreForm (Formlabs, Boston, MA, USA) for slicing and printing. The mold was printed using Clear Resin (Formlabs) with a layer thickness of 50 µm. After printing, the mold was washed with isopropanol and further cured under 405 nm light for 20 min. The PDMS was made by combining the pre-polymer and curing agent (Sylgard 184, Dow Corning Co., Midland, MI, USA) at a 10:1 (w/w) ratio. The polymer was poured over the mold and degassed in a desiccator for 30 min before curing in an 80 °C oven for 60 min. The solid PDMS was peeled from the mold to yield the microwell array. A complementary array of cylindrical posts (200 µm diameter, 400 µm height) was fabricated using traditional photolithography methods to be used for cytokine detection. Briefly, a photomask was designed in AutoCAD and purchased from Fineline Imaging (Colorado Springs, CO, USA). A 400 µm layer of SU-8 2150 (Microchem, Newton, MA, USA) was spin-coated onto a 4” silicon wafer and soft-baked for 8 min and 20 s at 95 °C before exposure to 350 nm light and post-exposure baking for 25 min at 95 °C. The wafer was developed in SU-8 Developer (Microchem) until all uncured SU-8 was removed from the wafer (monitored by inspection under a microscope). The mold was rinsed with acetone and isopropanol prior to silanization with (tridecafluoro-1, 1, 2, 2-tetrahydrooctyl) trichlorosilane (Gelest, Morrisville, PA, USA). Following salinization, the same PDMS casting processed outlined above was used to create micropillar arrays.
Detection of PD-L1 expression by MDA-MB-231 cells:
MDA-MB-231 cells were harvested from treated polystyrene tissue culture flasks and resuspended to a density of 10000 cells mL−1. Cells were subsequently stained with APC-labeled CD274 (PD-L1, B7-H1) Monoclonal Antibody (MIH1) or APC-labeled Mouse IgG1 kappa Isotype Control (P3.6.2.8.1). Antibodies were diluted 1:20 and staining was performed in phosphate-buffered saline (PBS) for 1 h on ice. The expression of PD-L1 on the surface of cells was analyzed by the BD FACS flow cytometry system (BD Biosciences) and FlowJo software.
Breast cancer spheroids:
Immortalized human breast cancer cells (MDA-MB-231) were cultured in Dulbecco’s modified Eagle’s medium (DMEM; Gibco) containing 10 % Fetal Bovine Serum (FBS; Gibco) supplemented with 1 % Penicillin-Streptomycin (Gibco) under standard culture conditions with 5% CO2 in a 37 °C humidified incubator. MDA-MB-231 cells were harvested from cell culture flasks using trypsin and resuspended in fresh culture medium to concentrations of 0.5 × 10⁶, 1.0 × 10⁶, 2.0 × 10⁶, 3.0 × 10⁶, 4.0 × 10⁶ and 5.0 × 10⁶ cells mL−1. The microwell arrays were sterilized by UV irradiation for 20 min before use. After the solutions were pipette over the arrays and centrifuged for 5 min at 1500 rpm, residual cells were removed from the surface of the iHOC by scraping the surface. After incubation for 48 h, the generated tumor spheroids were stained by LIVE/DEAD Viability/Cytotoxity kit (Thermo Fisher) and observed with an inverted fluorescent microscope (Zeiss Axio Observer, Zeiss).
Live/Dead Viability/Cytotoxicity staining of tumor spheroids:
According to the vendor’s protocol, a 4 µL calcein AM and 20 µL Ethidium homodimer-1 in 10 mL of PBS was made as the working solution. The working solution was then pipette onto the microwell arrays and incubated for 30 min at 37 °C; the solution was removed by washing twice with PBS.
Lactate dehydrogenase (LDH) assay:
LDH assay was used to verify the status of tumor spheroids cultured in microwell arrays. MDA-MB-231 cells were harvested from cell culture flasks using trypsin and resuspended in fresh culture medium to obtain concentrations of 0.5×10⁶, 1.0×10⁶, 2.0×10⁶, 3.0×10⁶, 4.0×10⁶ and 5.0×10⁶ cells mL−1. After the solutions were pipette over the arrays and centrifuged for 5 min at 1500 rpm, residual cells were removed from the surface of the iHOC by scraping the surface. Parallel microwell arrays with the same amount of cells were prepared in the same way, but the cells were transferred into 96-well plates for 2D cell culture. After 48 h, an LDH assay kit was used to compare the LDH release in each group. Total LDH (max) was released from the cells by lysis following the manufacturer’s instructions. LDH release ratio in S1-S6 groups = [(absorbance of S1-S6 groups - absorbance of correspondent control groups) / (absorbance of max LDH release in each group - absorbance of correspondent control groups)] × 100%.
Jurkat T cell culture:
GFP-transfected Jurkat T cells were cultured in RPMI 1640 medium (Gibco) containing 10 % FBS (Gibco) supplemented with 1 % Penicillin-Streptomycin (Gibco) and were maintained in 5% CO2 at 37 °C.
Activation of GFP-Jurkat T cells:
GFP-Jurkat T cells were harvested and resuspended in cell culture medium. The cell suspension was maintained at 1 × 10⁶ cells mL−1. To activate the cells, PMA and ionomycin vials were thawed in a 37 °C water bath. 2 µL (per mL of media) of the PMA/ionomycin mixture (80 nM PMA and 1 µM ionomycin) was added directly to the cell suspension. The GFP-Jurkat T cells were incubated at 37 °C in 5% CO2 for 0 – 72 h. Activated cells were harvested by centrifugation at 900 rpm for 5 min.
Detection of CD69 and PD-1 expression by activated GFP-Jurkat T cells:
After the cells were cultured in media supplemented with PMA and ionomycin for 0 – 72 h, the GFP-Jurkat T cells were washed twice and resuspended in PBS to a density of 1 × 10⁶ cells mL−1. PE-labeled CD69 Monoclonal Antibody (FN50) and APC-labeled CD279 (PD-1) Monoclonal Antibody (MIH4) were diluted 1:20 and added into the suspension. The cell suspension was incubated on ice for 1 h prior to analysis by BD FACS flow cytometry system (BD Biosciences) and FlowJo software. Expression of the markers was also confirmed by confocal microscopy (SP8, Leica).
Jurkat T-cancer cell culture with anti-PD-1:
After a size gradient of MDA-MB-231 breast cancer spheroids were formed in the microwell arrays (described above), pre-activated GFP-Jurkat T cells with or without 10 μg mL−1 anti-PD-1 antibody were added on top of the array using a pipette. After 30 min for cells to settle, residual GFP-Jurkat T cells were removed from the surface of the device by scraping. MDA-MB-231 tumor spheroids were co-cultured with activated GFP-Jurkat T cells for 48 h and the GFP fluorescence of the Jurkat T cells in each microwell was observed by inverted fluorescence microscope (Zeiss Axio Observer, Zeiss).
IL-2 detection using ELISA:
MDA-MB-231 cells were seeded in the microwell to generate tumor spheroids. A 5 × 10⁶ cells mL−1 solution of pre-activated GFP-Jurkat T cells with or without anti-PD-1 antibody was added to the tumor spheroids. After 2 h, 6 h, 12 h, and 24 h, the supernatant was collected from the microwells by centrifugation. The experimental procedure provided in the vendor’s protocol was used. Briefly, ELISA plates were pre-coated with the capture antibody by adding 100 μL of capture antibody solution diluted in coating buffer overnight at 4 °C. After aspirating the contents of each well and rinsing with wash buffer 3 times, wells were blocked with 200 μL of ELISA/Elispot Diluent at room temperature (RT) for 1 h. The diluent was aspirated, and wells were washed twice with wash buffer. Both standard curve samples and experimental samples were loaded into pre-coated wells and incubated for 2 h at RT. Wells were rinsed with wash buffer and incubated with 100 μL/well of detection antibodies for 1 h at RT. Once again, all wells were aspirated and rinsed 3 times with PBS. 100 μL of Avidin-HRP was loaded into each well for 30 min at RT. The washing steps were repeated prior to the addition of 100 μL of tetramethylbenzidine (TMB) solution to each well for 15 min at RT. Finally, 100 μL per well of stop solution was added and the plates were read by a plate reader (BIOTEK Fluorescent plate reader, Synergy HTX multimode reader) at a wavelength of 450 nm.
IL-2 detection using the micropillar arrays:
Methanol was used to clean the PDMS micropillar arrays prior to oxygen plasma treatment to generate hydroxyl groups. Afterwards, micropillar arrays were treated with APTES and glutaraldehyde solutions in order to chemically modify the PDMS surface. IL-2 capture antibody was covalently bound to the modified surface of the micropillars. After interaction with the samples, the pillars were incubated in biotinylated detection antibodies and Streptavidin-Cy5 to label IL-2 bound to the surface of the micropillars.
T cell infiltration assay:
A 5 × 10⁶ cells mL−1 suspension of MDA-MB-231 breast cancer cells was seeded into the microwell to form tumor spheroids as described above. CellTracker™ CM-Dil was used to stain cancer cell membranes to better differentiate cell populations. Pre-activated GFP-Jurkat T cells with or without anti-PD-1 antibodies were added to the tumor spheroids. After 24 h of incubation, PBS was used to gently remove non-infiltrating GFP-Jurkat T cells from the surface of the MDA-MB-231 tumor spheroids, leaving infiltrating GFP-Jurkat T cells inside the tumor spheroids for analysis with a confocal microscope (SP8, Leica).
Statistical Analysis:
T-test and analysis of variance (ANOVA) was performed to test for statistical significance. *P< 0.05 and **P< 0.01 were considered to be statistically significant.
Supplementary Material
Acknowledgements
X. J., L. R., P. T. and C. W contributed equally to this work. This work has been supported by the National Institutes of Health (CA214411).
Footnotes
Supporting Information
Supporting Information is available from the Wiley Online Library or from the author.
Contributor Information
Xing Jiang, Department of Bioengineering, Center for Minimally Invasive Therapeutics, California Nanosystems Institute, University of California, Los Angeles, Los Angeles, CA 90095, USA; School of Nursing, Nanjing University of Chinese Medicine, Nanjing 210023, China.
Li Ren, Department of Bioengineering, Center for Minimally Invasive Therapeutics, California Nanosystems Institute, University of California, Los Angeles, Los Angeles, CA 90095, USA; Key Laboratory for Space Bioscience and Biotechnology, School of Life Science, Northwestern Polytechnical University, Xi’an, Shaanxi 710072, China.
Peyton Tebon, Department of Bioengineering, Center for Minimally Invasive Therapeutics, California Nanosystems Institute, University of California, Los Angeles, Los Angeles, CA 90095, USA.
Canran Wang, Department of Bioengineering, Center for Minimally Invasive Therapeutics, California Nanosystems Institute, University of California, Los Angeles, Los Angeles, CA 90095, USA; Department of Biochemistry and Molecular Cell Biology, Shanghai Key Laboratory for Tumor Microenvironment and Inflammation, Shanghai Jiao Tong University School of Medicine, Shanghai 200025, China.
Xingwu Zhou, Department of Bioengineering, Center for Minimally Invasive Therapeutics, California Nanosystems Institute, University of California, Los Angeles, Los Angeles, CA 90095, USA.
Moyuan Qu, Department of Bioengineering, Center for Minimally Invasive Therapeutics, California Nanosystems Institute, University of California, Los Angeles, Los Angeles, CA 90095, USA; The Affiliated Hospital of Stomatology, School of Stomatology, Zhejiang University School of Medicine, and Key Laboratory of Oral Biomedical Research of Zhejiang Province, Hangzhou, Zhejiang,310006, China.
Jixiang Zhu, Department of Bioengineering, Center for Minimally Invasive Therapeutics, California Nanosystems Institute, University of California, Los Angeles, Los Angeles, CA 90095, USA; Department of Biomedical Engineering, School of Basic Medical Sciences, Guangzhou Medical University, Guangzhou 511436, China.
Haonan Ling, Department of Bioengineering, Center for Minimally Invasive Therapeutics, California Nanosystems Institute, University of California, Los Angeles, Los Angeles, CA 90095, USA; Department of Mechanical and Aerospace Engineering, University of California, Los Angeles, Los Angeles, CA90095, USA.
Shiming Zhang, Department of Bioengineering, Center for Minimally Invasive Therapeutics, California Nanosystems Institute, University of California, Los Angeles, Los Angeles, CA 90095, USA.
Yumeng Xue, Department of Bioengineering, Center for Minimally Invasive Therapeutics, California Nanosystems Institute, University of California, Los Angeles, Los Angeles, CA 90095, USA; Frontier Institute of Science and Technology, Xi’an Jiaotong University, Xi’an 710000, China.
Qingzhi Wu, Department of Bioengineering, Center for Minimally Invasive Therapeutics, California Nanosystems Institute, University of California, Los Angeles, Los Angeles, CA 90095, USA; State Key Laboratory of Advanced Technology for Materials Synthesis and Processing, Wuhan University of Technology, Wuhan 430070, China.
Praveen Bandaru, Department of Bioengineering, Center for Minimally Invasive Therapeutics, California Nanosystems Institute, University of California, Los Angeles, Los Angeles, CA 90095, USA.
Junmin Lee, Department of Bioengineering, Center for Minimally Invasive Therapeutics, California Nanosystems Institute, University of California, Los Angeles, Los Angeles, CA 90095, USA.
Han-Jun Kim, Department of Bioengineering, Center for Minimally Invasive Therapeutics, California Nanosystems Institute, University of California, Los Angeles, Los Angeles, CA 90095, USA.
Samad Ahadian, Department of Bioengineering, Center for Minimally Invasive Therapeutics, California Nanosystems Institute, University of California, Los Angeles, Los Angeles, CA 90095, USA.
Nureddin Ashammakhi, Department of Bioengineering, Center for Minimally Invasive Therapeutics, California Nanosystems Institute, University of California, Los Angeles, Los Angeles, CA 90095, USA.
Mehmet R. Dokmeci, Department of Bioengineering, Center for Minimally Invasive Therapeutics, California Nanosystems Institute, University of California, Los Angeles, Los Angeles, CA 90095, USA
Jinhui Wu, State Key Laboratory of Pharmaceutical Biotechnology, Medical School of Nanjing University & School of Life Sciences, Nanjing University, Nanjing 210093, China.
Zhen Gu, Department of Bioengineering, Center for Minimally Invasive Therapeutics, California Nanosystems Institute, University of California, Los Angeles, Los Angeles, CA 90095, USA.
Wujin Sun, Department of Bioengineering, Center for Minimally Invasive Therapeutics, California Nanosystems Institute, University of California, Los Angeles, Los Angeles, CA 90095, USA; Terasaki Institute for Biomedical Innovation, Los Angeles, CA 90064, USA.
Ali Khademhosseini, Department of Bioengineering, Center for Minimally Invasive Therapeutics, California Nanosystems Institute, University of California, Los Angeles, Los Angeles, CA 90095, USA; Terasaki Institute for Biomedical Innovation, Los Angeles, CA 90064, USA.
References
- 1.Ribas A and Wolchok JD, Science 2018, 359, 1350–1355. [DOI] [PMC free article] [PubMed] [Google Scholar]
- 2.a) Wang C, Sun W, Wright G, Wang AZ and Gu Z, Adv. Mater 2017, 29; [DOI] [PubMed] [Google Scholar]; b) Sharpe AH, Immunol. Rev 2017, 276, 5–8. [DOI] [PMC free article] [PubMed] [Google Scholar]
- 3.Lee HT, Lee SH and Heo YS, Molecules, 2019, 24, 1190. [DOI] [PMC free article] [PubMed] [Google Scholar]
- 4.a) Wilson RAM, Evans TRJ, Fraser AR and Nibbs RJB, Clin. Exp. Immunol 2018, 191, 133–148; [DOI] [PMC free article] [PubMed] [Google Scholar]; b) Fan Y, Zhang C, Jin S, Gao Z, Cao J, Wang A, Li D, Wang Q, Sun X and Bai D, Oncol. Rep 2019, 41, 3–14. [DOI] [PubMed] [Google Scholar]
- 5.a) Wen D, Chen G, Chen Q, Li PY, Cheng H and Gu Z, Bioconjugate Chem 2019, 30, 515–524; [DOI] [PubMed] [Google Scholar]; b) Jenkins RW, Barbie DA and Flaherty KT, Br. J. Cancer 2018, 118, 9–16. [DOI] [PMC free article] [PubMed] [Google Scholar]
- 6.a) Trujillo JA, Sweis RF, Bao R and Luke JJ, Cancer Immunol Res, 2018, 6, 990–1000; [DOI] [PMC free article] [PubMed] [Google Scholar]; b) Darvin P, Toor SM, Sasidharan Nair V and Elkord E, Exp. Mol. Med 2018, 50, 1–11; [DOI] [PMC free article] [PubMed] [Google Scholar]; c) Gibney GT, Weiner LM and Atkins MB, Lancet Oncol 2016, 17, e542–e551. [DOI] [PMC free article] [PubMed] [Google Scholar]
- 7.a) Marx U; Akabane T; Andersson TB; Baker E; Beilmann M; Beken S; Brendler-Schwaab S; Cirit M; David R; Dehne EM; Durieux I; Ewart L; Fitzpatrick SC; Frey O; Fuchs F; Griffith LG; Hamilton GA; Hartung T; Hoeng J; Hogberg H; Hughes DJ; Ingber DE; Iskandar A; Kanamori T; Kojima H; Kuehnl J; Leist M; Li B; Loskill P; Mendrick DL; Neumann T; Pallocca G; Rusyn I; Smirnova L; Steger-Hartmann T; Tagle DA; Tonevitsky A; Tsyb S; Trapecar M; Van de Water B; Van den Eijnden-van Raaij J; Vulto P; Watanabe K; Wolf A; Zhou X; Roth A, ALTEX 2020, 37 (3), 365–394; [DOI] [PMC free article] [PubMed] [Google Scholar]; b) Peck RW; Hinojosa CD; Hamilton GA, Clin. Pharmacol. Ther 2020, 107 (1), 181–185. [DOI] [PMC free article] [PubMed] [Google Scholar]
- 8.Feng Y; Wang B; Tian Y; Chen H; Liu Y; Fan H; Wang K; Zhang C, Biosens. Bioelectron 2020, 151, 111966. [DOI] [PubMed] [Google Scholar]
- 9.Sant S and Johnston PA, Drug Discov Today: Technol 2017, 23, 27–36. [DOI] [PMC free article] [PubMed] [Google Scholar]
- 10.Mittendorf EA, Philips AV, Meric-Bernstam F, Qiao N, Wu Y, Harrington S, Su X, Wang Y, Gonzalez-Angulo AM, Akcakanat A, Chawla A, Curran M, Hwu P, Sharma P, Litton JK, Molldrem JJ and Alatrash G, Cancer Immunol. Res 2014, 2, 361–370. [DOI] [PMC free article] [PubMed] [Google Scholar]
- 11.Vinothini K; Rajendran NK; Munusamy MA; Alarfaj AA; Rajan M, Mater. Sci. Eng. C. Mater. Biol. Appl 2019, 100, 676–687. [DOI] [PubMed] [Google Scholar]
- 12.Seton-Rogers S, Nat. Rev. Cancer, 2016, 16, 128–128. [DOI] [PubMed] [Google Scholar]
- 13.a) Bell J, Nat. Rev. Immunol 2002, 2, 460–461; [DOI] [PubMed] [Google Scholar]; b) Ai WC, Li HS, Song NN, Li L and Chen HM, Int. J. Environ. Res. Public Health 2013, 10, 3834–3842. [DOI] [PMC free article] [PubMed] [Google Scholar]
- 14.Brignall R, Cauchy P, Bevington SL, Gorman B, Pisco AO, Bagnall J, Boddington C, Rowe W, England H, Rich K, Schmidt L, Dyer NP, Travis MA, Ott S, Jackson DA, Cockerill PN and Paszek P, J. Immunol 2017, 199, 2652–2667. [DOI] [PMC free article] [PubMed] [Google Scholar]
- 15.a) Strebel A; Harr T; Bachmann F; Wernli M; Erb P, Cytometry: The Journal of the International Society for Analytical Cytology 2001, 43 (2), 126–133; [DOI] [PubMed] [Google Scholar]; b) Ito T; Oshita S; Nakabayashi T; Sun F; Kinjo M; Ohta N, Photochem. Photobiol. Sci 2009, 8 (6), 763–7; [DOI] [PubMed] [Google Scholar]; c) Speier S; Nyqvist D; Cabrera O; Yu J; Molano RD; Pileggi A; Moede T; Kohler M; Wilbertz J; Leibiger B; Ricordi C; Leibiger IB; Caicedo A; Berggren PO, Nat Med 2008, 14 (5), 574–8; [DOI] [PMC free article] [PubMed] [Google Scholar]; d) Dunkers JP; Lee YJ; Chatterjee K, Biomaterials 2012, 33 (7), 2119–26. [DOI] [PubMed] [Google Scholar]
- 16.a) Steff AM, Fortin M, Arguin C and Hugo P, Cytometry 2001, 45, 237–243; [DOI] [PubMed] [Google Scholar]; b) Strebel A, Harr T, Bachmann F, Wernli M and Erb P, Cytometry 2001, 43, 126–133. [DOI] [PubMed] [Google Scholar]
- 17.a) Zhang P, Su DM, Liang M and Fu J, Mol. Immunol 2008, 45, 1470–1476; [DOI] [PubMed] [Google Scholar]; b) Shi F, Shi M, Zeng Z, Qi RZ, Liu ZW, Zhang JY, Yang YP, Tien P and Wang FS, Int. J. Cancer, 2011, 128, 887–896. [DOI] [PubMed] [Google Scholar]
- 18.a) Qin A, Coffey DG, Warren EH and Ramnath N, Cancer Med 2016, 5, 2567–2578; [DOI] [PMC free article] [PubMed] [Google Scholar]; b) Ross SH and Cantrell DA, Annu. Rev. Immunol 2018, 36, 411–433. [DOI] [PMC free article] [PubMed] [Google Scholar]
- 19.van Meer BJ; de Vries H; Firth KSA; van Weerd J; Tertoolen LGJ; Karperien HBJ; Jonkheijm P; Denning C; AP IJ; Mummery CL, Biochem. Biophys. Res. Commun 2017, 482 (2), 323–328. [DOI] [PMC free article] [PubMed] [Google Scholar]
- 20.Soares KC, Rucki AA, Wu AA, Olino K, Xiao Q, Chai Y, Wamwea A, Bigelow E, Lutz E, Liu L, Yao S, Anders RA, Laheru D, Wolfgang CL, Edil BH, Schulick RD, Jaffee EM and Zheng L, J. Immunother 2015, 38, 1–11. [DOI] [PMC free article] [PubMed] [Google Scholar]
- 21.a) Liu H, Zhao Z, Zhang L, Li Y, Jain A, Barve A, Jin W, Liu Y, Fetse J and Cheng K, J. Immunother. Cancer, 2019, 7, 270; [DOI] [PMC free article] [PubMed] [Google Scholar]; b) Courau T, Bonnereau J, Chicoteau J, Bottois H, Remark R, Assante Miranda L, Toubert A, Blery M, Aparicio T, Allez M and Le Bourhis L, J. Immunother. Cancer, 2019, 7, 74; [DOI] [PMC free article] [PubMed] [Google Scholar]; c) Ding N, Zou Z, Sha H, Su S, Qian H, Meng F, Chen F, Du S, Zhou S, Chen H, Zhang L, Yang J, Wei J and Liu B, Nat. Commun 2019, 10, 1336. [DOI] [PMC free article] [PubMed] [Google Scholar]
- 22.a) Rockwell CE; Raman P; Kaplan BL; Kaminski NE, Biochem. Pharmacol 2008, 76 (3), 353–61; [DOI] [PubMed] [Google Scholar]; b) Dong ZM; Jackson L; Murphy JW, Infect. Immun 1999, 67 (1), 220–9. [DOI] [PMC free article] [PubMed] [Google Scholar]
Associated Data
This section collects any data citations, data availability statements, or supplementary materials included in this article.