In the article in the August 2020 compendium of the journal, there were some incorrect wording and author provided updated Figures 1 and 2.
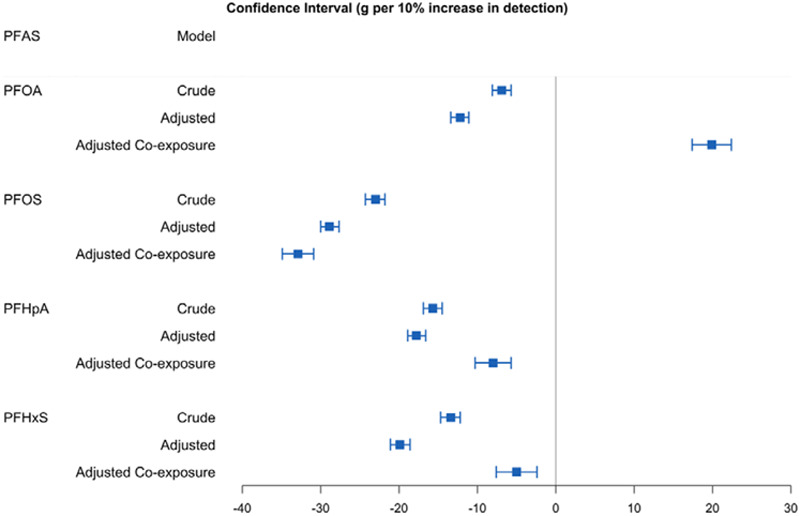
Updated Figure 1.

The change of average birthweight (g) for 10% increase in the detection of PFAS: MLE, 95% CI. Using regressions weighted by inverse variance of average birthweight.
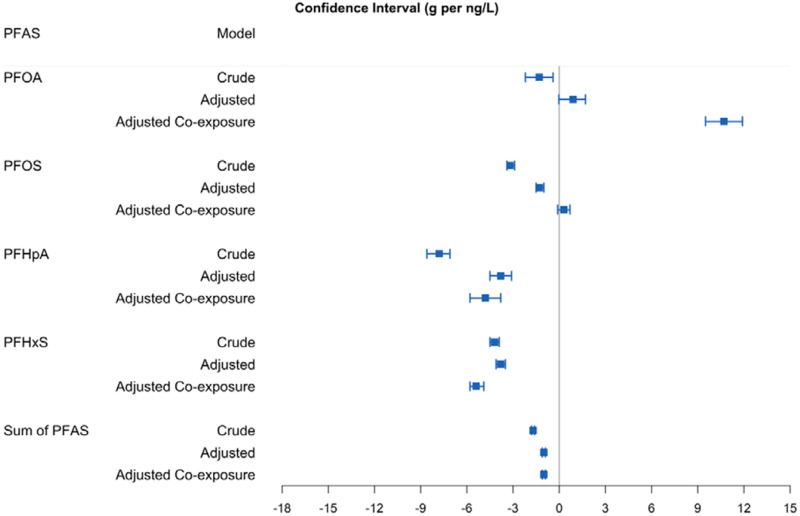
Updated Figure 2.
The change of average birthweight (g) for 1 ng/L increase in the population-weighted average PFAS water concentration: MLE, 95% CI.
In this study, we claimed that weighted regression analysis using multiple-stratified birthweight data produces equivalent results to those that would be obtained from individual-level analysis using the same variables. After careful consideration, mathematical derivations, and simulation studies, we find that this conclusion only applies to the regression coefficients and their theoretical variances, but that the estimated variances for the regression coefficients produced by statistical software packages are not identical for individual-level and group-level analyses. Fortunately, we are able to derive formulas for obtaining the correct variance estimates for the regression coefficients from individual-level analysis based on the multiple stratified data and group-level regression output. For our analyses relating per- and polyfluoroalkyl substances (PFAS) to birthweight, the corrected variance formulas produce smaller estimated variances and confidence intervals than we had originally reported. Here we present variance correction formulas and updated figures.
We derived the correct estimated variance and standard error (SE) for the individual-level inverse-variance weighted regression parameters based on the group-level inverse-variance weighted regression as follows. The detailed derivation and explanations have been added to the Supplemental Digital Content II of the publication.
 |
 |
In the above formulas, n is the total number of births (observations in individual-level analysis), m is the number of groups (observations in group-level analysis), and p is the number of regression parameters not including the intercept.  is the weighted sum of squared errors of the group-level analysis. The standard error
  can be obtained easily from the output of group-level weighted regression.
Updated Figure 1 and Figure 2 for individual-level inverse-variance weighted analyses:
The standard errors in the crude models in Figure 1 were reduced by 91-92%, and the standard errors in the adjusted and adjusted co-exposure models in Figure 1 were reduced by 32% compared with the group-level analysis.
The standard errors in the crude models in Figure 2 were reduced by 92%, and the standard errors in the adjusted and adjusted co-exposure models in Figure 2 were reduced by 34-35% in the inverse-variance weighted individual-level analysis compared with the inverse-variance weighted group-level analysis.
In summary, although the standard errors were reduced substantially by variance correction from group-level analysis to individual-level analysis, our conclusions were the same as those in the publication.
Footnotes
Published online 4 February 2021
REFERENCE
- Zhu Y, Bartell SM. Per- and polyfluoroalkyl substances in drinking water and birthweight in the US. Environ Epidemiol. 2020; 4:e0107. [DOI] [PMC free article] [PubMed] [Google Scholar]


