

Abstract
Over the past few years, human exposure to per- and polyfluoroalkyl substances (PFAS) has garnered increased attention. Research has focused on PFAS exposure via drinking water and diet, and fewer studies have focused on exposure in the indoor environment. To support more research on the latter exposure pathway, we conducted a study to evaluate PFAS in indoor dust. Dust samples from 184 homes in North Carolina and 49 fire stations across the United States and Canada were collected and analyzed for a suite of PFAS using liquid and gas chromatography-mass spectrometry. FTOHs and diPAPs were the most prevalent PFAS in both fire station and house dust, with medians approximately 100 ng/g dust or greater. Notably, PFOS, PFOA, PFHxS, PFNA, and 6:2 diPAP were significantly higher in dust from fire stations than from homes, and 8:2 FTOH was significantly higher in homes than fire stations. Additionally, when comparing our results to earlier published values, we see PFAA levels in residential dust appear to be decreasing over time, particularly for PFOA and PFOS. These results highlight a need to better understand what factors contribute to PFAS levels in dust and to understand how much dust contributes to overall human PFAS exposure.
Keywords: PFAS, dust, PFOS, PFOA, exposure, firefighter
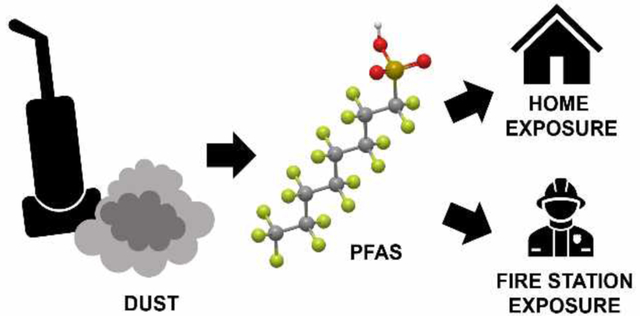
Graphical Abstract
INTRODUCTION
Per- and polyfluoroalkyl substances (PFAS) have garnered attention as “forever chemicals” that are widely detected in humans and the environment. PFAS are used for their water- and stain-repellant properties and can be found in many kinds of consumer products. However, concerns over the persistence, bioaccumulation, and toxicity of some PFAS have motivated additional research to better understand human PFAS exposure.
PFAS are a large group of chemicals that include approximately 5,000 different compounds1 with several different subclasses such as perfluoroalkyl carboxylic acids (PFCAs), perfluoroalkyl sulfonic acids (PFSAs), fluorotelomer alcohols (FTOHs), and polyfluoroalkyl phosphoric acid esters (PAPs).2–3 The most persistent PFAS compounds are the perfluoroalkyl acids (PFAAs), which include the PFCAs and PFSAs. Some PFAAs, particularly PFOS and PFOA, are known to have long half-lives in humans and have been associated with a myriad of human health effects.4 Other PFAS such as the FTOHs and PAPs are less persistent due to their physicochemical properties; however, these compounds can degrade into the more persistent PFAAs and have been referred to as PFAA precursors.2
PFAS are amphiphilic compounds with both hydrophobic and lipophobic properties; thus, they are frequently used as water and oil repellents. Various consumer products common to most homes contain PFAS5 and can be sources of PFAS to the indoor environment and dust. For example, PFAS can be found in nonstick cookware and food packaging,6–8 in personal care products such as cosmetics and sunscreens,9 and in impregnation sprays and agents used for textile protection, such as stain repellant carpets and upholstery.5, 10
Data for PFAS concentrations in the indoor environment are important for better understanding the main exposure pathways for PFAS in humans, particularly as indoor sources are less well-characterized than dietary sources. While a tolerable weekly intake for four PFAS in food has been established by the European Food Safety Authority,11 house dust ingestion and indoor air may be another major pathway of PFAS intake for some people.12 People spend a considerable amount of time indoors, leading to exposure to chemicals from indoor air and dust derived from building materials and consumer products in the home. For example, exposure to dust has been shown to be an important exposure pathway for chemicals such as flame retardants.13–15 The United States Environmental Protection Agency (USEPA) estimates adults ingest approximately 30 mg of indoor dust per day and children ingest approximately 60–100 mg.16
Previous studies have measured PFAS in dust from homes, daycares, and businesses across several countries.17–25 However, there are limited current data on PFAS in dust from homes in the United States, and no one to date has measured dust PFAS concentrations in fire stations as an occupational exposure pathway for fire fighters.
Studies have shown that fire fighters have higher exposure to PFAS compared to the general population.26–31 This is especially true for fire fighters exposed to aqueous film-forming foams (AFFF), a type of firefighting foam that contains PFAS.32 AFFF is used to quickly extinguish fires and contains varying types of PFAS depending on the formulation. AFFF is especially used to contain petroleum-fuel-based fires at airports and military sites (i.e., Class B fires); unfortunately, AFFF use has led to widespread PFAS contamination near these sites and at fire fighter training areas.33–34 In one study, fire fighters who trained with firefighting foams had increased serum PFHxS and PFNA following training in comparison to baseline serum concentrations taken two weeks prior.27 Exposure to PFAS through dust and smoke inhalation during a fire event is also possible. For example, first responders to the World Trade Center collapse on September 11, 2011 were found to have plasma levels of PFOA and PFHxS that were two-fold higher than the general population, and especially high levels were found in first responders exposed to the greatest amounts of dust and smoke.28 Similar results were seen in the plasma of California fire fighters, with PFOA and PFNA being two-fold higher than the general United States population.29 Additionally, protective turnout gear used by fire fighters may have PFAS coatings which could contribute to exposure.35
PFAS sources unique to fire fighters (e.g., AFFF and turnout gear) have raised questions about the extent of PFAS exposure in the fire stations where fire fighters spend a substantial amount of their time while on duty. Therefore, the goal of this present study was to provide more information on the levels of PFAS in indoor dust, for both the general public and for fire fighters. To support this goal, we collected dust samples from fire stations (occupational exposure) and residential homes (general population exposure) and analyzed them for a suite of 17 PFAS (Table S1). Fire stations were hypothesized to have higher PFAS dust levels due to the likelihood of more frequent contact with potential PFAS sources (e.g., AFFF, turnout gear). A secondary goal of this study was to assess potential differences in PFAS levels between fire stations and residential settings and to determine if PFAS dust concentrations varied based on location, size, age of the buildings, or carpeting.
MATERIALS AND METHODS
Dust collection and survey data collection
Residential house dust
Dust samples from 184 residential homes in North Carolina, United States were collected between 2014 and 2016 as part of the Toddler’s Exposure to SVOCs in Indoor Environments (TESIE) study. The TESIE study population has been further described by previous literature.36–37 Briefly, home visits were conducted with families enrolled in the TESIE study to collect dust samples and data about the home environment. Study protocols were approved by the Duke Institutional Review Board.
Dust extracts from homes were processed as previously described in Hammel et al., (2019)37 and Phillips et al., (2018).38 Briefly, the entire exposed floor area of the main living room was vacuumed with a Eureka Mighty Mite vacuum fitted with a cellulose thimble within the hose attachment,13 and each thimble was wrapped in aluminum foil, placed in sealed plastic bags, and stored at −20°C after collection until analysis.
Participants were asked to complete questionnaires during the home visits as also previously described in Hammel et al., (2019)37 and Phillips et al., (2018).38 Age of home and square footage of the home and main living area were collected as part of the questionnaire and verified with tax records where possible.
Fire station dust
Dust samples were collected from 49 fire stations in the United States in 201539 and in Canada in early 2018.40 Fire stations were selected for participation in the study through a collaboration with the International Association of Fire Fighters (IAFF). Stations were selected if they met certain criteria: location in urban or suburban areas, active engagement in urban or suburban fires, fire station as residence for on-duty fire fighters who return to station after deployment to a fire for duration of their shift, and fire stations and bays contained to one building.
The fire station dust samples have previously been analyzed for flame retardants.39–40 Additional methodology information for the US fire stations has been previously reported in Shen et al., (2018)39 and for the Canadian fire stations in Gill et al., (2020).40 In brief, participating stations were sent packets of information describing the study’s purpose and instructions for collecting samples in only the living quarters areas (including kitchen and eating areas, sleeping areas, and TV viewing areas). Fire stations in the US were asked to use their own vacuum cleaners with new vacuum bags and to collect dust over the course of one month. Canadian fire stations were provided with new vacuum cleaners (Dirt Devil, Featherlite Bagged Upright) and a set of new vacuum cleaner bags. Stations were instructed to use the vacuum cleaner only in the living quarters for the purposes of the study and to refrain from mopping, sweeping, or other cleaning techniques in the living quarters during the month of the study. Vacuum cleaner bags from fire stations were sealed in polyurethane bags and stored at 4 °C until analysis. Surveys were collected from fire stations to obtain information on building location, year of construction, square footage, and the percentage of the living quarters containing carpeting.
Dust sample preparation, extraction, and analysis
Full methods information and HPLC-MS/MS and GC-MS conditions are included in Supporting Information and Table S2.
Quality assurance and quality control (QA/QC)
Quality assurance and control were addressed by analyzing laboratory processing blanks alongside the samples and by analyzing house dust standard reference material (SRM 2585, National Institute of Standards and Technology (NIST), Gaithersburg, MD). Laboratory blanks (n=5–6) and SRM 2585 (n=5) were analyzed in each batch of dust samples, and five field blanks (n=5) were processed along with the fire station dust samples. PFAS levels in samples were blank-corrected using the average laboratory processing blank. Method detection limits (MDLs) were calculated using three times the standard deviation of the average laboratory blank levels if the analyte was detected in the blanks, or by using a value equal to ten times the noise if absent in the lab blanks. MDLs were normalized to the average mass of dust extracted (0.1 g). If dust concentration values were below the MDL, the value was imputed with dust mass specific MDL values. PFAS measurements for the extracted SRM and reference values for house dust SRM 258517, 41–42 are provided in Table S3.
Statistical analyses
Data were analyzed and graphed using GraphPad Prism (Version 8.4.0) and Microsoft Excel. Nonparametric statistical tests were used as the data were not normally distributed, as determined by the Shapiro-Wilk normality test. Statistical analyses were only performed on individual analytes that were detected in more than 50% of samples. The Mann-Whitney test (two-tailed) was used to determine statistical significance at α < 0.05. Some survey questionnaires were incomplete or missing; thus, the sample size for some endpoints varied.
RESULTS AND DISCUSSION
PFAS concentrations in dust samples
In this study we report on PFAS concentrations measured in both residential dust samples and dust collected from living quarters of fire stations within the United States and Canada. PFAS were detected in all dust samples. Detection frequencies and method detection limits (MDLs) for each PFAS are presented in Table 1, along with maximum and median concentrations. In general, the shorter-chain PFAAs (PFBA, PFBS, and PFPA) were less frequently detected than the longer-chain PFAAs and the precursor compounds. The FTOHs were the most abundant group of the PFAS quantified in both homes and fire stations. In contrast, the median concentrations for many of the PFAAs were below 20 ng/g dust.
Table 1:
Detection frequency, method detection limit (MDL), median, and maximum concentrations for PFAS analytes in dust samples. Bolded compounds were significantly different between fire stations and homes.
| Class | Compound | Fire Stations (2015 and 2018, n=49) | Residential Homes (2014–2016, n=184) | p-value* | |||||||
|---|---|---|---|---|---|---|---|---|---|---|---|
| Detection Frequency (%) | MDL (ng/g dust) | Median Concentration (ng/g dust) | Maximum Concentration (ng/g dust) | Detection Frequency (%) | MDL (ng/g dust) | Median Concentration (ng/g dust) | Maximum Concentration (ng/g dust) | ||||
| PFAA Precursors | diPAP | 6:2 diPAP | 100 | 2.54 | 287 | 6,270 | 100 | 0.48 | 113 | 34,360 | *p<0.0001 |
| 8:2 diPAP | 94 | 9.63 | 99.3 | 2,250 | 34 | 10.63 | <MDL | 6,890 | - | ||
| FOSE | MeFOSE | 88 | 5.00 | 30.2 | 1,110 | 19 | 13.17 | <MDL | 7,980 | - | |
| EtFOSE | 65 | 5.00 | 9.97 | 17,540 | 15 | 15.45 | <MDL | 370 | - | ||
| FTOH | 6:2 FTOH | 96 | 48.90 | 756 | 86,060 | 97 | 6.44 | 569 | 248,920 | p=0.1411 | |
| 8:2 FTOH | 92 | 7.23 | 216 | 65,170 | 99.5 | 15.80 | 1,435 | 44,220 | *p<0.0001 | ||
| 10:2 FTOH | 82 | 5.00 | 84.9 | 183,730 | N/A | N/A | N/A | N/A | - | ||
| Legacy PFAAs | PFCA | PFBA | 84 | 1.03 | 4.6 | 213 | 9.2 | 1.72 | <MDL | 546 | - |
| PFPA | 41 | 1.20 | <MDL | 1,410 | 10 | 0.14 | <MDL | 135 | - | ||
| PFHxA | 41 | 10.30 | <MDL | 1,150 | 97 | 0.42 | 8.5 | 1,380 | - | ||
| PFHpA | 37 | 6.77 | <MDL | 382 | 97 | 0.51 | 8.9 | 713 | - | ||
| PFOA | 82 | 1.60 | 17.6 | 791 | 100 | 0.26 | 7.9 | 2,350 | *p=0.0075 | ||
| PFNA | 96 | 0.47 | 7.2 | 203 | 99.5 | 0.15 | 3.3 | 208 | *p=0.0035 | ||
| PFDA | 63 | 1.49 | 2.5 | 137 | 41 | 0.06 | 6.2 | 4,130 | - | ||
| PFSA | PFBS | 12 | 8.56 | <MDL | 2,650 | 1.1 | 22.28 | <MDL | 320 | - | |
| PFHxS | 86 | 0.97 | 6.8 | 8,280 | 57 | 0.25 | 2.0 | 694 | *p<0.0001 | ||
| PFOS | 96 | 1.44 | 64.5 | 74,370 | 84 | 0.20 | 4.4 | 2,810 | *p<0.0001 | ||
denotes statistically significant differences between fire stations and homes by the two-tailed nonparametric Mann-Whitney test; no p-values are reported for compounds detected in less than 50% of samples.
N/A: not applicable as it was not measured
<MDL: below method detection limit
Values less than MDL were imputed with dust mass specific MDLs
There was considerable variation in the distribution of dust concentrations for individual PFAS analytes, as seen by the range of concentrations depicted in Figure 1. For example, the maximum concentrations for some PFAS (e.g., PFOS, FTOHs, and FOSEs) were orders of magnitude higher than the median concentrations. Based on median dust concentrations, the most abundant PFAS was 8:2 FTOH in residential homes (1,440 ng/g dust) and 6:2 FTOH in fire stations (760 ng/g dust). Of the PFAAs, PFHpA was the most abundant in homes (median concentration of 9.0 ng/g dust) while PFOS was the most abundant in fire stations (median concentration of 65 ng/g dust). Median levels for dust PFAS reported here ranged from tens to hundreds of nanograms per gram (ng/g), which are generally lower than the levels of organophosphate ester flame retardants (OPEs)38 and phthalates37 we measured in these same house dust samples in previous studies.
Figure 1: PFAS dust concentrations in fire stations and homes.
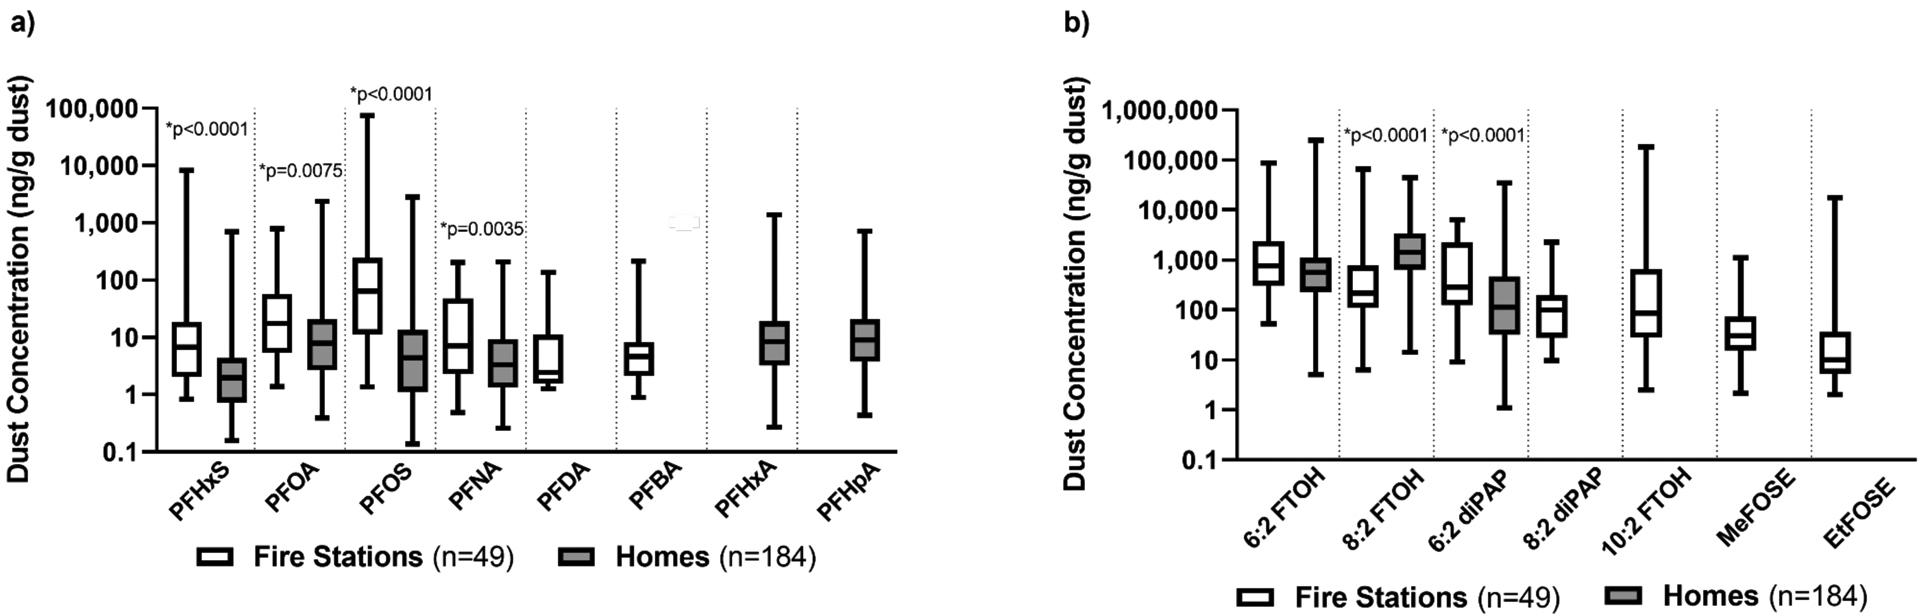
Dust concentrations for a) legacy PFAAs and b) PFAA precursors in both fire stations and residential homes. Boxplots represent the minimum, 25th percentile, median, 75th percentile, and maximum concentrations for each analyte. Analytes are only represented as boxplots if they were detected in more than 50% of samples as presented in Table 1. Concentrations are reported on a log scale. Significance determined by Mann-Whitney test.
Comparing dust PFAS concentrations in fire stations and homes
Overall, precursor PFAS were found at higher concentrations than legacy PFAAs in both fire stations and homes, and both locations were dominated by diPAPs and FTOHs. This suggests that PFAS exposure via dust in fire stations versus residential settings is not drastically different, though a few analytes show some differences. PFOS, PFOA, PFHxS, PFNA, and 6:2 diPAP were significantly higher in fire station dust than residential dust. Median dust levels in fire stations were approximately 15 times higher for PFOS (*p<0.0001), approximately 3 times higher for PFHxS (*p<0.0001), and approximately 2.5 times higher for 6:2 diPAP (*p<0.0001) compared to median dust levels in homes. Only 8:2 FTOH was significantly higher in house dust than in fire station dust (approximately 7 times higher, *p<0.0001).
PFAS profiles in house and fire station dust were both dominated by diPAPs and FTOHs, as shown in Figure S1. Dust samples from the fire stations and homes were both collected from the living areas, so it is unsurprising that the overall relative proportions of PFAS in dust are similar. This likely suggests that the sources of PFAS to the living quarter dust are from similar products or similar construction materials used in both homes and in fire stations.
However, fire station dust PFAS levels did somewhat differ from homes as fire stations had higher median concentrations of PFOS, PFOA, PFHxS, PFNA, and 6:2 diPAP. The higher levels of PFOS and PFHxS in fire stations may be linked to the use or storage of AFFF by fire fighters. PFOS and PFHxS have been noted to be components of some AFFF formulations.31–33, 43 High PFOS and PFHxS serum levels in fire fighters have been hypothesized by some to be due to use of these foams or exposure to burning stain-resistant carpeting.31–32, 44–45 Information on the types of AFFF used by the various stations was not collected as part of this present study. There may also be differences between fire stations and homes because of how the living quarters are utilized in each environment. Fire stations likely have a greater flowthrough of people than homes in addition to frequent turnover as fire fighters arrive and leave for shifts; the fire stations in our study had an average of 7 fire fighters per shift.
PFAS concentrations in fire station dust by country
A notable result from this present study is that fire stations in the United States had significantly higher ΣPFAS dust concentrations than fire stations in Canada for the subset of 17 PFAS analytes we measured. As displayed in Figure 2, US fire stations (n=25) had a median ΣPFAS concentration of 10,600 ng/g dust, which is approximately 3.5 times higher than the Canadian fire stations’ median ΣPFAS concentration of 2,900 ng/g dust (n=24).
Figure 2: Dust ΣPFAS in fire stations by country.
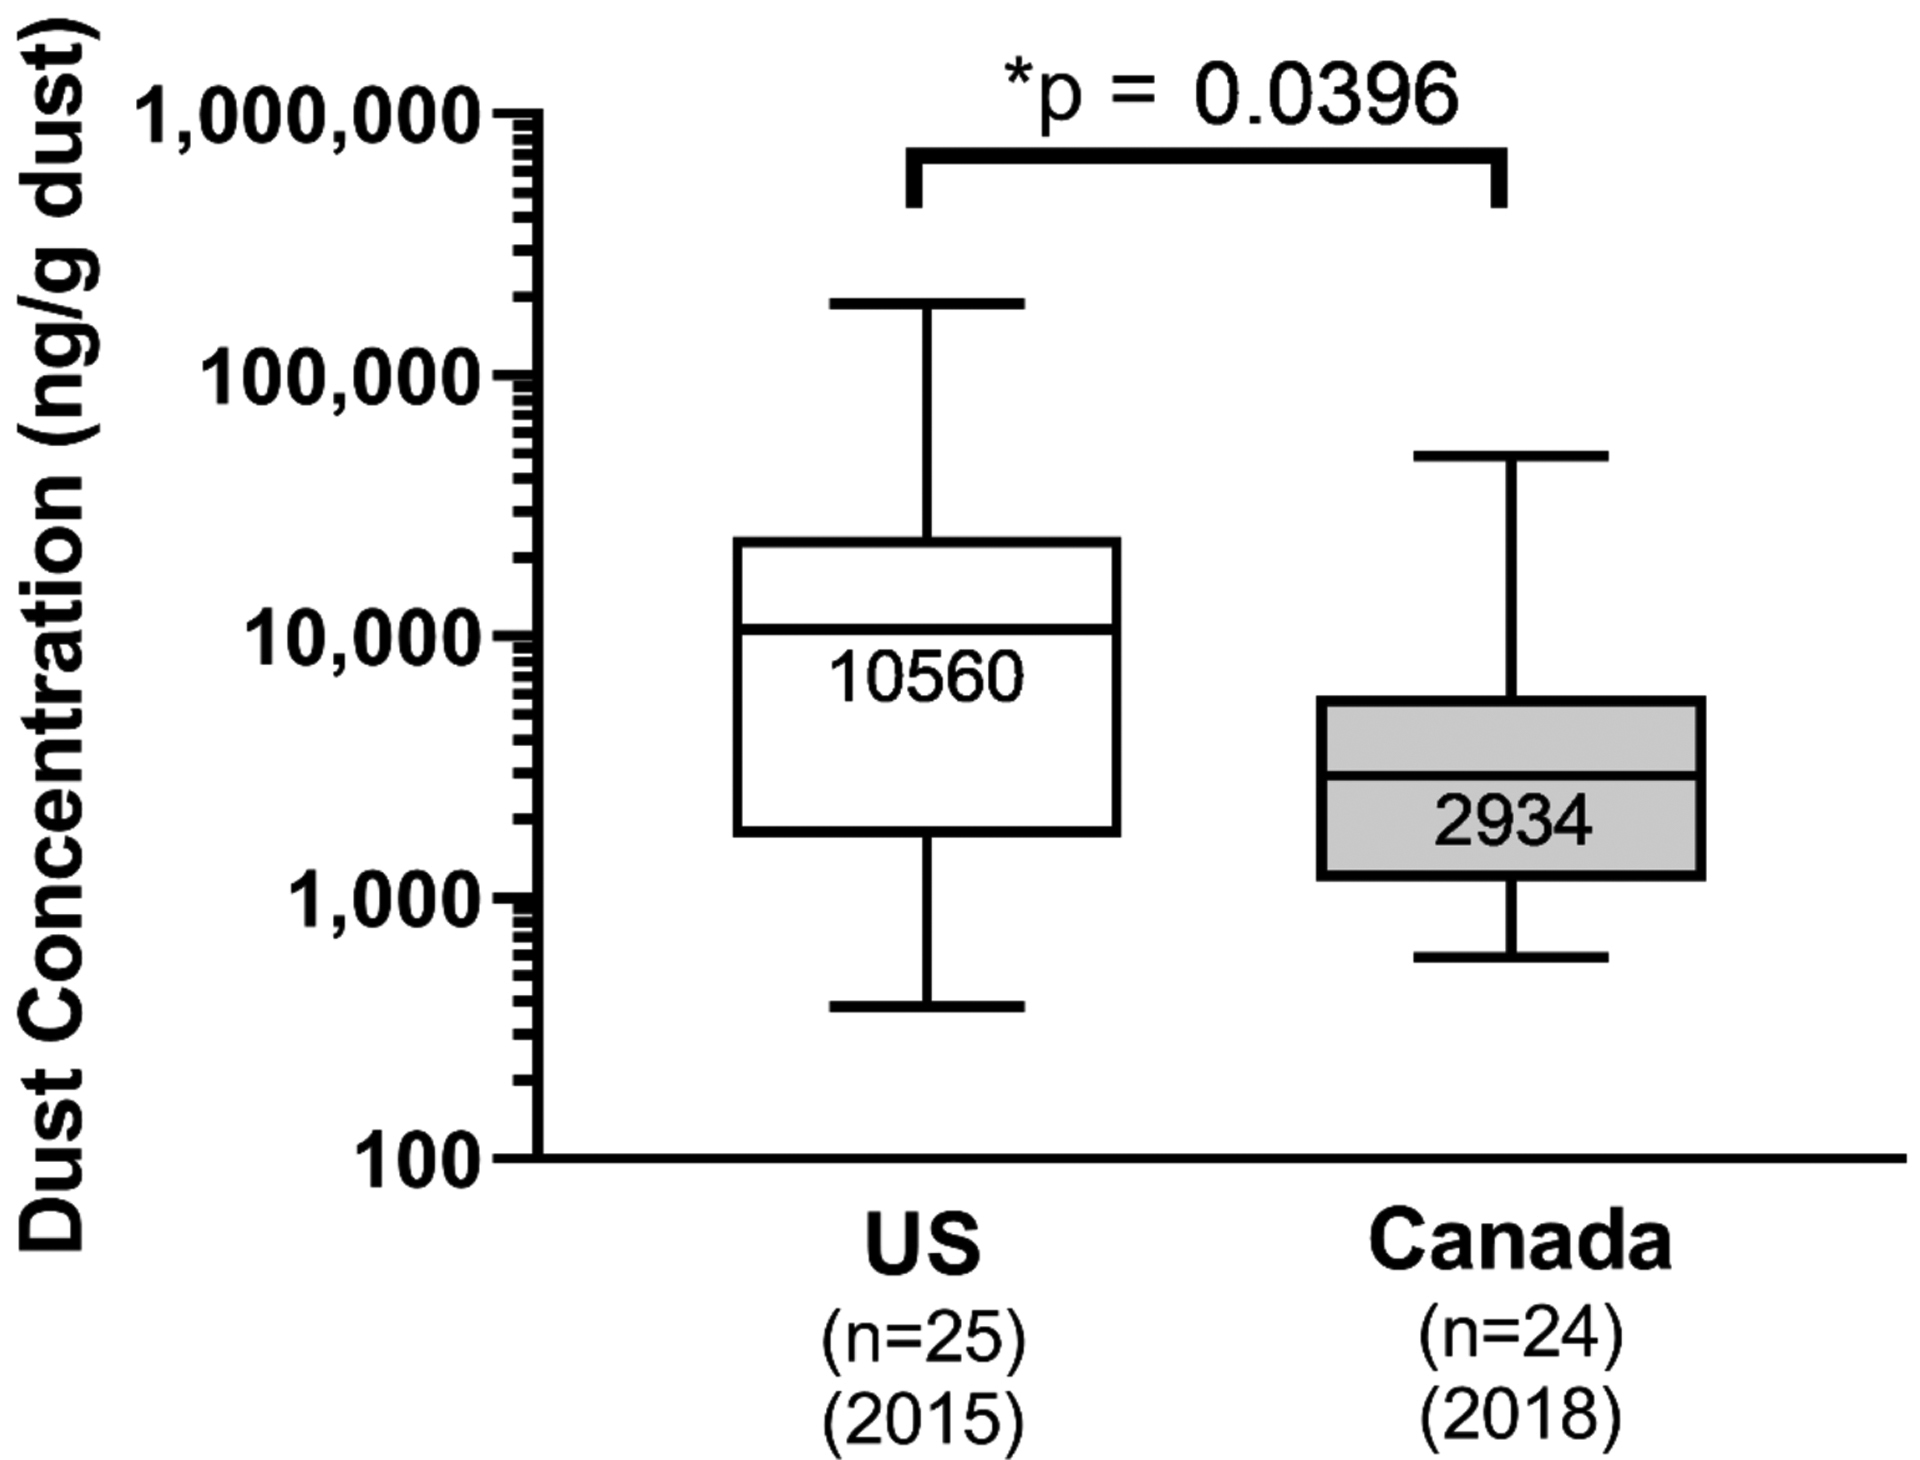
The ΣPFAS concentration in dust was significantly higher in US fire stations than Canadian fire stations (Mann-Whitney test, two-tailed, *p=0.0396). The ΣPFAS concentration represents the sum of all 17 PFAS analytes measured in a dust sample. Boxplots represent the minimum, 25th percentile, median, 75th percentile, and maximum concentrations. Median concentration values are listed inside the box. Concentrations are reported on a log scale.
Different trends and regulations regarding building codes, construction materials, and fire station practices in the use of PFAS-containing products may result in different PFAS dust levels between the US and Canada. However, it must be noted that the fire station samples in this present study were collected at different times (2015 for the US stations and 2018 for the Canadian stations); thus, the Canadian fire station dust samples may have lower PFAS levels due solely because they were collected more recently. We also cannot rule out the possibility that differences in sample collection methodology may be contributing to the observed differences between countries.
Analyses were also conducted on individual PFAS to determine which PFAS were driving the difference in ΣPFAS between US and Canadian fire stations. Median concentrations of individual PFAS captured by our analytical methods were generally higher in US fire station dust samples compared to Canadian fire station dust, as seen in Figure 3; 12 of 13 analytes had higher median dust concentrations in the US samples with only 8:2 diPAP being higher in Canadian fire stations. PFOS, PFOA, PFHxS, PFDA, 10:2 FTOH, and EtFOSE were significantly higher in US fire station dust compared to Canadian fire stations. The median PFOS dust concentration in the US fire stations was 104 ng/g dust, which is 7 times greater than the Canadian concentration of 13 ng/g dust. Median and maximum concentrations by country are presented in Table S4.
Figure 3: Dust PFAS concentrations by analyte between US and Canadian fire stations.
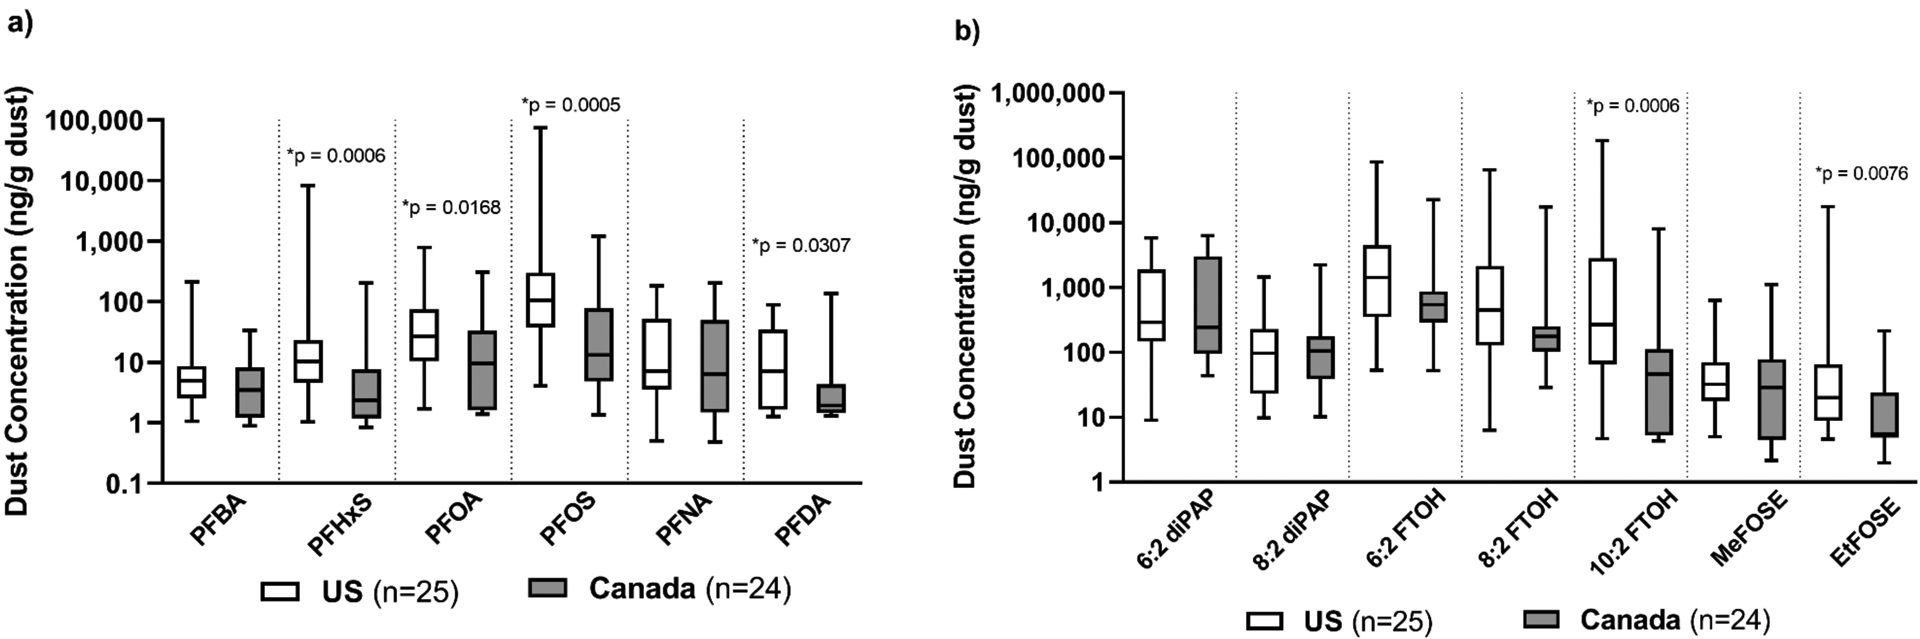
Results for a) legacy PFAAs and b) PFAA precursors. Significance determined by the two-tailed Mann-Whitney test. Boxplots represent the minimum, 25th percentile, median, 75th percentile, and maximum concentrations. Concentrations are reported on a log scale.
Fire station dust samples were collected from several different states and provinces. The ΣPFAS dust concentrations by region (state and province) are presented in Figure S2 to illustrate regional variability. The ΣPFAS for homes represents the sum of 16 PFAS compounds (without 10:2 FTOH) while ΣPFAS for fire stations represents the sum of 17 PFAS compounds. The observed ranges of ΣPFAS dust concentrations displayed wide variability, even within a single region (e.g., within New Hampshire). No large differences in ΣPFAS dust levels were observed between regions in this limited assessment, although due to the low sample size per region for the fire station samples (n=4–9), statistical analysis by region was precluded.
PFAS dust concentrations and survey responses
Information on building characteristics was collected via surveys during the study. Table S5 describes survey data from fire stations, and Table S6 describes survey data from homes. The total number of samples was small, and there was wide variability in the recorded age of each building, so dust samples were grouped into two categories: construction pre- and post-1970. PFAS dust concentrations stratified by building age are presented in Figures 4a for fire stations and Figure S3a for US homes. No significant differences in dust ΣPFAS were observed due to building age in this present study. However, it is important to note that we did not record whether any renovations might have occurred within the building.
Figure 4: ΣPFAS dust concentration and survey responses for fire stations.
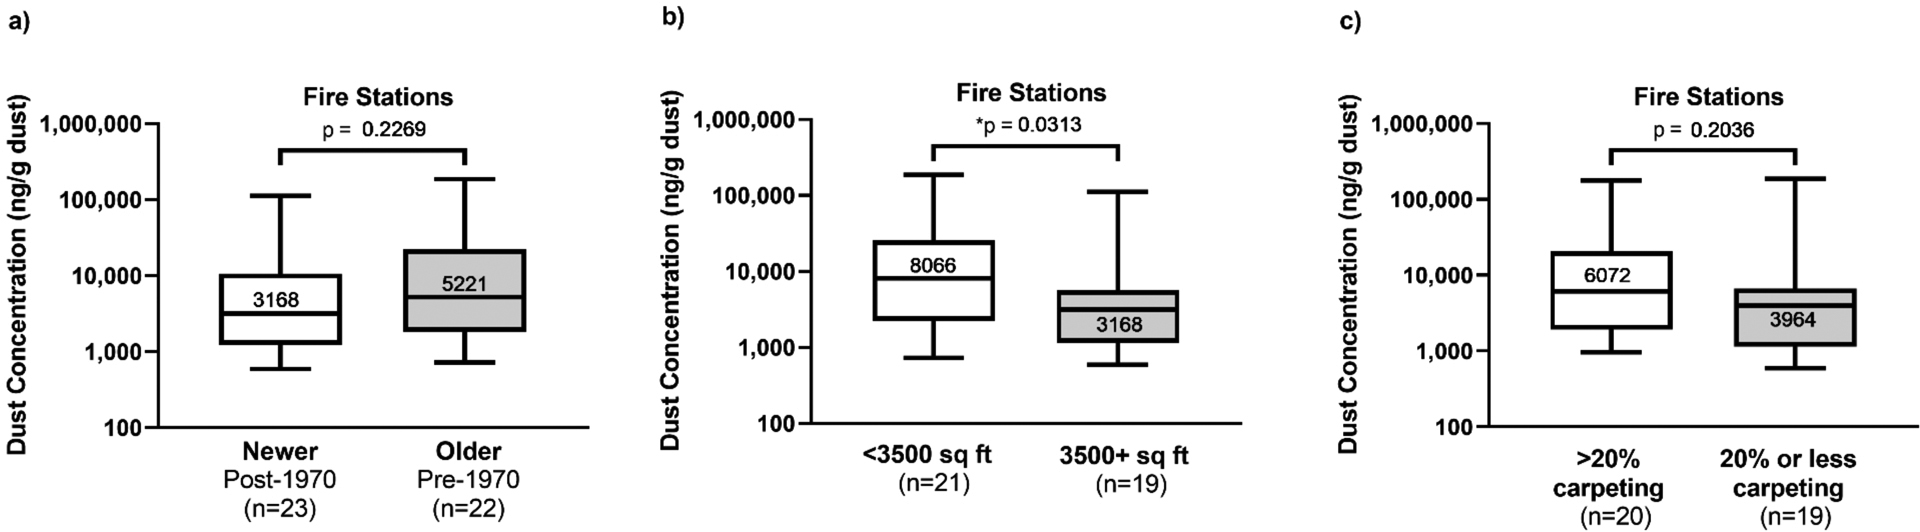
Differences in dust ΣPFAS concentrations in fire stations due to: a) year of construction, b) square footage of fire station living quarters, and c) percentage carpeting in the living quarters. Significant differences were seen in ΣPFAS dust concentrations based on square footage in fire stations (*p=0.0313, two-tailed Mann-Whitney test). Sample sizes are variable due to missing survey data. Median concentrations are listed inside the box. Boxplots represent the minimum, 25th percentile, median, 75th percentile, and maximum concentrations. Concentrations are reported on a log scale. The ΣPFAS concentration represents the sum of all 17 PFAS analytes measured in an individual fire station dust sample.
Square footage of home and fire station living quarters was also recorded and analyzed. Due to the small sample size, square footage was dichotomized near the median and categorized into either less or greater than 3,500 square feet for fire stations and less or greater than 1,720 square feet for homes. Within fire stations, ΣPFAS dust concentrations were significantly higher in stations that had a living quarters with a smaller square footage (*p=0.03, Mann-Whitney test) (Figure 4b). This difference seems to be driven by differences in several PFAS, including PFBA, PFHxS, PFOA, PFOS, PFDA, 6:2 FTOH, and 10:2 FTOH (Figure S4). For homes, square footage was not significantly associated with ΣPFAS dust levels (Figure S3b).
Analyses were also conducted considering the presence or absence of carpeting in the vacuumed room (generally the main living room). For fire stations, we recorded the percentage of carpeting, and for homes, we recorded the presence of carpeting or rugs in the main living area of the home (i.e. the area vacuumed). Within fire stations, the percentage of carpeting in the living quarters was not significantly associated with ΣPFAS dust levels (Figure 4c); a similar non-significant result for ΣPFAS was found for homes (Figure S3c). However, when further delving into these data by individual analytes, several of the FTOHs were found to be significantly higher in the dust samples from carpeted areas in both fire stations and homes (Figure S5). This suggests that carpeting may be a source of the FTOHs observed in these dust samples.
Differences in building use and construction may be important factors for PFAS dust concentrations. For example, Zheng et al., (2020)24 recently reported PFAS dust concentrations in US childcare centers. Similar to this present study, Zheng et al., (2020)24 found that FTOHs were the most abundant class, and PFAAs were the least abundant class measured in dust. However, median PFAS dust levels in the childcare centers appear to be lower than the levels reported in this present study and may reflect differences in building use and construction.
Time trends in PFAS dust levels and comparisons to previous literature
Previous studies have measured PFAS in house dust from the United States19, 25, 46–47 and across the world.14, 17–19, 48–56 Studies reporting PFAS levels in US house dust are summarized in Table S7 and compared to the present study. As shown in Figure 5, the median concentrations of PFOA, PFOS, and PFHxS in US house dust samples appear to be decreasing over the last 20 years. In 2000, the 3M company began phasing out its production of PFOS, and in 2006, several other companies pledged to phase out the use of PFOS and PFOA in the US. While PFOS and PFOA production have declined over the past two decades in the US, other PFAS are replacing them. We would expect to see increases in these newer replacement PFAS in dust as they are identified, and as analytical and sampling methods improve over time. Data on PFAS precursors in US house dust studies are limited and could not be examined as thoroughly for trends over time.
Figure 5:
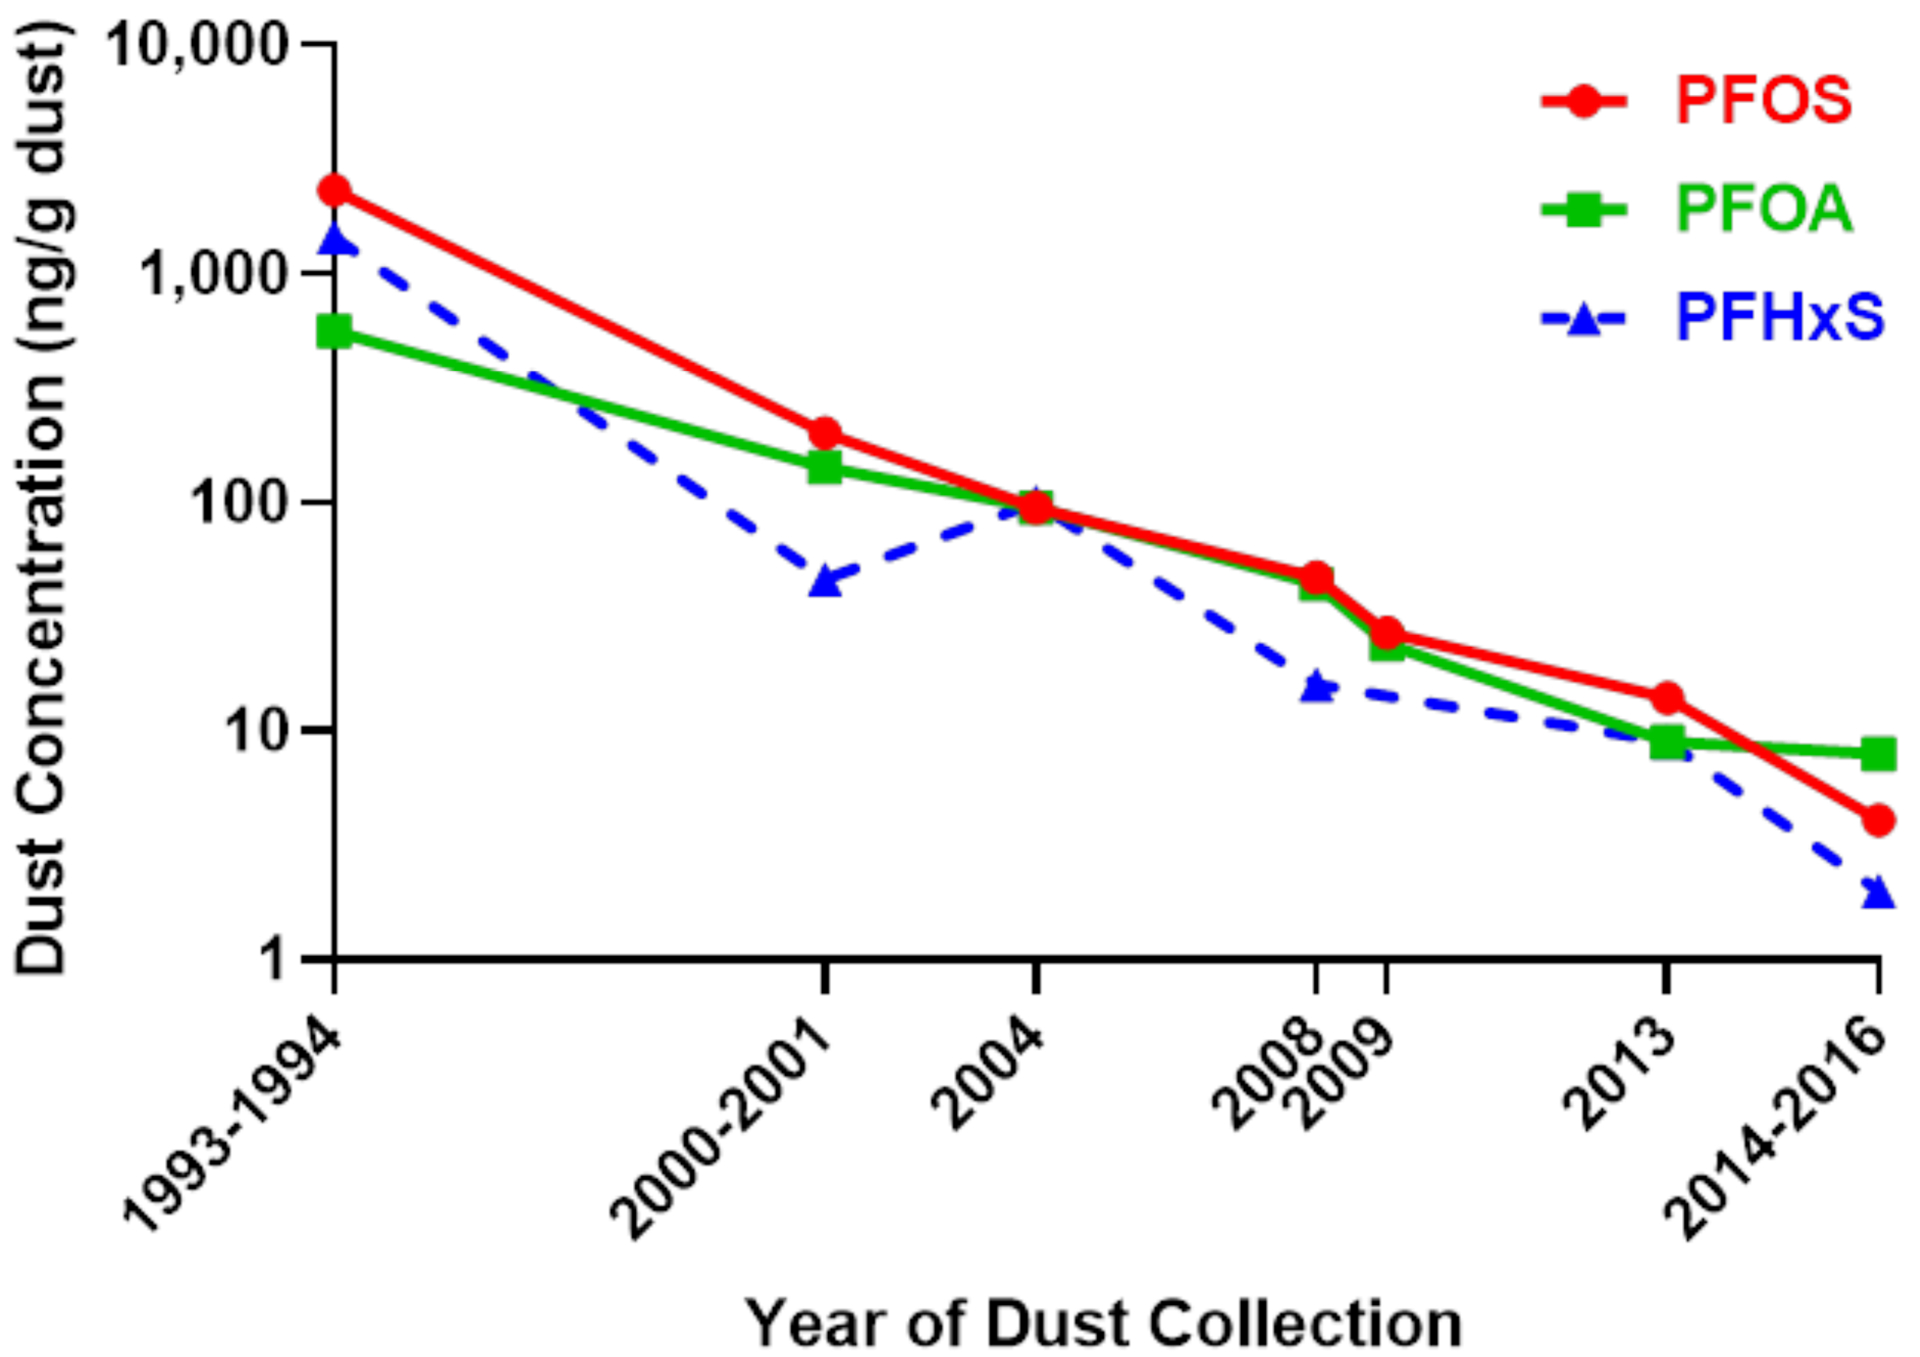
Decline in PFAS concentration in US residential dust over time as reported in the studies cited in Table S7
Karaskova et al.19 measured house dust collected in 2013 and found a higher median concentration for PFOS in US homes than Canadian homes (14 vs. 9 ng/g), similar to our results in US and Canadian fire stations. Strynar and Lindstrom46 analyzed US house dust from 2000–2001 and found higher dust concentrations for PFAAs but lower 6:2 FTOH and 8:2 FTOH when compared to our house dust samples collected in 2014–2016. We compared house dust concentrations from the 102 US homes in Strynar and Lindstrom46 to the house dust samples in our present study in Figure S6 and found that PFHxA, PFHxS, PFHpA, PFOA, and PFOS were significantly lower in our study, suggesting that levels have significantly decreased over time. In contrast, 8:2 FTOH significantly increased and was detected more frequently in our more recent house dust samples, and 6:2 FTOH followed a similar trend. Knobeloch et al.47 analyzed US house dust collected in 2008 and measured lower median PFAA dust concentrations than in Strynar and Lindstrom46 and higher PFAA concentrations than the present study. These results, and their differences over time (Figure 5), may reflect the phase-out of PFOS and PFOA from consumer products since 2000.
Winkens et al.17 measured PFAS in floor dust from children’s bedrooms in Finland and found that FTOHs and diPAPs dominated the dust samples, similar to the results of this current study. However, US residential dust concentrations were higher than Finnish samples for 6:2 diPAP (113 vs. 54 ng/g) and for 8:2 FTOH (1,440 vs. 46 ng/g). FTOHs have been found at high levels in waterproofing agents, carpets, and textiles,57 and this may explain why FTOHs are the most abundant PFAS class measured in these dust samples collected from living quarters.
Limitations
There are several limitations to this present study. House dust samples were only collected in North Carolina, and it is possible that there are regional differences in home construction or building practices that influence PFAS dust levels. Furthermore, we measured 17 PFAS compounds using our LC and GC techniques in this study, but there are thousands of different PFAS.1 At the time when the house dust samples were analyzed, an analytical standard for 10:2 FTOH was not available in our laboratory, and as a consequence, 10:2 FTOH was quantified in the fire station dust but not in house dust. Additionally, we did not measure 6:2 FTS, a PFAS that has been found in some AFFF formulations.58 Another limitation is that PFBS had a relatively high detection limit in our study compared to the other analytes; this may explain why PFBS had a low detection frequency in our study despite PFBS being used to replace longer-chain PFAS.
Fire station dust was not retrieved using the same standardized techniques or equipment as the house dust. Fire station samples were collected by fire fighters rather than trained researchers, so we cannot guarantee that collection methodologies were consistent. For example, Canadian and US fire stations used different vacuuming equipment, and a few fire stations in British Columbia collected combined dust from the interiors of their fire engine trucks as well as their living quarters. In contrast, the house dust was collected in a standardized way by a small team of researchers. A meta-analysis by Mitro et al., (2016)59 demonstrated the variability among indoor dust studies in collection method and storage conditions. Mitro et al., (2016) noted that methodological consistency may be improved by using extraction thimbles in the crevice tool of vacuum cleaners instead of sampling from used bags.59 Different brands of vacuum cleaners and bags could also contribute to dust data variability.60
In addition, house dust samples were collected at only a single point in time (i.e., during one home visit) while fire station dust was sampled and combined over the period of one month. This present study also only examined dust found in the main living quarters of homes and fire stations, which may not represent PFAS exposure in other rooms of the buildings. While this present study explored some of the differences between PFAS dust concentrations in fire stations and homes, the relatively low number of fire stations somewhat limits generalizability. With these limitations, it is difficult to draw conclusive information regarding the factors influencing dust PFAS concentrations.
The lack of strong associations between the survey data and dust PFAS concentrations highlights a need for more research in understanding what drives PFAS dust concentrations. Survey data in this study was limited by participation, and questionnaires used at fire stations were originally designed to explore predictors of flame retardants, not necessarily PFAS. Our results suggest that fire stations in the United States have higher dust PFAS concentrations than Canadian fire stations. However, it is unclear if this difference could be driven by building materials or use of specific products used within those facilities (e.g., different types of AFFF) or by differences in how and when the dust was collected.
Future Implications
Moving forward it will be important to consider the impact of precursors on PFAS exposure as these were found at the highest concentrations in our dust samples. Identifying the sources of FTOHs in the dust is an important issue. Previous studies have detected FTOHs in durable water repellant clothing,61 so it is possible that firefighting turnout gear or other textiles are contributing FTOHs to indoor dust. Additionally, we detected FTOHs at significantly higher levels in samples with greater amounts of carpeting (Figure S5), suggesting that carpeting may be a source of FTOHs. FTOHs are used to treat paper and textiles and have been found at high levels in carpets, textiles, and waterproofing and cleaning agents.5, 57 6:2, 8:2, and 10:2 FTOH have been found in impregnating agents and some AFFF.62 Notably current commercial mixtures of AFFF contain 6:2 FTOH and 8:2 FTOH while AFFF produced before 2010 did not.62 Fluorotelomer alcohols are also used in the synthesis of fluorotelomer-based products, and some estimate that residual FTOHs may remain in those products at about 2% by weight.63 Fluorotelomer-based products (FTOHs and PAPs) are thought to be indirect sources of PFCAs in the environment through several means, namely by product degradation, by PFCA impurities, or through fluorotelomer-based AFFF.63 There is also evidence that atmospheric degradation of 8:2 FTOH and other FTOHs are a source for global PFCA pollution.64–65
The dust concentrations reported in this present study show that FTOHs and diPAPs are abundant in residential dust and thus have the potential to lead to PFAA exposure. Additionally, the maximum values we report for the FTOHs, diPAPs, FOSEs, and PFOS were orders of magnitude higher than the median concentrations, indicating greater exposure potential for some residents and fire fighters. Differentiating sources of PFAS in dust should also be explored in more depth in future studies. Comparing the relative amounts of different PFAS sub-classes or branched vs. linear isomers66 could give better insight into which sources of PFAS are most contributive. More research is needed to understand the links between PFAA precursors in indoor environments and their contribution to PFAS in dust, and how this relates to overall PFAS exposure in people.
Supplementary Material
ACKNOWLEDGMENTS:
The authors would like to acknowledge all the research participants and fire fighters who provided dust samples and filled out questionnaires. The authors would like to thank colleagues at Duke University for their help in collecting, preparing, and analyzing dust samples (Dr. Stephanie Hammel, Amelia Lorenzo, Albert Chen, and George Tait) and at the California Department of Toxic Substances Control for preparing the fire station dust sub-samples (Dr. Darcy Tarrant and Joginder Dhaliwal). We thank Dr. Mark Strynar and Dr. Andrew Lindstrom for generously providing their house dust data for our supplemental analyses on dust concentrations over time. The views expressed here are those of the authors and not necessarily those of the California Department of Toxic Substances Control (DTSC). This research was supported by grants from the National Institute of Environmental Health Sciences (R01 ES016099) and the United States Environmental Protection Agency (Grant 83564201). Additional support for SMH was provided by NIEHS (T32-ES021432). Funding was also provided by the Michael and Annie Falk Foundation, and logistical support for the fire fighter study was provided by the International Association of Fire Fighters (IAFF).
Footnotes
DISCLOSURES:
The authors declare no competing financial interest.
SUPPORTING INFORMATION:
The Supporting Information is available free of charge at http://pubs.acs.org.
Additional methods, tables, figures, and references (DOCX)
REFERENCES
- 1.OECD, Toward a new comprehensive global database of per- and polyfluoroalkyl substances (PFASs). 2018.
- 2.Wang Z; DeWitt JC; Higgins CP; Cousins IT, A never-ending story of per- and polyfluoroalkyl substances (PFASs)? Environ. Sci. Technol 2017, 51 (5), 2508–2518; DOI: 10.1021/acs.est.6b04806 [DOI] [PubMed] [Google Scholar]
- 3.Buck RC; Franklin J; Berger U; Conder JM; Cousins IT; de Voogt P; Jensen AA; Kannan K; Mabury SA; van Leeuwen SP, Perfluoroalkyl and polyfluoroalkyl substances in the environment: terminology, classification, and origins. Integr. Environ. Assess. Manag 2011, 7 (4), 513–41; DOI: 10.1002/ieam.258 [DOI] [PMC free article] [PubMed] [Google Scholar]
- 4.Sunderland EM; Hu XC; Dassuncao C; Tokranov AK; Wagner CC; Allen JG, A review of the pathways of human exposure to poly- and perfluoroalkyl substances (PFASs) and present understanding of health effects. J. Expo. Sci. Environ. Epidemiol 2019, 29 (2), 131–147; DOI: 10.1038/s41370-018-0094-1 [DOI] [PMC free article] [PubMed] [Google Scholar]
- 5.Kotthoff M; Muller J; Jurling H; Schlummer M; Fiedler D, Perfluoroalkyl and polyfluoroalkyl substances in consumer products. Environ. Sci. Pollut. Res 2015, 22 (19), 14546–59; DOI: 10.1007/s11356-015-4202-7 [DOI] [PMC free article] [PubMed] [Google Scholar]
- 6.Begley TH; White K; Honigfort P; Twaroski ML; Neches R; Walker RA, Perfluorochemicals: potential sources of and migration from food packaging. Food Addit. Contam 2005, 22 (10), 1023–31; DOI: 10.1080/02652030500183474 [DOI] [PubMed] [Google Scholar]
- 7.Trier X; Granby K; Christensen JH, Polyfluorinated surfactants (PFS) in paper and board coatings for food packaging. Environ. Sci. Pollut. Res 2011, 18 (7), 1108–20; DOI: 10.1007/s11356-010-0439-3 [DOI] [PubMed] [Google Scholar]
- 8.Schaider LA; Balan SA; Blum A; Andrews DQ; Strynar MJ; Dickinson ME; Lunderberg DM; Lang JR; Peaslee GF, Fluorinated Compounds in US Fast Food Packaging. Environ. Sci. Technol. Lett 2017, 4 (3), 105–111; DOI: 10.1021/acs.estlett.6b00435 [DOI] [PMC free article] [PubMed] [Google Scholar]
- 9.Fujii Y; Harada KH; Koizumi A, Occurrence of perfluorinated carboxylic acids (PFCAs) in personal care products and compounding agents. Chemosphere 2013, 93 (3), 538–44; DOI: 10.1016/j.chemosphere.2013.06.049 [DOI] [PubMed] [Google Scholar]
- 10.Fiedler S; Pfister G; Schramm K-W, Poly- and perfluorinated compounds in household consumer products. Toxicol. Environ. Chem 2010, 92 (10), 1801–1811; DOI: 10.1080/02772248.2010.491482 [DOI] [Google Scholar]
- 11.Chain E Panel o. C. i. t. F.; Schrenk D; Bignami; Bodin L; Chipman JK; del Mazo J; Grasl-Kraupp B; Hogstrand C; Hoogenboom L; Leblanc J-C; Nebbia CS; Nielsen E; Ntzani E; Petersen A; Sand S; Vleminckx C; Wallace H; Barregård L; Ceccatelli S; Cravedi J-P; Halldorsson TI; Haug LS; Johansson N; Knutsen HK; Rose M; Roudot A-C; Van Loveren H; Vollmer G; Mackay K; Riolo F; Schwerdtle T, Risk to human health related to the presence of perfluoroalkyl substances in food. EFSA Journal 2020, 18 (9), e06223; DOI: 10.2903/j.efsa.2020.6223 [DOI] [PMC free article] [PubMed] [Google Scholar]
- 12.Poothong S; Papadopoulou E; Padilla-Sanchez JA; Thomsen C; Haug LS, Multiple pathways of human exposure to poly- and perfluoroalkyl substances (PFASs): From external exposure to human blood. Environ. Int 2020, 134, 105244; DOI: 10.1016/j.envint.2019.105244 [DOI] [PubMed] [Google Scholar]
- 13.Stapleton HM; Eagle S; Sjodin A; Webster TF, Serum PBDEs in a North Carolina toddler cohort: associations with handwipes, house dust, and socioeconomic variables. Environ. Health Perspect 2012, 120 (7), 1049–1054; DOI: 10.1289/ehp.1104802 [DOI] [PMC free article] [PubMed] [Google Scholar]
- 14.D’Hollander W; Roosens L; Covaci A; Cornelis C; Reynders H; Campenhout KV; Voogt P; Bervoets L, Brominated flame retardants and perfluorinated compounds in indoor dust from homes and offices in Flanders, Belgium. Chemosphere 2010, 81 (4), 478–87; DOI: 10.1016/j.chemosphere.2010.07.043 [DOI] [PubMed] [Google Scholar]
- 15.Jones-Otazo HA; Clarke JP; Diamond ML; Archbold JA; Ferguson G; Harner T; Richardson GM; Ryan JJ; Wilford B, Is house dust the missing exposure pathway for PBDEs? An analysis of the urban fate and human exposure to PBDEs. Environ. Sci. Technol 2005, 39 (14), 5121–30; DOI: 10.1021/es048267b [DOI] [PubMed] [Google Scholar]
- 16.USEPA, Exposure Factors Handbook: 2011 Edition. Center N; Assessment, f. E., Eds. Washington, DC, 2011; pp 1–1436. [Google Scholar]
- 17.Winkens K; Giovanoulis G; Koponen J; Vestergren R; Berger U; Karvonen AM; Pekkanen J; Kiviranta H; Cousins IT, Perfluoroalkyl acids and their precursors in floor dust of children’s bedrooms - Implications for indoor exposure. Environ. Int 2018, 119, 493–502; DOI: 10.1016/j.envint.2018.06.009 [DOI] [PubMed] [Google Scholar]
- 18.Eriksson U; Karrman A, World-wide indoor exposure to polyfluoroalkyl phosphate esters (PAPs) and other PFASs in household dust. Environ. Sci. Technol 2015, 49 (24), 14503–11; DOI: 10.1021/acs.est.5b00679 [DOI] [PubMed] [Google Scholar]
- 19.Karaskova P; Venier M; Melymuk L; Becanova J; Vojta S; Prokes R; Diamond ML; Klanova J, Perfluorinated alkyl substances (PFASs) in household dust in Central Europe and North America. Environ. Int 2016, 94, 315–324; DOI: 10.1016/j.envint.2016.05.031 [DOI] [PubMed] [Google Scholar]
- 20.Shoeib T; Hassan Y; Rauert C; Harner T, Poly- and perfluoroalkyl substances (PFASs) in indoor dust and food packaging materials in Egypt: Trends in developed and developing countries. Chemosphere 2016, 144, 1573–81; DOI: 10.1016/j.chemosphere.2015.08.066 [DOI] [PubMed] [Google Scholar]
- 21.Ao J; Yuan T; Xia H; Ma Y; Shen Z; Shi R; Tian Y; Zhang J; Ding W; Gao L; Zhao X; Yu X, Characteristic and human exposure risk assessment of per- and polyfluoroalkyl substances: A study based on indoor dust and drinking water in China. Environ. Pollut 2019, 254, 112873; DOI: 10.1016/j.envpol.2019.07.041 [DOI] [PubMed] [Google Scholar]
- 22.de la Torre A; Navarro I; Sanz P; Martinez MLA, Occurrence and human exposure assessment of perfluorinated substances in house dust from three European countries. Sci. Total Environ 2019, 685, 308–314; DOI: 10.1016/j.scitotenv.2019.05.463 [DOI] [PubMed] [Google Scholar]
- 23.Besis A; Botsaropoulou E; Samara C; Katsoyiannis A; Hanssen L; Huber S, Perfluoroalkyl substances (PFASs) in air-conditioner filter dust of indoor microenvironments in Greece: Implications for exposure. Ecotoxicol. Environ. Saf 2019, 183, 109559; DOI: 10.1016/j.ecoenv.2019.109559 [DOI] [PubMed] [Google Scholar]
- 24.Zheng G; Boor BE; Schreder E; Salamova A, Indoor exposure to per- and polyfluoroalkyl substances (PFAS) in the childcare environment. Environ. Pollut 2020, 258, 113714; DOI: 10.1016/j.envpol.2019.113714 [DOI] [PubMed] [Google Scholar]
- 25.Fraser AJ; Webster TF; Watkins DJ; Strynar MJ; Kato K; Calafat AM; Vieira VM; McClean MD, Polyfluorinated compounds in dust from homes, offices, and vehicles as predictors of concentrations in office workers’ serum. Environ. Int 2013, 60, 128–36; DOI: 10.1016/j.envint.2013.08.012 [DOI] [PMC free article] [PubMed] [Google Scholar]
- 26.Dobraca D; Israel L; McNeel S; Voss R; Wang M; Gajek R; Park J-S; Harwani S; Barley F; She J; Das R, Biomonitoring in California firefighters: metals and perfluorinated chemicals. J. Occup. Env. Med 2015, 57 (1), 88–97; DOI: 10.1097/JOM.0000000000000307 [DOI] [PMC free article] [PubMed] [Google Scholar]
- 27.Laitinen JA; Koponen J; Koikkalainen J; Kiviranta H, Firefighters’ exposure to perfluoroalkyl acids and 2-butoxyethanol present in firefighting foams. Toxicol. Lett 2014, 231 (2), 227–32; DOI: 10.1016/j.toxlet.2014.09.007 [DOI] [PubMed] [Google Scholar]
- 28.Tao L; Kannan K; Aldous KM; Mauer MP; Eadon GA, Biomonitoring of perfluorochemicals in plasma of New York State personnel responding to the World Trade Center disaster. Environ. Sci. Technol 2008, 42 (9), 3472–8; DOI: 10.1021/es8000079 [DOI] [PubMed] [Google Scholar]
- 29.Shaw SD; Berger ML; Harris JH; Yun SH; Wu Q; Liao C; Blum A; Stefani A; Kannan K, Persistent organic pollutants including polychlorinated and polybrominated dibenzo-p-dioxins and dibenzofurans in firefighters from Northern California. Chemosphere 2013, 91 (10), 1386–1394; DOI: 10.1016/j.chemosphere.2012.12.070 [DOI] [PubMed] [Google Scholar]
- 30.Trowbridge J; Gerona RR; Lin T; Rudel RA; Bessonneau V; Buren H; Morello-Frosch R, Exposure to Perfluoroalkyl Substances in a Cohort of Women Firefighters and Office Workers in San Francisco. Environ. Sci. Technol 2020, 54 (6), 3363–3374; DOI: 10.1021/acs.est.9b05490 [DOI] [PMC free article] [PubMed] [Google Scholar]
- 31.Jin C; Sun Y; Islam A; Qian Y; Ducatman A, Perfluoroalkyl acids including perfluorooctane sulfonate and perfluorohexane sulfonate in firefighters. J. Occup. Env. Med 2011, 53 (3), 324–328; DOI: 10.1097/JOM.0b013e31820d1314 [DOI] [PubMed] [Google Scholar]
- 32.Rotander A; Toms LM; Aylward L; Kay M; Mueller JF, Elevated levels of PFOS and PFHxS in firefighters exposed to aqueous film forming foam (AFFF). Environ. Int 2015, 82, 28–34; DOI: 10.1016/j.envint.2015.05.005 [DOI] [PubMed] [Google Scholar]
- 33.Moody CA; Field JA, Perfluorinated Surfactants and the Environmental Implications of Their Use in Fire-Fighting Foams. Environ. Sci. Technol 2000, 34 (18), 3864–3870; DOI: 10.1021/es991359u [DOI] [Google Scholar]
- 34.McGuire ME; Schaefer C; Richards T; Backe WJ; Field JA; Houtz E; Sedlak DL; Guelfo JL; Wunsch A; Higgins CP, Evidence of remediation-induced alteration of subsurface poly- and perfluoroalkyl substance distribution at a former firefighter training area. Environ. Sci. Technol 2014, 48 (12), 6644–52; DOI: 10.1021/es5006187 [DOI] [PubMed] [Google Scholar]
- 35.Peaslee GF; Wilkinson JT; McGuinness SR; Tighe M; Caterisano N; Lee S; Gonzales A; Roddy M; Mills S; Mitchell K, Another Pathway for Firefighter Exposure to Per- and Polyfluoroalkyl Substances: Firefighter Textiles. Environ. Sci. Technol. Lett 2020, 7 (8), 594–599; DOI: 10.1021/acs.estlett.0c00410 [DOI] [Google Scholar]
- 36.Hoffman K; Hammel SC; Phillips AL; Lorenzo AM; Chen A; Calafat AM; Ye X; Webster TF; Stapleton HM, Biomarkers of exposure to SVOCs in children and their demographic associations: The TESIE Study. Environ. Int 2018, 119, 26–36; DOI: 10.1016/j.envint.2018.06.007 [DOI] [PMC free article] [PubMed] [Google Scholar]
- 37.Hammel SC; Levasseur JL; Hoffman K; Phillips AL; Lorenzo AM; Calafat AM; Webster TF; Stapleton HM, Children’s exposure to phthalates and non-phthalate plasticizers in the home: The TESIE study. Environ. Int 2019, 132, 105061; DOI: 10.1016/j.envint.2019.105061 [DOI] [PMC free article] [PubMed] [Google Scholar]
- 38.Phillips AL; Hammel SC; Hoffman K; Lorenzo AM; Chen A; Webster TF; Stapleton HM, Children’s residential exposure to organophosphate ester flame retardants and plasticizers: Investigating exposure pathways in the TESIE study. Environ. Int 2018, 116, 176–185; DOI: 10.1016/j.envint.2018.04.013 [DOI] [PMC free article] [PubMed] [Google Scholar]
- 39.Shen B; Whitehead TP; Gill R; Dhaliwal J; Brown FR; Petreas M; Patton S; Hammond SK, Organophosphate flame retardants in dust collected from United States fire stations. Environ. Int 2018, 112, 41–48; DOI: 10.1016/j.envint.2017.12.009 [DOI] [PubMed] [Google Scholar]
- 40.Gill R; Hurley S; Brown R; Tarrant D; Dhaliwal J; Sarala R; Park J-S; Patton S; Petreas M, Polybrominated diphenyl ether and organophosphate flame retardants in Canadian Fire Station Dust. Chemosphere 2020, 253, 126669; DOI: 10.1016/j.chemosphere.2020.126669 [DOI] [PubMed] [Google Scholar]
- 41.Reiner JL; Blaine AC; Higgins CP; Huset C; Jenkins TM; Kwadijk CJ; Lange CC; Muir DC; Reagen WK; Rich C; Small JM; Strynar MJ; Washington JW; Yoo H; Keller JM, Polyfluorinated substances in abiotic standard reference materials. Anal. Bioanal. Chem 2015, 407 (11), 2975–83; DOI: 10.1007/s00216-013-7330-2 [DOI] [PubMed] [Google Scholar]
- 42.NIST, Standard Reference Material® 2585 Certificate of Analysis: Organic Contaminants in House Dust. National Institute of Standards & Technology: 2018; Vol. SRM 2585, pp 1–16. [Google Scholar]
- 43.Backe WJ; Day TC; Field JA, Zwitterionic, cationic, and anionic fluorinated chemicals in aqueous film forming foam formulations and groundwater from U.S. military bases by nonaqueous large-volume injection HPLC-MS/MS. Environ. Sci. Technol 2013, 47 (10), 5226–34; DOI: 10.1021/es3034999 [DOI] [PubMed] [Google Scholar]
- 44.Rotander A; Karrman A; Toms LM; Kay M; Mueller JF; Gomez Ramos MJ, Novel fluorinated surfactants tentatively identified in firefighters using liquid chromatography quadrupole time-of-flight tandem mass spectrometry and a case-control approach. Environ. Sci. Technol 2015, 49 (4), 2434–42; DOI: 10.1021/es503653n [DOI] [PubMed] [Google Scholar]
- 45.Barton KE; Starling AP; Higgins CP; McDonough CA; Calafat AM; Adgate JL, Sociodemographic and behavioral determinants of serum concentrations of per- and polyfluoroalkyl substances in a community highly exposed to aqueous film-forming foam contaminants in drinking water. Int. J. Hyg. Environ. Health 2020, 223 (1), 256–266; DOI: 10.1016/j.ijheh.2019.07.012 [DOI] [PMC free article] [PubMed] [Google Scholar]
- 46.Strynar MJ; Lindstrom AB, Perfluorinated compounds in house dust from Ohio and North Carolina, USA. Environ. Sci. Technol 2008, 42 (10), 3751–6; DOI: 10.1021/es7032058 [DOI] [PubMed] [Google Scholar]
- 47.Knobeloch L; Imm P; Anderson H, Perfluoroalkyl chemicals in vacuum cleaner dust from 39 Wisconsin homes. Chemosphere 2012, 88 (7), 779–83; DOI: 10.1016/j.chemosphere.2012.03.082 [DOI] [PubMed] [Google Scholar]
- 48.Huber S; Haug LS; Schlabach M, Per- and polyfluorinated compounds in house dust and indoor air from northern Norway - a pilot study. Chemosphere 2011, 84 (11), 1686–93; DOI: 10.1016/j.chemosphere.2011.04.075 [DOI] [PubMed] [Google Scholar]
- 49.Tian Z; Kim SK; Shoeib M; Oh JE; Park JE, Human exposure to per- and polyfluoroalkyl substances (PFASs) via house dust in Korea: Implication to exposure pathway. Sci. Total Environ 2016, 553, 266–275; DOI: 10.1016/j.scitotenv.2016.02.087 [DOI] [PubMed] [Google Scholar]
- 50.Goosey E; Harrad S, Perfluoroalkyl compounds in dust from Asian, Australian, European, and North American homes and UK cars, classrooms, and offices. Environ. Int 2011, 37 (1), 86–92; DOI: 10.1016/j.envint.2010.08.001 [DOI] [PubMed] [Google Scholar]
- 51.Haug LS; Huber S; Becher G; Thomsen C, Characterisation of human exposure pathways to perfluorinated compounds--comparing exposure estimates with biomarkers of exposure. Environ. Int 2011, 37 (4), 687–93; DOI: 10.1016/j.envint.2011.01.011 [DOI] [PubMed] [Google Scholar]
- 52.Harrad S; Goosey E; Desborough J; Abdallah MA; Roosens L; Covaci A, Dust from UK primary school classrooms and daycare centers: the significance of dust as a pathway of exposure of young U.K. children to brominated flame retardants and polychlorinated biphenyls. Environ. Sci. Technol 2010, 44 (11), 4198–202; DOI: 10.1021/es100750s [DOI] [PubMed] [Google Scholar]
- 53.Kato K; Calafat AM; Needham LL, Polyfluoroalkyl chemicals in house dust. Environ. Res 2009, 109 (5), 518–523; DOI: 10.1016/j.envres.2009.01.005 [DOI] [PubMed] [Google Scholar]
- 54.Ericson Jogsten I; Nadal M; van Bavel B; Lindstrom G; Domingo JL, Per- and polyfluorinated compounds (PFCs) in house dust and indoor air in Catalonia, Spain: implications for human exposure. Environ. Int 2012, 39 (1), 172–80; DOI: 10.1016/j.envint.2011.09.004 [DOI] [PubMed] [Google Scholar]
- 55.Kubwabo C; Stewart B; Zhu J; Marro L, Occurrence of perfluorosulfonates and other perfluorochemicals in dust from selected homes in the city of Ottawa, Canada. J. Environ. Monit 2005, 7 (11), 1074–1078; DOI: 10.1039/b507731c [DOI] [PubMed] [Google Scholar]
- 56.Shoeib M; Harner T; G MW; Lee SC, Indoor sources of poly- and perfluorinated compounds (PFCS) in Vancouver, Canada: implications for human exposure. Environ. Sci. Technol 2011, 45 (19), 7999–8005; DOI: 10.1021/es103562v [DOI] [PubMed] [Google Scholar]
- 57.Herzke D; Olsson E; Posner S, Perfluoroalkyl and polyfluoroalkyl substances (PFASs) in consumer products in Norway - a pilot study. Chemosphere 2012, 88 (8), 980–7; DOI: 10.1016/j.chemosphere.2012.03.035 [DOI] [PubMed] [Google Scholar]
- 58.Schultz MM; Barofsky DF; Field JA, Quantitative determination of fluorotelomer sulfonates in groundwater by LC MS/MS. Environ. Sci. Technol 2004, 38 (6), 1828–35; DOI: 10.1021/es035031j [DOI] [PubMed] [Google Scholar]
- 59.Mitro SD; Dodson RE; Singla V; Adamkiewicz G; Elmi AF; Tilly MK; Zota AR, Consumer Product Chemicals in Indoor Dust: A Quantitative Meta-analysis of U.S. Studies. Environ. Sci. Technol 2016, 50 (19), 10661–10672; DOI: 10.1021/acs.est.6b02023 [DOI] [PMC free article] [PubMed] [Google Scholar]
- 60.Trakumas S; Willeke K; Reponen T; Grinshpun SA; Friedman W, Comparison of Filter Bag, Cyclonic, and Wet Dust Collection Methods in Vacuum Cleaners. AIHAJ - American Industrial Hygiene Association 2001, 62 (5), 573–583; DOI: 10.1080/15298660108984656 [DOI] [PubMed] [Google Scholar]
- 61.van der Veen I; Hanning AC; Stare A; Leonards PEG; de Boer J; Weiss JM, The effect of weathering on per- and polyfluoroalkyl substances (PFASs) from durable water repellent (DWR) clothing. Chemosphere 2020, 249, 126100; DOI: 10.1016/j.chemosphere.2020.126100 [DOI] [PubMed] [Google Scholar]
- 62.Favreau P; Poncioni-Rothlisberger C; Place BJ; Bouchex-Bellomie H; Weber A; Tremp J; Field JA; Kohler M, Multianalyte profiling of per- and polyfluoroalkyl substances (PFASs) in liquid commercial products. Chemosphere 2017, 171, 491–501; DOI: 10.1016/j.chemosphere.2016.11.127 [DOI] [PubMed] [Google Scholar]
- 63.Prevedouros K; Cousins IT; Buck RC; Korzeniowski SH, Sources, fate and transport of perfluorocarboxylates. Environ. Sci. Technol 2006, 40 (1), 32–44; DOI: 10.1021/es0512475 [DOI] [PubMed] [Google Scholar]
- 64.Wallington TJ; Hurley MD; Xia J; Wuebbles DJ; Sillman S; Ito A; Penner JE; Ellis DA; Martin J; Mabury SA; Nielsen OJ; Sulbaek Andersen MP, Formation of C7F15COOH (PFOA) and other perfluorocarboxylic acids during the atmospheric oxidation of 8:2 fluorotelomer alcohol. Environ. Sci. Technol 2006, 40 (3), 924–30; DOI: 10.1021/es051858x [DOI] [PubMed] [Google Scholar]
- 65.Ellis DA; Martin JW; De Silva AO; Mabury SA; Hurley MD; Sulbaek Andersen MP; Wallington TJ, Degradation of fluorotelomer alcohols: a likely atmospheric source of perfluorinated carboxylic acids. Environ. Sci. Technol 2004, 38 (12), 3316–21; DOI: 10.1021/es049860w [DOI] [PubMed] [Google Scholar]
- 66.Beesoon S; Webster GM; Shoeib M; Harner T; Benskin JP; Martin JW, Isomer profiles of perfluorochemicals in matched maternal, cord, and house dust samples: manufacturing sources and transplacental transfer. Environ. Health Perspect 2011, 119 (11), 1659–64; DOI: 10.1289/ehp.1003265 [DOI] [PMC free article] [PubMed] [Google Scholar]
Associated Data
This section collects any data citations, data availability statements, or supplementary materials included in this article.