

Abstract
Background
Statistical analysis according to design features and objectives is essential to ensure the validity and reliability of the study findings and conclusions in biomedical research. Heterogeneity in reporting study design elements and conducting statistical analyses is often observed for the same study design and study objective in medical literatures. Sometimes, researchers face a lot of predicaments using appropriate statistical approaches highlighted by methodologists for a specific study design either due to lack of accessibility or understanding of statistical methods or unavailability of checklists related to design and analysis in a concise format. The purpose of this review is to provide the checklist of statistical analysis and methods in biomedical research (SAMBR) to applied researchers.
Recent findings
We initially identified the important steps of reporting design features that may influence the choice of statistical analysis in biomedical research and essential steps of data analysis of common studies. We subsequently searched for statistical approaches employed for each study design/study objective available in publications and other resources. Compilation of these steps produced SAMBR guidance document, which includes three parts. Applied researchers can use part (A) and part (B) of SAMBR to describe or evaluate research design features and quality of statistical analysis, respectively, in reviewing studies or designing protocols. Part (C) of SAMBR can be used to perform essential and preferred evidence‐based data analysis specific to study design and objective.
Conclusions
We believe that the statistical methods checklists may improve reporting of research design, standardize methodological practices, and promote consistent application of statistical approaches, thus improving the quality of research studies. The checklists do not enforce the use of suggested statistical methods but rather highlight and encourage to conduct the best statistical practices. There is a need to develop an interactive web‐based application of the checklists for users for its wide applications.
Keywords: checklists, evidence‐based statistical practice, statistical analysis, statistical methods
1. INTRODUCTION
The overall quality and utility of biomedical research in generating proper evidence depend, in part, on the appropriate execution of research design, statistical methods, and interpretation of results and their quality reporting as well. Recently, a systematic review study identified nonadherence to standards of methodological approaches required by the Agency for Healthcare Research and Quality for research based on the National Inpatient Sample database even in high‐quality publications.1 It is found that the appropriate use of methods and their standardized reporting helps in improving the quality of studies.2 However, inconsistencies exist in methodological practices for similar study designs with the same objective/hypothesis. As a result, the quality of methodological standards in biomedical studies is often incredulous.
Guidelines and recommendations exist for assessing the quality of a study, or appropriate reporting and interpretation of results (www.equator‐network.org). Similarly, numerous statistical guidelines were developed for biomedical researchers to minimize misconduct of statistical approaches and improve the quality of biomedical studies.3, 4, 5, 6 However, these statistical guidelines mainly focus on improving the reporting of statistical methods used in studies. Unfortunately, guidance support is nonexistent for assessing best statistical practices of different types of studies as per the design features. Due to the lack of methodological standards checklist, misuse and abuse of statistical approaches in biomedical research have been noticed for a long time.7, 8
In recent years, novel statistical methods, computational program codes to analyze the complex problems, and statistical software for the ease of application of statistical methods and reporting have grown substantially. Numerous studies proposed alternative efficient and accurate approaches for specific study designs or distributional conditions and provided up‐to‐date statistical methods by comparing their performance on real data and extensive simulation studies.9, 10 However, the use of state‐of‐the‐art appropriate statistical methods for design and analysis of research studies is minimal in practice due to a lack of guidance for applied statisticians and applied researchers as recognized in the strengthening analytical thinking for observational studies (STRATOS).11 For example, predictive intervals are computed and reported rarely in published meta‐analysis,12, 13 risk ratio models are rarely being used for the analysis of cross‐sectional or interventional studies even in high impact clinical journals,14, 15, 16 inappropriate use and presentation of statistical modeling depending on the objective of the model building is common in published works,17 inappropriate uses of graphs in animal studies and inappropriate interpretations of the results have also been noticed in biomedical studies as well.18 Such examples and many more like these demonstrate that the use of appropriate statistical methods, accurate interpretations of results, and their reporting are not according to evidence‐based statistical methods and analysis. Thus, there is a need to develop checklists for evaluating the quality of statistical practices and a guidance document for promoting evidence‐based statistical analysis.
2. AIMS OF THE SAMBR
In the era of reproducible research, to increase the reproducibility, validity, and integrity of the research findings, we suggest following evidence‐based statistical practices in publications by use of appropriate statistical methods and their reporting relevant for specific objectives. Specifically, we (a) summarize the reporting elements of design features in studies to determine appropriate statistical analysis, (b) develop essential steps to be conducted in data analysis of common studies for promoting best statistical practices, and (c) provide evidence‐based essential and preferred choices of statistical methods for data analysis in different studies. Overall, the intention of the review is to provide checklists of statistical analysis and methods in biomedical research (SAMBR) according to specific objectives in different studies.
3. DEVELOPMENT OF THE CHECKLISTS
Initially, we identified the purpose and objectives of commonly employed study designs such as clinical trials, observational studies, and laboratory studies in biomedical research through various resources that may influence the choice of statistical analysis in studies. We also identified the essential steps to be followed in common studies to evaluate adherence to the best statistical practice in biomedical research. State‐of‐the‐art available statistical methods were identified for analyses (both unadjusted and adjusted and sensitivity) and reporting from high‐quality publications of biostatistics/epidemiology journals and other resources. The identified statistical methods were classified and linked with study designs and study objectives. When a clear choice did not exist, the decision was based on the qualitative evaluation of the statistical methods by comparing with other competing approaches in terms of statistical properties, assumptions, interpretation, and recommendations suggested by the researchers. The essential and preferred statistical procedures and appropriate references for employing each statistical method were provided under each study design and objective. Altogether, these procedures set the checklists for evidence‐based statistical analysis and their reporting for a specific study design in view of study purpose and objectives. Figure 1 shows the components of SAMBR and provides navigation to appropriate SAMBR checklist table as per study design and objective. Figure 2 summarizes the essential steps of data analysis according to common study designs/objectives.
Figure 1.
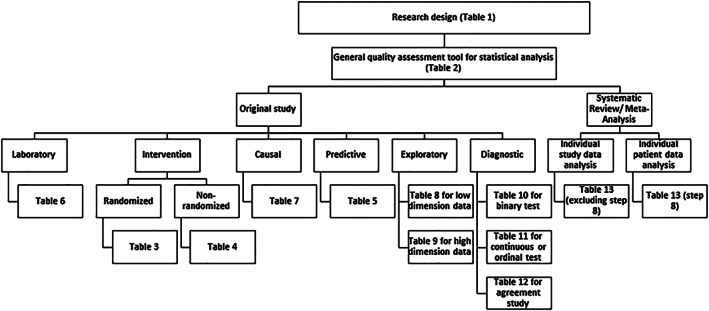
Flow chart for selecting the appropriate checklist table specific to study design and objective
Figure 2.
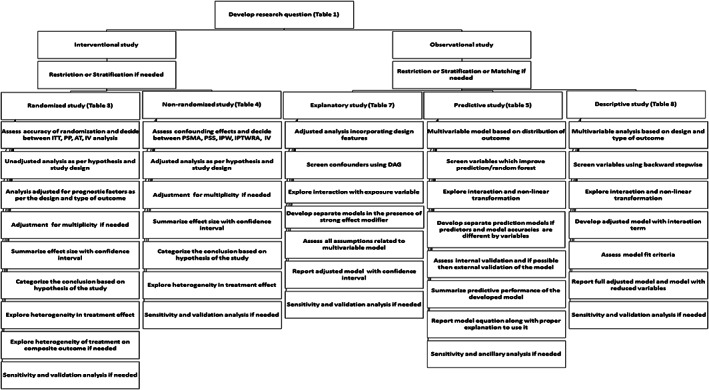
Flow diagram of checklists for common clinical studies. ITT, intention to treat analysis; PP, per protocol analysis; AT, as treated analysis; IV, instrument variable analysis; PSMA, propensity score matched analysis; PSS, propensity score stratified analysis; IPTW, inverse probability treatment weight analysis; IPTWRA, doubly robust inverse probability treatment weight and regression adjustment analysis; IV, instrument variable analysis; DAG, directed acyclic graph
4. COMPONENTS OF SAMBR
The SAMBR checklists have three parts as follows: Part (A) focuses on the reporting elements of common biomedical research designs, part (B) shows the essential steps to be followed in common studies for quality assessment of statistical analysis, and part (C) comprises the steps for data analysis and related essential and preferred choices of statistical approaches and methods for statistical analysis strictly linked to the type of research design and study objectives.
4.1. Part A: Research design
The items related to part (A) are displayed in Table 1. Table 1 may help the investigators to describe the essential features of their study design and objectives of the study. The detail provided in Table 1 along with study setting, study population, eligibility criteria, and data collection procedures and methods can be used to develop materials and methods section of a study protocol.
Table 1.
Reporting elements for research design
| Item | Step | Suggested Method |
|---|---|---|
| 1 | Specify the clinical/biomedical purpose of the study | (a) Therapeutic, (b) diagnostic, (c) predictive, (d) etiologic, (e) exploratory/descriptive |
| 2 | Specify the study‐design type | (a) Laboratory‐based experimental study; (b) intervention trial (standard randomized design, community randomized, patients randomized within clusters, quasi randomized‐interventional); (c) nonrandomized interventional study (pre‐post, repeated measures, cohort); (d) observational descriptive study (case report, case series, correlation/ecologic study, prevalence, incidence); (e) matched or unmatched observational analytic study (cross‐sectional, case–control, cohort, nested case–control, case‐cohort, longitudinal); (f) review study (narrative, mapping evidence, scoping, systematic, meta‐analysis) |
| 3 | If interventional/nonrandomized interventional study, specify the primary hypothesis | (a) Superiority, (b) noninferiority, (c) equivalence, (d) simultaneous hypothesis of superiority, noninferiority, and equivalence |
| 4 | If a laboratory‐based experimental study, specify research design | (a) Unmatched experimental study, (b) matched experimental study, (c) randomized optimal design study |
| 5 | If an observational study, specify the primary and secondary purpose of the study | (a) Estimation, (b) inferential/causal association, (c) prognostic/explanatory/risk factors, (d) predictive, (e) exploratory/descriptive |
| 6 | If a diagnostic study, specify the primary and secondary purpose of the study | (a) Diagnostic accuracy, (b) cut off determination, (c) comparisons, (d) risk tool calculator/predictive model, (e) agreement |
| 7 | Define the primary and secondary outcomes, independent variables and their types (quantitative, count, binary, polychotomous, ordinal, time to event) | (a) List of outcomes /endpoints /responses/predictive/dependents); (b) exposures (only for observational inferential study); (c) intervention (treatment or experimental or test variable only for interventional study) (c) predictors (independent variables for predictive/prognostic study); (d) risk factors (for prognostic or explanatory studies); (e) factors (covariates, cofactors, and explanatory variables for descriptive/exploratory study) |
| 8 | Summarize research question specific to study design and objectives | (a) PICOT—patient/population, intervention, comparative group, outcome, and time (optional) (interventional study); (b) POSE—patient/population, outcome, study design and exposure or explanatory variables (observational inferential study); (c) PORS—patient/population, outcome, risk factors, and study design (observational prognostic study); (d) POSP—patient/population, outcome, study design and predictors (predictive study); (e) POST—patient/population, outcome/reference test, study design and test variable (diagnostic study) |
| 9 | Sample size determination and reporting | (a) Compute sample size based on simulations and inputs from previously published studies with references; (b) study design conditions for computing sample size; (c) minimum clinical effect if required, the proposed level of significance, power, and other unforeseen adjustments (loss to follow up, number of covariates adjustment and number of outcomes tested etc) used in computing sample size; (d) statistical test with assumptions considered in computations and it should be used for primary statistical analysis; (e) sample size software |
| 10 | Develop statistical analysis plan | (a) Descriptive/summary statistics; (b) preliminary analysis (testing for assumptions, transformation needed, modifying variables); (c) unadjusted/bivariate/univariable analysis; (d) multivariable analysis; (e) sensitivity/ancillary analysis for model diagnostics and robustness of findings; (f) validation/heterogeneity analysis for validating conclusions; (g) reporting statistics/effect size for various analyses; (h) software used and graphs |
4.2. Part B: General quality assessment tool for statistical analysis in common studies
Table 2 provides a tool to assess the quality of methodological standards in published studies. Our review identified 10 essential steps to be followed in data analysis and reporting for any common studies. Each of the 10 steps may be rated into no/low, medium, high adherence, or not applicable. The maximum number of items rated into moderate or high would indicate the good or excellent quality of the statistical analysis.
Table 2.
Statistical analysis and methods in biomedical research (SAMBR) checklist for assessing data analysis practice in biomedical studies
| Item | Checklist | Example | Rating (Low or Medium or High Adherence or Not Applicable) |
|---|---|---|---|
| 1 | Were statistical analyses conducted according to study design, objective, and hypothesis? | Paired/unpaired data analysis/predictive/inferential model | |
| 2 | Were evidence‐guided primary statistical methods used? | Parametric/semiparametric/nonparametric analysis/appropriate statistical models | |
| 3 | Were efforts made to assess confounding effects or screen important variables as per the objective of the statistical model? | Full/automatic selected multivariable model | |
| 4 | Did multivariable model include confounders, interactions, and predictors of the outcome? | Separate models/single model with or without effect modifiers | |
| 5 | Were assessments made for stability, validity, and robustness of the multivariable model? | Model assumptions and diagnostics | |
| 6 | Was an adjustment made for the multiplicity of outcomes if objective requires? | Separate models with or without adjusted P values/joint models | |
| 7 | Was reporting of statistical findings followed statistical models used, design, and the objective of the study? | Relative risk/odds ratio/change in means/mean difference | |
| 8 | Were some reproducibility measures used to assess the robustness of the findings? | Confidence interval and sensitivity analysis based on design features and definitions of exposure/outcome | |
| 9 | Were some reproducibility measures used to assess the generalizability of the findings? | Alternative of P values/external validation/subgroup/heterogeneity analysis | |
| 10 | Was interpretation of the results made in view of study design, limitations, and methods used for data analysis? | Significant/not significant/conclusive/nonconclusive |
The explanation and use of each of the 10 steps in statistical analysis and reporting in biomedical studies are described in the following subsections:
4.2.1. Statistical analysis in view of study design, objective, and hypothesis
The choice of statistical methods and steps in data analysis is heavily linked with the study design features. The statistical analysis depends on study design type (randomized clinical trial [RCT], nonrandomized clinical trial [NRCT], and observational study), study design methods (matched study, two groups pre‐post study, cross‐over study, repeated measures study, etc), study hypothesis (superiority, non‐inferiority, equivalence), study purpose (inferential, predictive, or descriptive study), and type of outcome. RCTs mostly require adjustment of prognostic variables while observational studies require adjustment of confounding variables in multivariable analysis. Matched studies typically require paired data analysis compared with unmatched studies. The selection of screening variables in a multivariable model depends on the purpose of the multivariable model. The choice of statistical test used and design conditions (sampling design, level of significance, etc) applied in computing sample size and statistical power should be accounted for in primary data analysis. The research characteristics that may affect the choice of statistical analysis should be clearly described in research studies or publications.
4.2.2. Evidence‐based statistical methods
Variety of statistical tests with varying efficiencies are available for data analysis of a specific problem. Methodologists have been continuously making efforts to prioritize statistical methods in terms of their efficiency and power for their proper use, interpretation, and reporting in statistical analysis and results. The continuous growth in the development of advanced statistical methods suggests the use of evidence‐based state‐of‐the‐art statistical methods in data analysis. Superior statistical methods according to sample size and distributions of outcome and independent variables in the literature should be preferred for data analysis.
4.2.3. Eliminate known and unknown confounding effects or screen important variables that predict the outcome
In association studies, the efforts should be made for reducing confounding effects either at the designing phase through randomization, matching, restriction, stratification or at analysis phase through multivariable regression analysis or propensity score data analysis. In prediction studies, proper selection of variables is required for developing a parsimonious model. The use and reporting of statistical analysis should properly reflect such efforts.
4.2.4. Multivariable analysis for any studies by including factors that might confound or interact or predict the outcome
Exploration of interaction effect and inclusion of confounding or prognostic variables are mostly required in data analysis through multivariable regression analysis.
4.2.5. Assessment of the stability, validity, and robustness of the multivariable model
In inferential and descriptive models, the assessment of assumptions related to multivariable model and the stability of the developed model are critically important to draw appropriate inference while the selection of appropriate regression analysis in view of outcome distribution and the assessment of the validity of the developed model is critically important in predictive models.
4.2.6. Adjustment for the multiplicity of outcomes
Adjustment for the multiplicity of outcomes may be applied for studies with multiple outcomes in inferential and descriptive studies.
4.2.7. Reproducibility measures for statistical methods
The study should provide sufficient detail for statistical procedures as required by study objectives and study design. The study should also justify the robustness of statistical methods in view of study design features using evidence‐based statistical analysis and reporting practice. The presentation of study results should be based on used statistical methods, design, and objectives of the study.
4.2.8. Reproducibility measures for results
The study should provide some reproducibility measures for results by reporting the confidence interval, internal validity, and robustness of the findings using sensitivity and validation analysis.
4.2.9. Reproducibility measures for inference
The study should provide some reproducibility measures for inference by reporting predictive interval, external validation of the estimate/effect/prediction, heterogeneity analysis, or alternatives of the P value19 as appropriate to ensure generalizability and accuracy of the inference made in the study.
4.2.10. Interpret the results in view of study design, limitations, and methods used for data analysis
The interpretation of study findings, its generalizability, and limitations should be made in view of study design features and statistical analysis after evaluating study setting, population, nature of the data, and accuracy of the results. Accordingly, the classification of significant or nonsignificant or conclusive or inconclusive findings should be made in the study.
4.3. Part C: Evidence‐based statistical analysis and methods as per study design and objective
Part (C) of the SAMBR is the extension of part (B) linking to statistical methods according to specific design and objectives. The choices of statistical procedures and their reporting are shown in Table 3 for an RCT. This table suggests that statistical analysis of an RCT should be according to a specific hypothesis and sub‐design of the study. Table 4 shows statistical procedures and evidence‐based suggested and preferred methods for NRCT. The statistical analysis of a nonrandomized study should demonstrate appropriate attempts to minimize known and unknown effects of confounding factors. Table 5 displays the steps involved in analyzing predictive studies and related statistical approaches. This table suggests that the appropriate selection of a model based on the distribution of outcome, the appropriate link function, and form of covariates and screening of important variables for predicting outcome are the most important steps in data analysis of a predictive model study. In the predictive model, statistical approaches should provide ample evidence to demonstrate external validity of the developed model. Table 6 describes the suggested methods for laboratory study. Statistical approaches for analysis of small sample size studies, paired or unpaired structure of data, adjustment for multiple comparisons, and appropriate reporting of experimental data are critical for fundamental studies. Table 7 shows the statistical procedures required for an inferential study. The statistical procedure involving all study design elements, their rigorousness, and model diagnostics are the most important steps in producing reliable inference from an inferential study.
Table 3.
Interventional randomized study
| Item | Step | Essential Method | Preferred Method |
|---|---|---|---|
| 1 | Appropriateness of randomization | Use appropriate parametric or nonparametric exact tests and decide between ITT and PPA | Assess accuracy of randomization and decide between ITT, PPA, AT, IV analysis20 |
| 2 | Unadjusted analysis in view of the study hypothesis |
Apply appropriate parametric or nonparametric tests depending on the design (unpaired/paired/repeated measures) For superiority trial: (a) intention‐to‐treat using resampling approaches or exact tests with a two‐sided test9; (b) apply adjustment for multiple comparisons as suggested in Table 5 (step 3) if required For noninferiority trial: (a) per protocol analysis using one‐sided student's t test for a quantitative outcome; (b) Farrington‐Manning score tests for testing risk difference or relative risk33; (c) for risk difference and number‐needed‐to‐treat (NNT) use Newcombe hybrid score or Agresti‐Caffo intervals (adjusted Wald method) or Agresti‐Min method (especially for sample size ≤30 per group) for unpaired or paired proportions34 For equivalence trial: (a) Schuirmann's two one‐sided tests for a quantitative outcome; (b) Farrington‐Manning score tests for testing risk difference or relative risk33 |
Apply simultaneous testing of superiority, inferiority, and equivalence if possible using three‐sided testing after controlling for multiple testing.35 Prefer testing of interval null hypotheses if possible using second generation P value36 |
| 3 | Adjusted analysis | (a) Adjust prognostic factors irrespective of their significance between groups37; (b) apply analysis of covariance (ANCOVA) considering either post outcome or change between pre‐outcome and postoutcome for a quantitative outcome38; (c) use relative risk for binary15 or hazards regression models for time‐to‐event outcome | (a) Apply population average model using generalized estimating equations (GEE)39; (b) for small sample sizes or a small number of clusters (≤30) or with missing data, apply linear/generalized mixed effects model when distributional assumptions are met40 |
| 4 | Adjustment for multiplicity if needed | Use Hochberg or Hommel methods for mildly correlated outcomes otherwise apply step‐down minP method for highly correlated outcomes41 | Compute adjusted 95% CIs in case of multiple endpoints and when all endpoints are not significant5 |
| 5 | Effect sizes from unadjusted and adjusted analyses | Report the effect size on both absolute and relative scales with 95% CI and exact P value42 | (a) Use appropriate time‐to‐event model to estimate risk difference, number‐needed‐to‐treat (NNT) and years‐needed‐to‐treat (YNT)43; (b) compute relative risk (RR), relative risk reduction (RRR), and NNT using a logistic regression model with bootstrap‐based confidence intervals44 |
| 6 | Categorization of conclusion | Conclude superiority, inferiority, noninferiority or equivalence or inconclusiveness by comparing the minimum clinically significant effect | Classify finding into certainly beneficial, probably beneficial, very likely trivial, unclear, possibly harmful and very likely harmful45 |
| 7 | Heterogeneity in treatment effect | Conduct pre‐specified subgroup analysis | Use multivariable risk model or latent profile analysis46, 47 |
| 8 | Heterogeneity of treatment on the composite outcome if needed | Analyze each outcome data separately as well using an appropriate multivariable model | (a) For a binary outcome, assess treatment heterogeneity using GEE48; (b) random effects frailty models or marginal models for time‐to‐event outcomes49 |
| 9 | Sensitivity and validation analysis if possible | Evaluate worst case scenario, model‐related assumptions if required, missing imputations analysis, sub‐group analysis, analysis as per intervention and outcome definitions |
Abbreviations: AT, as treated analysis; ITT, intention to treat analysis; IV, instrument variable analysis; PPA, per protocol analysis.
Table 4.
Nonrandomized intervention study
| Item | Step | Essential Method | Preferred Method |
|---|---|---|---|
| 1 | Alternative method of randomization | (a) Use restriction, stratification, or matching techniques at the designing stage of the study; (b) assess confounding effects using appropriate parametric or nonparametric exact tests; (c) apply covariate adjustment via an appropriate regression model | (a) Assess confounding effects and decide between PSMA, PSS, IPTW, IPTWRA, or IV28; (b) apply inverse probability of treatment weighting (IPTW) or matching using the propensity score method to estimate treatment effect29; (c) prefer adjusting the unmeasured confounding effects through instrument variables by using two‐stage least squares approach30 |
| 2 | Model diagnostics | Assess multivariable model related assumptions | Apply appropriate data analysis by including confounding variables and prognostically important variables for the propensity score model, assess model assumptions and IPTW diagnostics31 |
| 3 | Effect size | Report adjusted effect size along with 95% CI | Use the bootstrap procedure to estimate the standard error and construct 95% CI of the estimated treatment effect if the propensity score method is used32 |
| 4 | Follow other steps (4‐9) from Table 3 |
Abbreviations: IV, instrument variable analysis; IPTW, inverse probability treatment weight analysis; IPTWRA, doubly robust inverse probability treatment weight and regression adjustment analysis; PSMA, propensity score matched analysis; PSS, propensity score stratified analysis.
Table 5.
Observational predictive study for diagnosis or prognosis
| Item | Step | Essential Method | Preferred Method |
|---|---|---|---|
| 1 | Missing data | Conduct complete case analysis | Use multiple imputations for missing data and Rubin's rules to combine the estimates from multiple imputed datasets21 |
| 2 | Multivariable model depending on the type and distribution of the outcome | Use appropriate generalized linear regression model or generalized mixed effects model or survival model including competing risk model depending on the type and distribution of outcome22 | Perform a nonlinear or nonparametric or mixed parametric model which predicts best distribution of outcome |
| 3 | Screen variables required for predictive model | (a) Backward elimination method,23; (b) include variables which improve prediction | Random forest method to select the most appropriate predictors for the model24 |
| 4 | Functions of quantitative variables | Use appropriate transformation to improve prediction | Explore nonlinear relationship to improve prediction using multivariable fractional polynomials (MFP) models for developing a regression model23 |
| 5 | Interactions | Develop and present separate predictive models in the presence of a strong interacting variable with multiple predictors | |
| 6 | Internal validation of the model | Perform random split‐sample method | Use the bootstrap method or K‐fold cross‐validation method25 |
| 7 | Predictive performance | Report overall prediction performance indices (Akaike information criteria [AIC] or mean square prediction error or area under the curve/c‐statistic) |
Summarize predictive performance using the following indices: (a) overall prediction (Akaike information criteria (AIC), mean square prediction error); (b) calibration (correct classification rate, calibration slope, Hosmer Lemeshow test); (c) discrimination (area under the curve [or c‐statistic]), reclassification (net reclassification index, integrated discrimination index); and (d) clinical usefulness (net benefit, decision curve analysis) for both derivation and validation datasets25 |
| 8 | External validation of the model if possible | Temporal validation method (nonrandom split‐sample method)22 | Use geographical or domain validation method22 |
| 9 | Predictive model equation | Report necessary elements (regression coefficient for each variable and their form, baseline hazards of survival function at a given time, Kaplan Meier curve) so that user can utilize published model for prediction and validation26 | (a) Provide points‐based or risk tool along with nomogram or web‐calculator27; (b) validate the points‐based or risk tool and report statistics as reported in steps 6 and 7 of Table 4 |
| 10 | Ancillary analysis if needed | Missing imputed case analysis, alternative multivariable models, etc |
Note. Internal validation refers to assessing model performances by the random splitting of study sample data into test/development/derivation dataset and validation dataset while external validation refers to assessing model performances by either nonrandom split of study sample data into test/development dataset and validation dataset or on independent datasets in different settings from the study sample.
Table 6.
Laboratory study
| Item | Step | Essential Method | Preferred Method |
|---|---|---|---|
| 1 | Unadjusted analysis | Use appropriate parametric on original or log transformed data or nonparametric exact tests | Use resampling approaches such as bootstrap or permutation tests for a quantitative outcome for small sample size studies requiring less or no assumption or nonparametric approaches for categorical outcome between groups for paired or unpaired experimental designs9 |
| 2 | Unadjusted effect size | Report effect sizes along with 95% CIs for primary outcomes using standard tests. | (a) For risk difference, use Newcombe hybrid score or Agresti‐Caffo intervals (adjusted Wald method)50 or Agresti‐Min method (especially for sample size ≤30 per group) for unpaired or paired proportions34; (b) for quantitative outcome, determine bootstrap based 95% CI |
| 3 | Multiple comparisons testing of a single outcome | Apply Bonferroni or Tukey's multiple corrections in post hoc analysis | (a) Tukey's honestly significance difference for pairwise comparisons; (b) Sidak‐Bonferroni for a small number of groups; (c) Dunnett's test for experimental groups compared to a control group; (d) Scheffe's procedure for a broad range of tests51 |
| 4 | Adjusted analysis if needed | Apply appropriate multiple regression analysis depending on the type of outcome | (a) General linear model for normal nonclustered data; (b) linear mixed model for analyzing normal quantitative clustered data; (c) rank sum method of non‐normal quantitative cluster data52; (d) generalized mixed effects model for categorized or count outcome repeated data53; (e) Cox model for time‐to‐event data |
| 5 | Adjustment for multiple primary outcomes in the same experiment | (a) Use Hochberg or Hommel methods for mildly correlated outcomes; (b) apply step‐down minP method for highly correlated outcomes41 | |
| 6 | Adjusted effect size if possible | Report effect sizes with 95% CIs and exact P values | |
| 7 | Graphical presentation | (a) Dot plots, scatter or box plots18; (b) stacked bar plot for ordinal data; (c) cluster bar for categorical data; (d) line plot for time‐dependent outcome; (e) scatter matrix/scatter plot for correlation between continuous data; (f) heat map for identifying patterns between categorical data; (g) Kaplan Meier curve for time‐to‐event data |
Abbreviation: CI: confidence interval.
Table 7.
Observational inferential/etiologic study
| Item | Step | Essential Method | Preferred Method |
|---|---|---|---|
| 1 | Multivariable model depending on the study design and type of outcome | (a) Use relative risk model for binary outcome in a cross‐sectional/cohort study or odds ratio model for case–control study or ANCOVA for a quantitative outcome15, 38; (b) use the best model (Cox model, parametric hazards model, and accelerated failure time model) describing time‐to‐event data26 | |
| 2 | Design features in multivariable analysis | (a) Develop multivariable model adjusting for clustering effect or survey structure of data if required; (b) use adjusted appropriate regression analysis for a matched case–control study after adjusting for matching variables using a standard (unconditional) analysis instead of matched (conditional) analysis54; (c) if there are confounders addition to matching variables in a matched cohort study, apply adjusted regression analysis after adjusting for matching variables and additional confounders. In the absence of additional confounders, no need to adjust for matching variables in the analysis55 | (a) Apply GEE for evaluating the average effect of exposure on a longitudinal outcome otherwise, apply random effects model for evaluating the effect of exposure on the changes in outcome within subject when assumptions are met or missing data40; (b) use G‐estimation approach allowing for including time‐varying confounding effects for survival or binary outcomes while use a marginal structural model with inverse probability of treatment weighted estimation approach allowing for time‐varying confounding effects for continuous and count outcomes56 |
| 3 | Screen variables required for adjusted analysis | Use clinical knowledge, adjust for all theoretical confounders and empirical significant confounders at 20% level of significance from the unadjusted analysis | Use a directed acyclic graph in the multivariable regression analysis57 |
| 4 | Interaction with the exposure variable | Explore first order interaction effects with primary exposure using clinical knowledge and report separate models in the presence of strong effect modifiers | |
| 5 | Multivariable model diagnostics | Assess all assumptions related to the model, multicollinearity, residual analysis, distribution of the outcome, goodness of fit, Bayesian information criteria17 | |
| 6 | Adjusted model summary | Summarize final model with effect size, 95% CI and exact P value | |
| 7 | Conduct validation/sensitivity analysis if needed | Assess the study design characteristics (paired or unpaired analysis, specific sub‐populations analysis), missing data, assumptions related to the model, and exposure and outcome definitions on study results |
Abbreviations: ANCOVA, analysis of covariance; CI, confidence interval; GEE, generalized estimating equations.
Table 8 delineates the steps involved in the statistical analyses for descriptive or risk factors study. The choice of the appropriate model along with the intensive exploration of interacting variables and stability of the developed model are critical for descriptive studies. Table 9 displays the data analysis steps for an exploratory study especially with high dimensional data. The selection of variables in the final multivariable model along with the intensive exploration of interacting variables and stability of the developed model are critical for exploratory studies. Tables 10, 11, 12 show statistical analysis procedures for diagnostic studies as per objective and type of a reference test. The analysis of diagnostic studies should provide enough emphasis on developing simple, robust, and user‐friendly tool for screening and diagnosing the problem. Table 13 provides methods for meta‐analysis studies according to the number of studies and heterogeneity across studies. The statistical procedure should provide ample evidence to minimize various sources of biases in obtaining a pooled estimate from multiple studies.
Table 8.
Observational descriptive study
| Item | Step | Essential Method | Preferred Method |
|---|---|---|---|
| 1 | Multivariable regression model depending on the design and type of outcome | (a) Generalized linear model as per the type of outcome; (b) competing risk methods for competing endpoints58; (c) random effects model to evaluate the individual risk factors associated with binary or continuous outcome over time39; (d) appropriate random effects (multilevel) models to assess the effect of cluster level covariates on the outcome59 | |
| 2 | Screen variables required for adjusted analysis | Apply backward elimination method to select variables for multivariable modeling23 | |
| 3 | Functions of quantitative variables | Use appropriate transformation to induce linearity | Multivariable fractional polynomials (MFP) models for developing regression models23 without categorizing variables |
| 4 | Interaction effects | Explore interaction effects and report separate models in the presence of strong effect modifiers | Report the multivariable model with interaction effects if needed60 |
| 5 | Global model and model with reduced variables | Report final model with reduced variables | Report both models (global model adjusting for all variables irrespective of their significance level) and model with reduced variables as per variable selection criteria |
| 6 | Follow other steps (5 and 6) from Table 7 | Report R 2 and statistical significance of overall fit | |
| 7 | Validation/sensitivity analysis if needed | Conduct analysis according to study design characteristics (paired or unpaired analysis, specific sub‐populations analysis), missing data, assumptions related to the model, the stability of variable selection criteria by reporting relative bias conditional on selection measure,61 and outcome definitions |
Table 9.
Observational exploratory study for high dimensional data
| Item | Step | Essential Method | Preferred Method |
|---|---|---|---|
| 1 | Multivariable regression model depending on the type of outcome | (a) Develop a relative risk model for a binary outcome15; (b) apply population average model using GEE or multiple imputation‐GEE for clustered data62 | |
| 2 | Screen variables required for adjusted analysis | Conduct unadjusted regression analyses to select important variables for multivariable model | (a) Use variable cluster analysis for reducing dimension if required63; (b) use Least Absolute Shrinkage and Selection Operator (LASSO) or Elastic Net to select the most important risk factors associated with the outcome while imputed LASSO combined with random forest with LASSO is useful for variable selection with missing data and also assess events‐per‐variable criteria (1:15 rule)64 |
| 4 | Interaction effects | Explore all possible interactions and report the multivariable model with interaction effects if needed60 | A regression model with classification and regression tree (CART) and appropriate parametric regression analysis using a hybrid approach65 |
| 5 | Follow other steps (5 and 6) from Table 7 | Include reporting of R 2 and statistical significance of overall fit | |
| 6 | Validation/sensitivity analysis if needed | Provide any ancillary analysis to validate the robustness of the findings and stability of the multivariable models |
Abbreviation: GEE: generalized estimating equations.
Table 10.
Diagnostic accuracy or comparison study for binary tests in the presence of a binary reference test or an imperfect reference test
| Item | Step | Essential Method | Preferred Method |
|---|---|---|---|
| 1 | Diagnostic measures for each test in relation to a reference test | Report predictive values, sensitivity, and specificity of the test along with their 95% Cis6 | (a) Report likelihood ratio, diagnostic odds ratio along with their 95% CIs6; (b) compute number needed to diagnose and misdiagnose66 |
| 2 | Diagnostic measures for each test in relation to an imperfect reference test | Report positive proportion and negative proportion agreements with McNemar's test in presence of an imperfect test | (a) Use a composite reference standard method of analysis in the absence of a reference test6; (b) use imputation, correction method, latent class method or other types of evaluation depending on the reference standard situation67 |
| 3 | Confidence interval (CI) | Compute 95% CIs for the difference in paired proportions (sensitivities and specificities) using the adjusted Wald method50 | Compute 95% CI using Sterne's method for sample size (n < = 1000), and adjusted Wald method for sample size (n > 1000) with binomial distribution for the prevalent outcome and use Sterne's confidence interval with Poisson distribution for rare events68 |
| 5 | Multivariable regression analysis if required | (a) Evaluate the effect of the patient or environmental characteristics on the efficacy of test results using multinomial logistic regression69; (b) compare sensitivities, specificities, and predictive values between two or more tests using multinomial logistic regression approach with robust variance estimation or marginal model with robust variance approach by including patient or environmental characteristics in relation to a reference test69 | Determine spectrum effect from spectrum bias by modeling sensitivity, specificity using multinomial logistic regression with robust variance approach and likelihood ratios using Janssen's et al. method simultaneously69, 70 |
| 7 | Adjusted model summary if needed | Summarize final model with effect size, 95% CI and exact P value | |
| 8 | Validation and sensitivity analysis if possible | Perform any ancillary analysis to validate the robustness of the findings and stability of the diagnostic accuracy |
Abbreviation: CI: confidence interval.
Table 11.
Diagnostic accuracy or comparison study for continuous/ordinal diagnostic markers and predictive study
| Item | Step | Essential Method | Preferred Method |
|---|---|---|---|
| 1 | Unadjusted analysis | Use receiver operating characteristic curve (ROC) analysis | (a) Use receiver operating characteristic curve (ROC) for the balanced dataset; (b) use Precision‐Recall plot for imbalanced datasets71 |
| 2 | Adjusted analysis if needed | Determine ROC adjusted for important covariates or adjusted for covariates affecting the control selection if required72 | |
| 3 | Thresholds of a marker/test | Conduct and report cutoffs using ROC analysis | Conduct and report cutoffs using ROC analysis from (a) the cut off that maximizes the sensitivity of the test; (b) the cutoff that maximizes the specificity of the test; (c) likelihood ratio at the cutoff that maximizes Youden index; (d) the cutoff, which is determined using the method that includes the cost of correct and false diagnosis and prevalence73 |
| 4 | Model performance | Report the area under the curve along with 95% CI | Report the area under the curve along with 95% CI and partial area or average sensitivity for the clinically relevant range of false positives72 |
| 5 | Discrimination ability by adding other markers if needed | Use integrated discrimination improvement (IDI)22 | |
| 6 | Develop risk prediction model or risk score or calculator if possible | (a) Develop a risk calculator using an appropriate regression model(74; (b) follow steps 3–9 for the predictive model from Table 5; (c) assess the validity of the model or risk tool by creating random fluctuations in quantitative biomarkers or test values if required74 | |
| 7 | Comparison of model performance if needed | Compare ROC curves using either parametric or nonparametric methods75 | |
| 8 | Validation and sensitivity if needed | Perform any ancillary analysis to validate the robustness of the findings and stability of the diagnostic accuracy |
Abbreviation: CI: confidence interval.
Table 12.
Diagnostic agreement study
| Item | Step | Essential Method | Preferred Method |
|---|---|---|---|
| 1 | Agreement analysis as per the type of data between two raters | (a) Compute the level of agreement with 95% CI using Bland Altman method for two quantitative measures76; (b) apply Siegel and Castellan's Kappa for binary classifications of two raters77; (c) apply weighted Kappa agreement between two raters on an ordinal scale | (a) Compute and report three statistics for continuous measurements (a1) the concordance correlation coefficient (CCC) to measure agreement for a continuous measurement between two fixed observers,78 (a2) level of agreement with 95% CI using Bland Altman method for two quantitative measures,76 and (a3) conduct simple intraclass correlation for two fixed observers77; (b) apply both Siegel and Castellan's kappa and Byrt et al's kappa for binary classifications of two raters77; (c) apply weighted Kappa along with log linear modeling of agreement between two raters on an ordinal scale79 |
| 2 | Agreement analysis as per the type of data among multiple raters | (a) Compute Overall CCC for a continuous measurement among multiple fixed observers; (b) apply Fleiss's Kappa for binary classifications or ordinal classifications of multiple raters | (a) Overall CCC and mixed effects intraclass correlation to measure agreement for a continuous measurement among multiple fixed observers77; (b) apply Nelson and Edwards's ordinal generalized linear mixed model for binary classifications or ordinal classifications of multiple raters80 |
| 3 | Compare agreements if required | Apply weighted least squares method for comparison of correlated Kappa coefficients or intraclass Kappa coefficients on nominal classifications and weighted Kappa coefficients on ordinal classifications between two raters78 | |
| 4 | Validation and sensitivity if needed | Perform any ancillary analysis to validate the robustness of the findings |
Abbreviation: CI: confidence interval.
Table 13.
Meta‐analysis
| Item | Step | Essential Method | Preferred Method |
|---|---|---|---|
| 1 | Quality of each study | Apply Cochrane collaboration tool for randomized clinical trials, methodological index for nonrandomized studies, Newcastle Ottawa scale for case–control and cohort studies, and agency for health research and quality for cross‐sectional studies, Quality Assessment of Diagnostic Accuracy Studies‐2 tool for diagnostic studies and Systematic Review Centre for Laboratory animal Experimentation for animal studies81 | |
| 2 | Converting effect sizes | Include all studies where considered effect size can easily be computed using reported data or graphs to maximize the number of studies | Use methods of converting effect sizes for quantitative, categorical, survival, and repeated measures of outcomes82 |
| 3 | Pooled estimate according to the frequency of outcome in the absence or presence of low level heterogeneity across studies | Use fixed effect model or random effects model depending on the assumptions | (a) Use DerSimonian and Laird random effects model in the absence/low level of heterogeneity without rare events or for a continuous outcome83; (b) use fixed effect method proposed by Mantel–Haenszel or exact methods for rare events in the absence of heterogeneity and unbalanced group sizes within each study84; (c) use fixed effect method proposed by Peto (applicable for odds ratio only) for rare events in the absence of heterogeneity and balanced group sizes84 |
| 4 | Pooled estimate according to the type of outcome in the presence of heterogeneity across studies | Use DerSimonian and Laird random effects model | (a) Use Hartung‐Knapp‐Sidik‐Jonkman method for when the number of studies is small85; (b) use Paule and Mandel method along with the Q‐profile method for computing confidence interval in the presence of heterogeneity86; (c) use the restricted maximum likelihood estimator for continuous data86; (d) conduct and report 95% predictive interval along with confidence interval in case of random effects analysis12 |
| 5 | Categorize the conclusion | Report the significant or not significant association | Certainly beneficial, probably beneficial, very likely trivial, unclear, possibly harmful and very likely harmful for intervention studies45 |
| 6 | Internal bias | Use funnel plot and Begg's test to determine evidence of bias |
Apply all three approaches: (a) funnel plot and Begg's test to determine evidence of bias; (b) fail‐safe N method to determine the effect an artifact of bias (estimate of bias); (c) cumulative meta‐analysis to determine the threshold for restricting the analysis to larger studies (impact on conclusion)83 |
| 7 | Heterogeneity | Sub‐group analysis and sensitivity analysis based on sample size and research design characteristics (such as restricting analysis based on inclusion criteria of the studies, different definitions of exposure and outcomes, type of study designs, methods of data collections, etc) | Heterogeneity assessment using meta‐regression |
| 8 | Individual patient data‐meta‐analysis (IPD‐MA) if possible | Analyze each study separately and then use appropriate meta‐analysis method to obtain pooled estimate | Use one stage approach for conducting individual patient data meta‐analysis (IPD‐MA)87 |
| 9 | Report results | Summarize each model/results with effect size, 95% CI and exact P value | Report 95% predictive interval along with confidence interval in case of random effects analysis |
| 10 | Validation and sensitivity if possible | Perform any ancillary analysis to validate the robustness of the findings |
Abbreviation: CI: confidence interval.
For using the SAMBR checklists, the researcher may describe all the items in part A (Table 1) (1‐10) and part B (Table 2) in the study. Part (B) may be described using the appropriate section from part (C) related to their study design, and accordingly, develop statistical analysis plan for a proposal/grant and execute the statistical analyses from the referenced papers.
5. APPLICATION
For the purpose of SAMBR checklists illustration, we evaluated three recently published articles in oncology—an RCT,88 an NRCT,89 and a predictive study.90 The adherence to SAMBR checklists was evaluated for these studies and reported in Table 14. As per SAMBR checklists, these studies could have reported additional information to further improve quality and reproducibility. The RCT article applied intention‐to‐treat analysis, two‐sided test, and determined the unadjusted effect of treatment using stratified Cox model and log rank test as per the study design, objective and SAMBR checklists. However, this study did not report randomization accuracy, the adjusted effect of treatment after controlling for prognostic factors, and assess heterogeneity for composite outcome or treatment effect as per the preferred methods in SAMBR checklists. Also, this study did not report number‐needed‐to‐treat or years‐needed‐to‐treat and classify superiority using clinically meaningful limit as suggested in SAMBR checklists. This study concluded that palbociclib‐fulvestrant group showed longer overall survival than the placebo‐fulvestrant group without significant difference among advanced breast cancer patients (hazards ratio = 0.81, P = .09).88 Adjusting for prognostic factors may change the significant findings especially with borderline significant results. Similarly, published NRCT89 did not fully adhere to analysis steps according to SAMBR checklists. The predictive study90 did not report the selection of parsimonious model among competing models using a bootstrap approach as suggested in SAMBR checklists. Further, internal validation of the developed predictive models and necessary elements (model equation, baseline survival probability at a specific time, etc) were not provided as per SAMBR checklists, which makes them harder to use for predicting different types of cancer risk for a batch of at‐risk subjects.
Table 14.
Application of SAMBR‐part (C) for evaluating statistical analysis and methods in three published articles
| RCT | NRCT | Predictive study | |||
|---|---|---|---|---|---|
| Required analysis and reporting | Adherence | Required analysis and reporting | Adherence | Required analysis and reporting | Adherence |
| Randomization evaluation | No | Assessment of confounding effects | Yes | Multiple imputations | Yes |
| Intention‐to‐treat | Yes | Propensity score matched analysis or IPTW analysis or adjustment for unmeasured confounding effects | No | Appropriate multivariable model | Yes |
| Two‐sided test | Yes | Adjustment for multiplicity if needed | No | Backward elimination with bootstrap | No |
| Adjustment for multiplicity if needed | NA | Adjusted 95% CI for multiplicity if needed | No | Non‐linearity of quantitative variables | Yes |
| Adjusted 95% CI for multiplicity | NA | Relative risk for binary outcome | No | Internal validation | No |
| Time‐to‐analysis | Yes | Unadjusted analysis | Yes | External validation | Yes |
| Unadjusted analysis | Yes | Adjusted analysis for prognostic factors with 95% CI | Yes | AIC or MSPE | No |
| Adjusted analysis for prognostic factors with 95%CI | No | NNT with 95% CI | No | Calibration | Yes |
| NNT, YNT with 95% CI | No | Reported absolute and the relative difference with 95% CI | Yes | Discrimination | Yes |
| Reported absolute and the relative difference with 95% CI | Yes | Categorize the conclusion (superiority) | Yes | Reclassification | No |
| Categorize the conclusion (superiority) | No | Heterogeneity in treatment effect | No | Clinical usefulness measure | No |
| Heterogeneity in treatment effect | Yes (sub‐group analyses) | Sensitivity and validation analysis if needed | Yes (sub‐group analysis only) | Necessary elements reported for prediction | No |
| Heterogeneity for composite outcome if needed | No | Heterogeneity for composite outcome | No | Points‐based system | No |
| Sensitivity and validation analysis if needed | Yes | Sensitivity and validation analysis if needed | Yes | Nomogram/web‐calculator | Web‐calculator |
| Validation analysis | Yes | ||||
Abbreviations: AIC, Akaike information criteria; CI, confidence interval; IPTW, inverse probability treatment weighting; MSPE, mean square prediction error; NA, not applicable; NNT, number‐needed‐to‐treat; NRCT, nonrandomized controlled trial; RCT, randomized controlled trial; SAMBR, statistical analysis and methods in biomedical research; YNT, years‐needed‐to‐treat.
6. CONCLUSIONS
SAMBR is an attempt for a modest proposal towards a concise resource document to be used for evidence‐based analytic practice. The SAMBR (a) suggests linking study objectives, design, and methods for proper selection and application of statistical methods; (b) suggests preferred reporting and summarizing of research question, sample size, and statistical analysis plan; (c) facilitates the choice of statistical approaches with proper references for their execution classified according to study design and study objectives in a concise format; (d) highlights and emphasizes uniform practice for data analysis and reporting. The SAMBR include three components, the first component of SAMBR would help in reporting essential design features to determine the appropriate checklist for statistical analysis specific to study objective and design, the second component of SAMBR would help reviewers to assess the quality reporting of statistical analysis, and third component includes various checklists specific to study design and objectives. We have provided flow charts to navigate researchers to appropriately select checklist as per their study design and objectives. However, ideally, these flow charts should be implemented on the web with skip patterns to direct researchers to the target checklist. We are in the process of developing a web‐based application of the SAMBR checklist and is a subject of our next publication. We plan to include not only the checklist but also step by step guidance to conduct the analyses using available commercial analytic software as well as using freely available analytic software (such as R).
The SAMBR checklists for various studies were not developed using expert opinions. However, we conducted an extensive review of research designs, statistical, and epidemiological published studies to develop these checklists. The purpose of the SAMBR checklists is to highlight the use and critical appraisal of evidence‐based statistical approaches by study design type and objectives. Although the developed checklists provide comprehensive evidence‐based statistical approaches for commonly used research designs, these checklists exclude synthesis of advanced statistical approaches and designs (such as Bayesian methods, structural equation modeling, methods for mixed study designs, multiple time‐to‐event data analysis, sequential or adaptive clinical trials, futility analysis, and survey designs), which need to be included periodically to revise the proposed checklists. The SAMBR checklists provide a quality reporting tool for ensuring methodological standards in common study designs. We believe that the checklists may reduce statistical controversies, promote consistent application of statistical approaches, thus improving the quality of research studies. The suggested methods need to be updated periodically in view of updated evidence. There is a need to develop an interactive web‐based application of the checklists for users for its wide‐availability and applications. The checklists do not enforce to use suggested statistical methods rather encourage to adhere and report minimum statistical analysis steps required for data analysis of common studies as per their objectives/hypothesis. Researchers may use alternative statistical procedures with proper justification as opposed to suggested methods classified for each step of data analysis.
AUTHORS' CONTRIBUTIONS
All authors had full access to the data in the study and take responsibility for the integrity of the data and the accuracy of the data analysis. Conceptualization, A.K.D.; Methodology, A.K.D. & R.S.; Investigation, A.K.D.; Formal Analysis, A.K.D.; Resources, A.K.D.; Writing ‐ Original Draft, A.K.D.; Writing ‐ Review & Editing, A.K.D. & R.S.; Visualization, A.K.D. & R.S.; Supervision, A.K.D. & R.S.; Funding Acquisition, F.M.L.
CONFLICT OF INTERESTS
The authors declare that they have no competing interests or any financial disclosure. All the authors have completed ICMJE disclosure form.
FUNDING INFORMATION
The author(s) received no financial support for the research, authorship, and/or publication of this article.
ACKNOWLEDGEMENTS
The authors would like to thank Pallavi Dubey and Muditha Perera for formatting references as per the journal criteria and providing their useful comments and insights.
Dwivedi AK, Shukla R. Evidence‐based statistical analysis and methods in biomedical research (SAMBR) checklists according to design features. Cancer Reports. 2020;3:e1211. 10.1002/cnr2.1211
REFERENCES
- 1. Khera R, Angraal S, Couch T, et al. Adherence to methodological standards in research using the national inpatient sample. JAMA. 2017;318(20):2011‐2018. [DOI] [PMC free article] [PubMed] [Google Scholar]
- 2. Motheral B, Brooks J, Clark MA, et al. A checklist for retrospective database studies—report of the ISPOR task force on retrospective databases. Value Health. 2003;6(2):90‐97. [DOI] [PubMed] [Google Scholar]
- 3. Altman DG, Gore SM, Gardner MJ, Pocock SJ. Statistical guidelines for contributors to medical journals. Ann Clin Biochem. 1992;29(1):1‐8. [DOI] [PMC free article] [PubMed] [Google Scholar]
- 4. Lang TA, Altman DG. Basic statistical reporting for articles published in biomedical journals: the "Statistical Analyses and Methods in the Published Literature" or the SAMPL Guidelines. Int J Nurs Stud. 2015;52(1):5. [DOI] [PubMed] [Google Scholar]
- 5. Charan J, Saxena D. Suggested statistical reporting guidelines for clinical trials data. Indian J Psychol Med. 2012;34(1):25. [DOI] [PMC free article] [PubMed] [Google Scholar]
- 6. Hess A, Shardell M, Johnson J, et al. Methods and recommendations for evaluating and reporting a new diagnostic test. Eur J Clin Microbiol Infect Dis. 2012;31(9):2111‐2116. [DOI] [PMC free article] [PubMed] [Google Scholar]
- 7. Ercan I, Yazıcı B, Yang Y, et al. Misuse of statistics in medical research. Eur J Gen Med. 2007;4(3):128‐134. [Google Scholar]
- 8. Thiese MS, Arnold ZC, Walker SD. The misuse and abuse of statistics in biomedical research. Biochem Med. 2015;25(1):5‐11. [DOI] [PMC free article] [PubMed] [Google Scholar]
- 9. Dwivedi AK, Mallawaarachchi I, Alvarado LA. Analysis of small sample size studies using nonparametric bootstrap test with pooled resampling method. Stat Med. 2017;36(14):2187‐2205. [DOI] [PubMed] [Google Scholar]
- 10. Nelson KP, Edwards D. Measures of agreement between many raters for ordinal classifications. Stat Med. 2015;34(23):3116‐3132. [DOI] [PMC free article] [PubMed] [Google Scholar]
- 11. Sauerbrei W, Abrahamowicz M, Altman DG, Cessie S, Carpenter J. Strengthening analytical thinking for observational studies: The STRATOS initiative. Stat Med. 2014;33(30):5413‐5432. [DOI] [PMC free article] [PubMed] [Google Scholar]
- 12. IntHout J, Ioannidis JP, Rovers MM, Goeman JJ. Plea for routinely presenting prediction intervals in meta‐analysis. BMJ Open. 2016;6(7):e010247. [DOI] [PMC free article] [PubMed] [Google Scholar]
- 13. Yu J, Zhou Z, McEvoy RD, et al. Association of positive airway pressure with cardiovascular events and death in adults with sleep apnea: a systematic review and meta‐analysis. JAMA. 2017;318(2):156‐166. [DOI] [PMC free article] [PubMed] [Google Scholar]
- 14. Rose CE, Pan Y, Baughman AL. Bayesian logistic regression modeling as a flexible alternative for estimating adjusted risk ratios in studies with common outcomes. J Biom Biostat. 2015;6(4):1‐6. [Google Scholar]
- 15. Dwivedi AK, Mallawaarachchi I, Lee S, Tarwater P. Methods for estimating relative risk in studies of common binary outcomes. J Appl Stat. 2014;41(3):484‐500. [Google Scholar]
- 16. Pi‐Sunyer X, Astrup A, Fujioka K, et al. A randomized, controlled trial of 3.0 mg of liraglutide in weight management. N Engl J Med. 2015;373(1):11‐22. [DOI] [PubMed] [Google Scholar]
- 17. Galit S. To Explain or to predict? Stat Sci. 2010;25(3):289‐310. [Google Scholar]
- 18. Weissgerber TL, Milic NM, Winham SJ, Garovic VD. Beyond bar and line graphs: time for a new data presentation paradigm. PLoS Biol. 2015;13(4):e1002128. [DOI] [PMC free article] [PubMed] [Google Scholar]
- 19. Benjamin DJ, Berger JO. Three recommendations for improving the use of p‐values. Am Stat. 2019;73(1):1537‐2731. [Google Scholar]
- 20. Ten Have TR, Normand SL, Marcus SM, Brown CH, Lavori P, Duan N. Intent‐to‐treat vs. non‐intent‐to‐treat analyses under treatment non‐adherence in mental health randomized trials. Psychiatr Ann. 2008;38(12):772‐783. [DOI] [PMC free article] [PubMed] [Google Scholar]
- 21. Little RJA, Rubin DB. Statistical analysis with missing data. New York: John Wiley & Sons, Inc; 1987. [Google Scholar]
- 22. Heniksen JMT, Geersing GJ, Moons KGM, de Groot JAH. Diagnostic and prognostic prediction models. J Thromb Haemost. 2013;11(Suppl 1):129‐141. [DOI] [PubMed] [Google Scholar]
- 23. Sauerbrei W, Royston P, Binder H. Selection of important variables and determination of functional form for continuous predictors in multivariable model building. Stat Med. 2007;26(30):5512‐5528. [DOI] [PubMed] [Google Scholar]
- 24. Genuer R, Poggi J‐M, Tuleau‐Malot C. Variable selection using random forests. Pattern Recogn Lett. 2010;31(14):2225‐2236. [Google Scholar]
- 25. Molinaro AM, Wrensch MR, Jenkins RB, Eckel‐Passow JE. Statistical considerations on prognostic models for glioma. Neuro Oncol. 2016;18(5):609‐623. [DOI] [PMC free article] [PubMed] [Google Scholar]
- 26. Bradburn MJ, Clark TG, Love SB, Altman DG. Survival analysis part II: Multivariate data analysis—an introduction to concepts and methods. Br J Cancer. 2003;89(3):431‐436. [DOI] [PMC free article] [PubMed] [Google Scholar]
- 27. Sullivan LM, Massaro JM, D'Agostino RB. Presentation of multivariate data for clinical use: The Framingham Study risk score functions. Stat Med. 2004;23(10):1631‐1660. [DOI] [PubMed] [Google Scholar]
- 28. Elze MC, Gregson J, Baber U, et al. Comparison of propensity score methods and covariate adjustment: evaluation in 4 cardiovascular studies. J Am Coll Cardiol. 2017;69(3):345‐357. [DOI] [PubMed] [Google Scholar]
- 29. Austin PC. An introduction to propensity score methods for reducing the effects of confounding in observational studies. Multivar Behav Res. 2011;46(3):399‐424. [DOI] [PMC free article] [PubMed] [Google Scholar]
- 30. Ertefaie A, Small DS, Flory JH, Hennessy S. A tutorial on the use of instrumental variables in pharmacoepidemiology. Pharmacoepidemiol Drug Saf. 2017;26(4):357‐367. [DOI] [PubMed] [Google Scholar]
- 31. Austin PC, Stuart EA. Moving towards best practice when using inverse probability of treatment weighting (IPTW) using the propensity score to estimate causal treatment effects in observational studies. Stat Med. 2015;34(28):3661‐3679. [DOI] [PMC free article] [PubMed] [Google Scholar]
- 32. Austin PC, Small DS. The use of bootstrapping when using propensity‐score matching without replacement: a simulation study. Stat Med. 2014;33(24):4306‐4319. [DOI] [PMC free article] [PubMed] [Google Scholar]
- 33. Castelloe J, Watts D. Equivalence and noninferiority testing using SAS/STAT® software. 2015.
- 34. Bonett DG, Price RM. Adjusted Wald confidence interval for a difference of binomial proportions based on paired data. J Educ Behav Stat. 2012;37(4):479‐488. [Google Scholar]
- 35. Goeman JJ, Solari A, Stijnen T. Three‐sided hypothesis testing: simultaneous testing of superiority, equivalence and inferiority. Stat Med. 2010;29(20):2117‐2125. [DOI] [PubMed] [Google Scholar]
- 36. Jeffrey DB, Lucy D'Agostino M, William DD, Robert AG Jr. Second‐generation p‐values: improved rigor, reproducibility, & transparency in statistical analyses. PLoS ONE. 2018;13(3):e0188299. [DOI] [PMC free article] [PubMed] [Google Scholar]
- 37. Pocock SJ, McMurray JJV, Collier TJ. Statistical controversies in reporting of clinical trials: part 2 of a 4‐Part series on Statistics for clinical trials. J Am Coll Cardiol. 2015;66(23):2648. [DOI] [PubMed] [Google Scholar]
- 38. O'Connell NS, Dai L, Jiang Y, et al. Methods for analysis of pre‐post data in clinical research: a comparison of five common methods. J Biom Biostat. 2017;8(1):1. [DOI] [PMC free article] [PubMed] [Google Scholar]
- 39. Szmaragd C, Clarke P, Steele F. Subject specific and population average models for binary longitudinal data: A tutorial. 2013.
- 40. McNeish DM, Harring JR. Clustered data with small sample sizes: comparing the performance of model‐based and design‐based approaches. Commun Stat Simul Comput. 2017;46(2):855‐869. [Google Scholar]
- 41. Ye Y, Li A, Liu L, Yao B. A group sequential Holm procedure with multiple primary endpoints. Stat Med. 2013;32(7):1112‐1124. [DOI] [PubMed] [Google Scholar]
- 42. Guyatt G, Rennie D, Meade M, Cook D. Users' guides to the medical literature. 3rd ed. New York, N.Y: McGraw‐Hill Medical; 2015. [Google Scholar]
- 43. Laubender RP, Bender R. Estimating adjusted risk difference (RD) and number needed to treat (NNT) measures in the Cox regression model. Stat Med. 2010;29(7–8):851‐859. [DOI] [PubMed] [Google Scholar]
- 44. Austin PC. Absolute risk reductions, relative risks, relative risk reductions, and numbers needed to treat can be obtained from a logistic regression model. J Clin Epidemiol. 2010;63(1):2‐6. [DOI] [PubMed] [Google Scholar]
- 45. Page P. Beyond statistical significance: clinical interpretation of rehabilitation research literature. Int J Sports Phys Ther. 2014;9(5):726. [PMC free article] [PubMed] [Google Scholar]
- 46. Saunders R, Cape J, Fearon P, Pilling S. Predicting treatment outcome in psychological treatment services by identifying latent profiles of patients. J Affect Disord. 2016;197:107‐115. [DOI] [PubMed] [Google Scholar]
- 47. Kent DM, Nelson J, Dahabreh IJ, Rothwell PM, Altman DG, Hayward RA. Risk and treatment effect heterogeneity: re‐analysis of individual participant data from 32 large clinical trials. Int J Epidemiol. 2016;45(6):2075‐2088. [DOI] [PMC free article] [PubMed] [Google Scholar]
- 48. Pogue J, Thabane L, Devereaux PJ, Yusuf S. Testing for heterogeneity among the components of a binary composite outcome in a clinical trial. BMC Med Res Methodol. 2010;10(1):49. [DOI] [PMC free article] [PubMed] [Google Scholar]
- 49. Pogue J, Devereaux PJ, Thabane L, Yusuf S. Designing and analyzing clinical trials with composite outcomes: consideration of possible treatment differences between the individual outcomes. PLoS ONE. 2012;7(4):e34785. [DOI] [PMC free article] [PubMed] [Google Scholar]
- 50. Fagerland MW, Lydersen S, Laake P. Recommended confidence intervals for two independent binomial proportions. Stat Methods Med Res. 2015;24(2):224‐254. [DOI] [PubMed] [Google Scholar]
- 51. Kim H‐Y. Statistical notes for clinical researchers: post‐hoc multiple comparisons. Restor Dent Endod. 2015;40(2):172‐176. [DOI] [PMC free article] [PubMed] [Google Scholar]
- 52. Galbraith S, Daniel JA, Vissel B. A study of clustered data and approaches to its analysis. J Neurosci. 2010;30(32):10601‐10608. [DOI] [PMC free article] [PubMed] [Google Scholar]
- 53. Laajala TD, Jumppanen M, Huhtaniemi R, et al. Optimized design and analysis of preclinical intervention studies in vivo. Sci Rep. 2016;6(1):30723. [DOI] [PMC free article] [PubMed] [Google Scholar]
- 54. Pearce N. Analysis of matched case‐control studies. BMJ. 2016;352:i969. [DOI] [PMC free article] [PubMed] [Google Scholar]
- 55. Sjölander A, Greenland S. Ignoring the matching variables in cohort studies—when is it valid and why? Stat Med. 2013;32(27):4696‐4708. [DOI] [PubMed] [Google Scholar]
- 56. Sterne JAC, Tilling K. G‐estimation of causal effects, allowing for time‐varying confounding. Stata J. 2002;2(2):164‐182. [Google Scholar]
- 57. Sander G, Judea P, James MR. Causal diagrams for epidemiologic research. Epidemiology. 1999;10(1):37‐48. [PubMed] [Google Scholar]
- 58. Koller MT, Raatz H, Steyerberg EW, Wolbers M. Competing risks and the clinical community: irrelevance or ignorance? Stat Med. 2012;31(11–12):1089‐1097. [DOI] [PMC free article] [PubMed] [Google Scholar]
- 59. Austin PC, Merlo J. Intermediate and advanced topics in multilevel logistic regression analysis. Stat Med. 2017;36(20):3257‐3277. [DOI] [PMC free article] [PubMed] [Google Scholar]
- 60. Figueiras A, Domenech‐Massons JM, Cadarso C. Regression models: calculating the confidence interval of effects in the presence of interactions. Stat Med. 1998;17(18):2099‐2105. [DOI] [PubMed] [Google Scholar]
- 61. Heinze G, Wallisch C, Dunkler D. Variable selection—a review and recommendations for the practicing Statistician. Biom J. 2018;60(3):431‐449. [DOI] [PMC free article] [PubMed] [Google Scholar]
- 62. Hubbard AE, Ahern J, Fleischer NL, et al. To GEE or not to GEE: Comparing population average and mixed models for estimating the associations between neighborhood risk factors and health. Epidemiology. 2010;21(4):467‐474. [DOI] [PubMed] [Google Scholar]
- 63. Chavent M, Kuentz Simonet V, Liquet B, Saracco J. ClustOfVar: An R package for the clustering of variables. J Stat Softw. 2012;50(13):1‐16.25317082 [Google Scholar]
- 64. Lu F, Petkova E. A comparative study of variable selection methods in the context of developing psychiatric screening instruments. Stat Med. 2014;33(3):401‐421. [DOI] [PMC free article] [PubMed] [Google Scholar]
- 65. Dan S, Cardell NS. The hybrid CART‐Logit model in classification and data mining 1998.
- 66. Habibzadeh F, Yadollahie M. Number needed to misdiagnose: a measure of diagnostic test effectiveness. Epidemiology. 2013;24(1):170. [DOI] [PubMed] [Google Scholar]
- 67. Reitsma JB, Rutjes AW, Khan KS, Coomarasamy A, Bossuyt PM. A review of solutions for diagnostic accuracy studies with an imperfect or missing reference standard. J Clin Epidemiol. 2009;62(8):797‐806. [DOI] [PubMed] [Google Scholar]
- 68. Reiczigel J. Con dence intervals for the binomial parameter: some new considerations. Stat Med. 2003;22:611‐621. [DOI] [PubMed] [Google Scholar]
- 69. Dwivedi AK, Mallawaarachchi I, Figueroa‐Casas JB, Morales AM, Tarwater P. Multinomial logistic regression approach for the evaluation of binary diagnostic test in medical research. Stat Transition New Ser. 2015;16(2):203‐222. [Google Scholar]
- 70. Elie C, Coste J. A methodological framework to distinguish spectrum effects from spectrum biases and to assess diagnostic and screening test accuracy for patient populations: application to the Papanicolaou cervical cancer smear test. BMC Med Res Methodol. 2008;8:7. [DOI] [PMC free article] [PubMed] [Google Scholar]
- 71. Takaya S, Marc R. The precision‐recall plot is more informative than the ROC plot when evaluating binary classifiers on imbalanced datasets. PLoS ONE. 2015;10(3):e0118432. [DOI] [PMC free article] [PubMed] [Google Scholar]
- 72. Ray P, Le Manach Y, Riou B, Houle TT. Statistical evaluation of a biomarker. Anesthesiology. 2010;112(4):1023‐1040. [DOI] [PubMed] [Google Scholar]
- 73. Kumar R, Indrayan A. Receiver operating characteristic (ROC) curve for medical researchers. Indian Pediatr. 2011;48(4):277‐287. [DOI] [PubMed] [Google Scholar]
- 74. Dwivedi DK, Kumar R, Dwivedi AK, et al. Prebiopsy multiparametric MRI‐based risk score for predicting prostate cancer in biopsy‐naive men with prostate‐specific antigen between 4–10 ng/mL. J Magn Reson Imaging. 2018;47(5):1227‐1236. [DOI] [PubMed] [Google Scholar]
- 75. Hajian‐Tilaki KO, Hanley JA, Joseph L, Collet J‐P. A Comparison of parametric and nonparametric approaches to ROC analysis of quantitative diagnostic tests. Med Decis Making. 1997;17(1):94‐102. [DOI] [PubMed] [Google Scholar]
- 76. Bland JM, Altman DG. Applying the right statistics: analyses of measurement studies. Ultrasound Obstet Gynecol. 2003;22(1):85‐93. [DOI] [PubMed] [Google Scholar]
- 77. Hallgren KA. Computing inter‐rater reliability for observational data: an overview and tutorial. Tutor Quant Methods Psychol. 2012;8(1):23‐34. [DOI] [PMC free article] [PubMed] [Google Scholar]
- 78. Barnhart HX, Haber M, Song J. Overall concordance correlation coefficient for evaluating agreement among multiple observers. Biometrics. 2002;58(4):1020‐1027. [DOI] [PubMed] [Google Scholar]
- 79. Banerjee M, Capozzoli M, McSweeney L, Sinha D. Beyond kappa: a review of interrater agreement measures. Can J Stat. 1999;27(1):3‐23. [Google Scholar]
- 80. Mitani AA, Nelson KP. Modeling agreement between binary classifications of multiple raters in R and SAS. J Mod Appl Stat Methods. 2017;16(2):277‐309. [Google Scholar]
- 81. Zeng X, Zhang Y, Kwong JS, et al. The methodological quality assessment tools for preclinical and clinical studies, systematic review and meta‐analysis, and clinical practice guideline: a systematic review. J Evid Based Med. 2015;8(1):2‐10. [DOI] [PubMed] [Google Scholar]
- 82. Borenstein M, Hedges LV, Higgins JPT, Rothstein HR. Introduction to meta‐analysis. 1. Aufl. ed. West Sussex, England: Wiley; 2009. [Google Scholar]
- 83. Borenstein M, Hedges LV, Higgins JPT, Rothstein HR. A basic introduction to fixed‐effect and random‐effects models for meta‐analysis. Res Synth Methods. 2010;1(2):97‐111. [DOI] [PubMed] [Google Scholar]
- 84. Bradburn MJ, Deeks JJ, Berlin JA, Russell LA. Much ado about nothing: a comparison of the performance of meta‐analytical methods with rare events. Stat Med. 2007;26(1):53‐77. [DOI] [PubMed] [Google Scholar]
- 85. IntHout J, Ioannidis JP, Borm GF. The Hartung‐Knapp‐Sidik‐Jonkman method for random effects meta‐analysis is straightforward and considerably outperforms the standard DerSimonian‐Laird method. BMC Med Res Methodol. 2014;14:25. [DOI] [PMC free article] [PubMed] [Google Scholar]
- 86. Veroniki AA, Jackson D, Viechtbauer W, et al. Methods to estimate the between‐study variance and its uncertainty in meta‐analysis. Res Synth Methods. 2016;7(1):55‐79. [DOI] [PMC free article] [PubMed] [Google Scholar]
- 87. Burke DL, Ensor J, Riley RD. Meta‐analysis using individual participant data: one‐stage and two‐stage approaches, and why they may differ. Stat Med. 2017;36(5):855‐875. [DOI] [PMC free article] [PubMed] [Google Scholar]
- 88. Turner NC, Slamon DJ, Ro J, et al. Overall Survival with palbociclib and fulvestrant in advanced breast cancer. N Engl J Med. 2018;379(20):1926‐1936. [DOI] [PubMed] [Google Scholar]
- 89. Spera G, Fresco R, Fung H, et al. Beta blockers and improved progression‐free survival in patients with advanced HER2 negative breast cancer: a retrospective analysis of the ROSE/TRIO‐012 study. Ann Oncol. 2017;28(8):1836‐1841. [DOI] [PubMed] [Google Scholar]
- 90. Hippisley‐Cox J, Coupland C. Development and validation of risk prediction algorithms to estimate future risk of common cancers in men and women: prospective cohort study. BMJ Open. 2015;5(3):e007825. [DOI] [PMC free article] [PubMed] [Google Scholar]