Abstract
Background
Ovarian (OV) cancer is considered as one of the most deadly malignancies in women, since it is unfortunately diagnosed in advanced stages. Nowadays, the importance of bioinformatics tools and their frequent usage in tracking dysregulated cancer‐related genes and pathways have been highlighted in researches.
Aim
The aim of this study is to investigate dysregulated miRNAs‐genes network and its function in OV tumors based on the integration of microarray data through a system biology approach.
Methods
Two microarray data (GSE119056 and GSE4122) were analyzed to explore the differentially expressed miRNAs (DEmiRs) and genes among OV tumors and normal tissues. Then, through the help of TargetScan, miRmap, and miRTarBase databases, the dysregulated miRNA‐gene network in OV tumors was constructed by Cytoscape. In the next step, co‐expression and protein‐protein interaction networks were made using GEPIA and STRING databases. Moreover, the functional analysis of the hub genes was done by DAVID, KEGG, and Enrichr databases. Eventually, the regulatory network of TF‐miRNA‐gene was constructed.
Results
The potential dysregulated miRNAs‐genes network in OV tumors has been constructed, including 109 differentially expressed genes (DEGs), 25 DEmiRs, and 213 interactions. Two down‐regulated microRNAs, miR‐660‐3p and hsa‐miR‐4510, have the most interactions with up‐expressed oncogenic DEGs. CDK1, PLK1, CCNB1, CCNA2, and EZH2 are involved in protein module, which show significant overexpression in OV tumors according to The Cancer Genome Atlas (TCGA) data. EZH2 shows amplification in OV tumors with remarkable percentage. The transcription factors TFAP2C and GATA4 have the pivotal regulatory functions in oncotranscriptomic profile of OV tumors.
Conclusion
In current study, we have collected and integrated different data to uncover the complex molecular interactions and oncomechanisms in OV tumors. The DEmiRs‐DEGs and TF‐miRNA‐gene networks reveal the potential interactions that could be a significant piece of the OV onco‐puzzle.
Keywords: bioinformatics, microarray data, miRNA, ovarian cancer, systems biology
1. INTRODUCTION
Ovarian (OV) cancer shows the seventh most frequency among the malignancies in women. 1 In 2018, around the world, 295 414 new cases of this disease and 184 799 OV cancer‐related death approximately registered. 2 Unfortunately, this cancer is diagnosed very late, and this factor strongly decreases the lifetime of patients. However, early diagnosis and effective treatment strategies could notably improve the patient's lifetime. 3
Increasing evidence indicates that miRNAs, as a category of short noncoding RNAs, alongside coding RNAs play pivotal roles in cancer initiation and progression. It is well established that microRNAs are involved in complex posttranscriptional gene regulatory network in both roles of tumor suppressor or oncogenic miRNAs (oncomiRs). 4
The incredible improvements in high‐throughput technologies such as microarray and RNA‐seq as well as bioinformatics tools generate huge data concerning coding and noncoding transcripts in the field of cancer research. Although, interpretation and intersection of available data are main challenges in this context. 5 Despite the extensive studies about molecular mechanisms in pathogenesis of OV cancer, the molecular interactions of coding and noncoding transcripts in the complex gene regulatory network have not completely figured out.
The purpose of this study is the combination of microarray data and bioinformatics analyses for a better understanding of dysregulated key genes and miRNAs in OV cancer compared with normal tissues. In this study, we constructed dysregulated miRNAs‐genes, co‐expression, and protein‐protein interactions (PPIs) networks. The identified hub genes and their interactions could clarify underlying factors in OV cancer development and present efficient therapeutic targets.
2. METHODS
2.1. Differentially expressed genes and miRNAs (DEmiRs) identification
Two Gene Expression Omnibus (GEO) datasets including GSE119056 (GPL19615 platform) with six tumor and three normal samples as well as GSE4122 with 32 tumor and 14 normal specimens were selected and analyzed. The Benjamini and Hochberg false discovery rate (FDR) method was used to adjust the P‐value to obtain the multiple testing adjusted q‐value. All the data are normalized and cross‐comparable (Figure S1). For selecting differentially expressed genes (DEGs) in OV tumors compared with normal tissues, adj. P‐value < .05 and log FC ≥ |2| were set. Then the common genes between both GSEs that show the same expression direction (up‐ or down‐expression) were chosen for the next step.
GSE119056 (GPL21572 platform) for investigation of DEmiRs between OV cancer and nontumor OV tissues was analyzed. Similar to the prior step, adj. P‐value < .05 and log FC ≥ |2| criteria were considered.
2.2. DEG‐DEmiR interactions
In the next step, the bioinformatically predicted and experimentally validated DEG‐DEmiR interactions were obtained using TargetScan, 6 miRmap, 7 and miRTarBase 8 databases. It should be noted that the predicted interactions that exist in both TargetScan and miRmap were selected. Finally, the dysregulated miRNAs‐genes network was constructed including experimentally validated DEG‐DEmiR interactions based on miRTarBase database and predicted interactions by Cytoscape v3.6.1. 9
2.3. Co‐expression and protein‐protein interaction networks
The co‐expression network was visualized based on the top 20 genes that are co‐expressed with each of DEGs according to TCGA data; GEPIA web server was used to retrieve the co‐expressed genes of DEGs. 10 The PPI network including DEGs and their co‐expressed genes was constructed using String database. 11 The genes with the higher betweenness centrality and degree were determined as the most important genes in these networks (hub genes). Eventually, the functions of the hub genes were identified by DAVID 12 and Enrichr 13 databases.
To detect the main protein module in PPI network, MCODE app, 14 the Cytoscape plugin, was run and the pathway in which this protein complex is involved was detected by KEGG mapper. 15
2.4. Oncogenomic and oncotranscriptomic analysis
The genetic alterations of the PPI network hub genes in the 606 OV tumors were retrieved from cBioPortal database (TCGA provisional). 16 To compare expression of hub genes between OV tumors and adjacent normal tissues based on TCGA data as well as ovarian normal tissues based on the Genotype‐Tissue Expression (GTEx) data, GEPIA web server was used. The method for differential analysis is one‐way ANOVA; genes with |log2FC| >1 and q‐value <0.01 are considered DEGs.
2.5. Drug‐protein network
To investigate the potential of hub genes to becoming therapeutic targets, the drugs‐protein interactions were detected by Cytarget linker. 17
2.6. Identification of TF‐miRNA‐gene axes
We used HOCOMOCO v11 database (comprehensive collection of human transcription factor [TF]) to identify our DE genes that act as TF. 18 Then TransmiR v2.0 (an experimentally supported TF‐miRNA regulatory relationship database) was used to identify TF‐miRNA interactions. 19 TRRUST v2 (transcriptional regulatory relationships unraveled by sentence‐based text mining) 20 and RegNetwork (an integrated database of transcriptional and posttranscriptional regulatory networks in human and mouse) 21 databases were applied to assess the TF‐TF and TF‐gene interactions.
3. RESULTS
3.1. DEG‐DEmiR network
As it was mentioned before, DEGs in OV cancer samples compared with normal tissues were identified through analyzing two GSE 119056 and GSE4122. The number of common DEGs with adj. P‐value < .05 and log FC ≥ |2| is 109 which shows same direction of expression in two datasets (Table S1). Also, after analyzing of GSE119056, 25 DEmiRs with adj. P‐value < .05 and log FC ≥ |2| in OV cancer tissues were screened (Table S2).
To obtain dysregulated miRNA‐mRNA axes in OV tumors, three databases (TargetScan and miRmap for predicted interactions and miRTarBase for experimentally validated interactions) were applied. A total of 176 common predicted interactions in two mentioned databases and 46 validated interactions were identified. Taken together, 213 interactions have been detected (Table S3). Finally, DEG‐DEmiR network in OV tumors has been visualized by Cytoscape (Figure 1).
FIGURE 1.
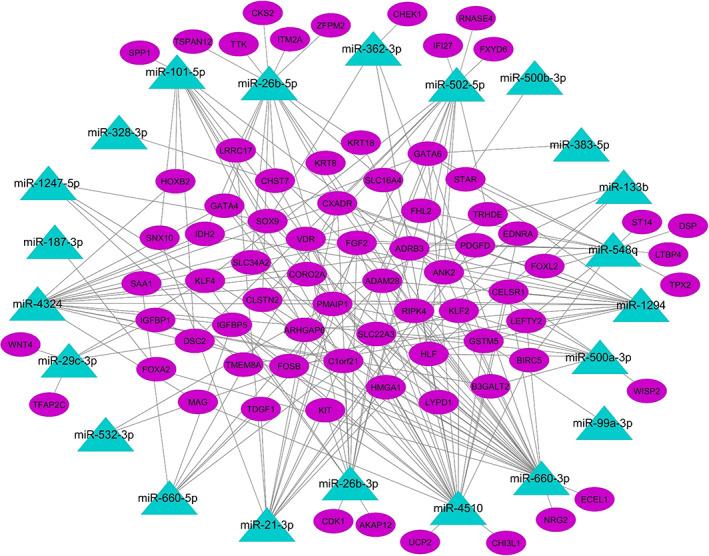
Dysregulated miRNA‐gene network. The cyan triangles and purple ellipses present miRNAs and genes, respectively. The potential molecular interactions between miRNAs and mRNAs are shown by lines
3.2. Co‐expression network
The 20 top co‐expressed genes of each DEGs were retrieved from GEPIA web server. Co‐expression network consists of DEGs along with their co‐expressed genes. ABCA8, ECM2, KIFC1, MAGI1, and NAV3 genes with the highest degree and betweenness centrality are selected as hub genes (Figure 2). The expression of these hubs in OV cancer based on TCGA and GTEx data shows that all of them are significantly dysregulated in tumors compared with normal tissues (Figure 3).
FIGURE 2.
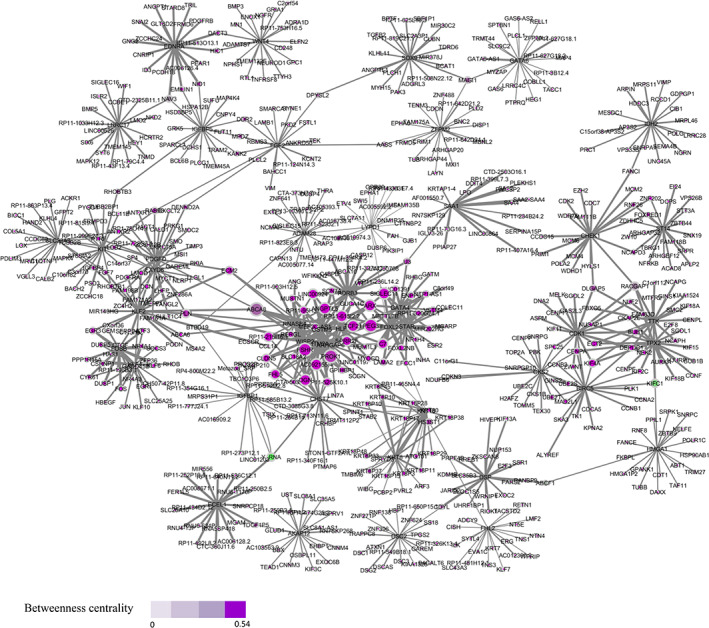
The co‐expression network including DEGs and their top 20 co‐expressed genes in OV cancer. The color and size of nodes indicate betweenness centrality and degree, respectively. Degree has a range from 1 to 26 for GSTM5 gene. The width of the edges has been adjusted according to PCC. The nodes with a higher size and stronger color are considered as hub genes. DEG, differently expressed gene; OV, ovarian; PCC, Pearson correlation coefficient
FIGURE 3.
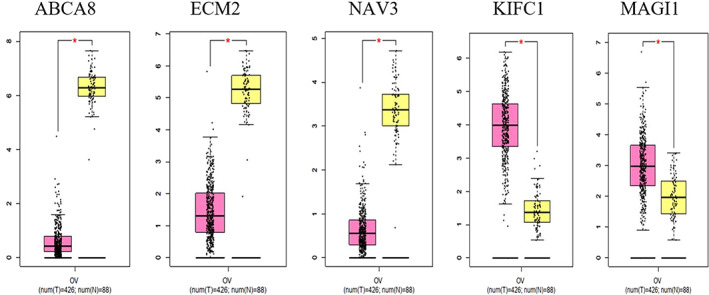
The boxplots of the expression changes of co‐expression network hub genes (ABCA8, ECM2, NAV3, CDK1, KIFC1, and MAGI1) in the OV tumor tissues compared with normal samples based on TCGA and GTEx data. The pink and yellow boxes show the tumor and nontumor tissues, respectively. These data have been obtained from GEPIA web server. Genes with |log2FC| > 1 and q‐values < 0.01 are considered differentially expressed genes. The red star shows a significant difference between the tumors and nontumor tissues. GTEx, Genotype‐Tissue Expression; OV, ovarian; TCGA, The Cancer Genome Atlas
3.3. Protein‐protein interaction network
In the next step, for preparing of PPI network, the STRING database was run. CDK1, PLK1, CCNB1, CCNA2, EZH2, and AURKA show the ability to be hub genes because of having a higher degree and betweenness centrality (Figure 4A). Then the box plots related to expression difference of these six hub genes between OV tumors and normal samples were analyzed by GEPIA database based on TCGA and GTEx data (Figure 5). All the hub genes show the significant expression differences between two sample groups. The genetic alterations of hub genes in 606 OV cancer samples were investigated by cBioPortal database. EZH2 and AURKA have a considerable mutation rate (9% and 11% of ovarian tumors, respectively), which most of them are gene amplification. Functional annotation according to Enrichr revealed the role of hub genes in cyclin‐dependent protein kinase activity and transition of the cell cycle from G2 to M phase (Figure 6).
FIGURE 4.
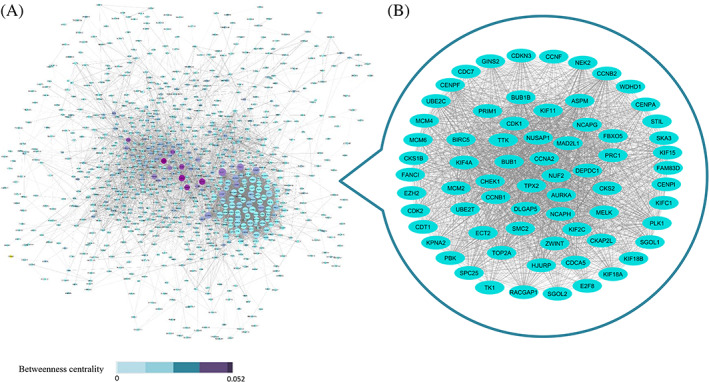
A, Protein‐protein interaction network based on DEGs and their co‐expressed genes in OV tumors. The color and size of nodes refer to betweenness centrality and degree, respectively. Degree has a range from 1 to 114 for CDK1 gene. The width of edges was adjusted based on the combined scores. B, The main protein module of PPI according to MCODE app. DEG, differently expressed gene; OV, ovarian; PPI, protein‐protein interaction
FIGURE 5.
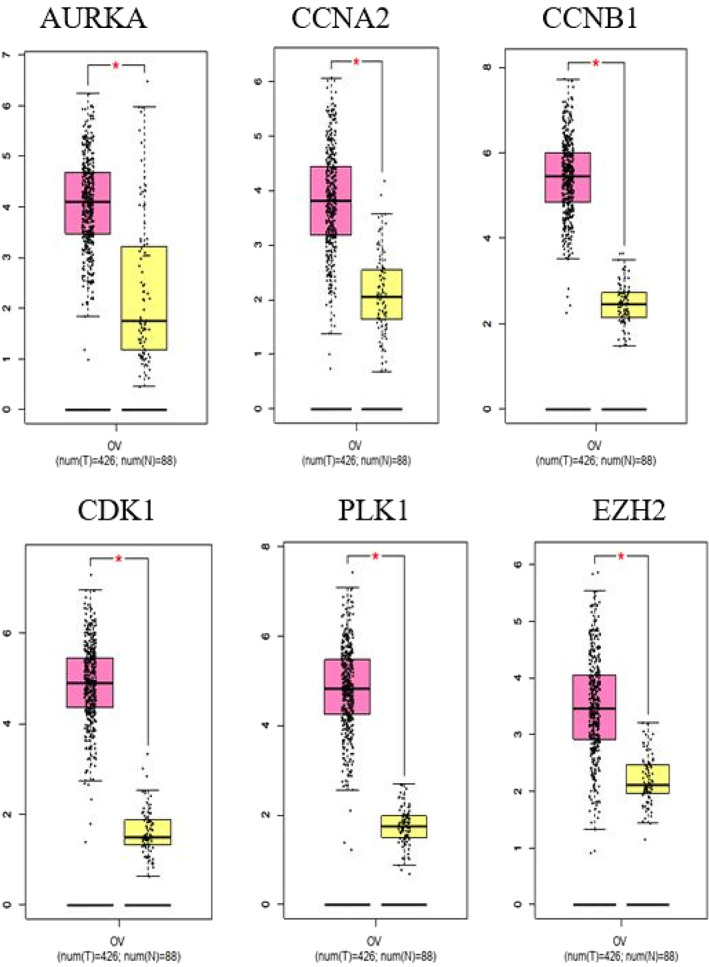
The boxplots of expression of PPI network hub genes (AURKA, CCNA2, CCNB1, CDK1, PLK1, and EZH2) in OV tumors compared with normal samples. The pink and yellow boxes represent the tumor and normal tissues, respectively. These data obtained from GEPIA database based on TCGA and GTEx data. Genes with |log2FC| > 1 and q‐values < 0.01 are considered differentially expressed genes. The red star shows a significant difference between tumors and matched nontumor tissues (P‐value ≤ .05). GTEx, Genotype‐Tissue Expression; OV, ovarian; PPI, protein‐protein interaction; TCGA, The Cancer Genome Atlas
FIGURE 6.

The bar graphs related to, A, GO‐biological processes and B, GO‐molecular functions of CDK1, PLK1, CCNB1, CCNA2, EZH2, and AURKA according to combined score. The graphs were obtained from Enrichr database. The longer and brighter bars show a more significant level. GO, gene ontology
For assessing the highly interconnected area in PPI network, MCODE, a Cytoscape app, was used, and the main protein module was created (Figure 4B). In addition, KEGG mapper shows the role of this module in the cell cycle (Figure 7).
FIGURE 7.
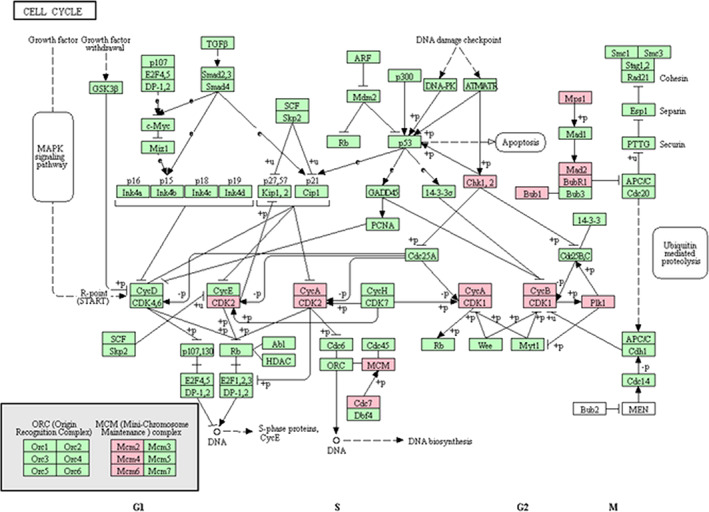
The role of 15 genes of MCODE module in different steps of the cell cycle obtained from KEGG mapper
3.4. Drug‐protein network
The drug‐protein network has been constructed based on DrugBank by CyTargetLinker app. The genes as CDK1, PLK1, CCNA2, and AURKA in this network are influenced by different kinase inhibitors (Figure 8).
FIGURE 8.
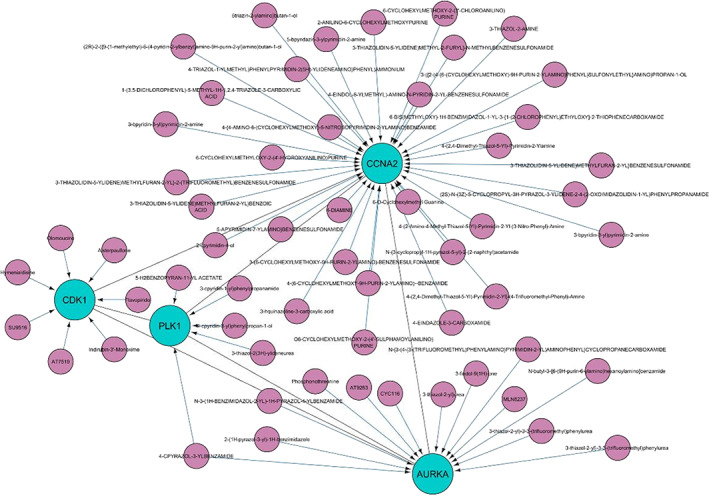
The drug‐protein network. The gray and purple ellipses show the genes and drugs, respectively. Data have been visualized by Cytarget linker app
3.5. Dysregulated TF‐miRNA‐gene network
Among 74 DE genes in miRNA‐gene network, 11 genes (VDR, HOXB2, GATA4, FOSB, GATA6, KLF4, HLF, FOXA2, SOX9, HMGA1, and TFAP2C) were identified as TFs by HOCOMOCO database. Twenty‐one validated interactions between TFs and miRNAs have been uncovered by running TransmiR database (Table S6). Also, 21 interactions between TF‐TF and TF‐gene have been detected by TRUST and RegNetwork databases (Table S6). Eventually, dysregulated TF‐miRNA‐gene network in OV tumors has been visualized by Cytoscape (Figure 9).
FIGURE 9.
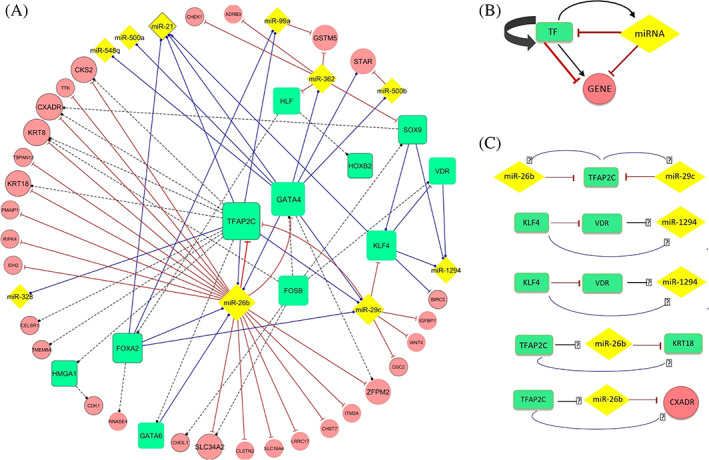
A, The dysregulated TF‐miRNA‐gene network in ovarian cancer. The nodes in green, yellow, and pink are TF, miRNAs, and genes, respectively. The blue edges show validated interactions between TFs and their targets, and the black dash lines represent predicted ones. The red edges show validated interactions between miRNAs and their targets. The  sign represents activating interaction. The
  and
and  demonstrate repressing and unknown interactions, respectively. The size of the nodes is adjusted according to the degree. The black borders of nodes represent up‐expression, but nodes without border demonstrate down‐expression. B, General overview of the regulatory relationships between TF, miRNA, and gene. C, Some extracted feedback and feedforward loops from TF‐miRNA‐gene network. TF, transcription factor
4. DISCUSSION
Among the cancer‐related deaths in women, OV cancer is ranked fifth. The contribution of genetic factors and family history to this cancer is well known. 22 Nowadays, the importance of noncoding RNAs in various malignancies is becoming more and more defined. The role of miRNAs as a tumor suppressors or oncogenes has been ascertained in tumor initiation and progression. 23 Despite their short length (up to 24 nucleotides), they are involved in the regulation of many genes expression. 24 In this study, through analyzing two microarray data (GSE119056 and GSE4122), 109 common DEGs in OV tumors compared with normal tissues were obtained with adj. P‐value < .05 and log FC ≥ |2|. Moreover, according to GSE119056, 25 DEmiRs with adj. P‐value < .05 and log FC ≥ |2| were detected in OV cancer. The DEGs‐DEmiRs network in OV tumors has been constructed through an integrative approach. This network consists of 213 mRNA‐miRNA axes.
The DEGs‐DEmiRs network uncovers the potential tumor suppressor miRNAs that have not been reported in OV cancer so far. Two down‐regulated miRNAs named miR‐660‐3p and hsa‐miR‐4510 show the most interactions with DEGs. Both of them in our study could target some studied oncogenes in other studies including ADAM28, 25 HMGA1 26 and SLC34A2. 27
According to Shyian et al report, the relationship between expression of SLC34A2 and differentiation level of OV tumor cells was confirmed. So, it can be used as a possible marker in determination of cell differentiation. 28 Also, the direct link of HMGA1 expression with OV tumor grade and proliferation rate in related cell lines was shown by several techniques. 29 Furthermore, miR‐660‐3p is probably involved in miRNA/FOXA2 and SOX9 axes. Our analyses indicate the significant up‐expression of these two oncogenes 30 , 31 in OV tumors. It is suggested that down‐expressed miR‐660‐3p in OV tumors results in overexpression of FOXA2 and SOX9 in malignant cells. The role of FOXA2 in loss of differentiation and regeneration of OV tumors is well known. 32 It has been indicated that SOX9 could act as a TF for some aggressive markers in OV tumors such as TUBB3 through EPAS1/Hif‐2α/SOX9/TUBB3 axis. 33
Another interesting axis, which has been detected by our exploration, is miR‐4510/BIRC5. BIRC5 (Survivin) is a member of the apoptosis inhibitory gene family and prevents apoptotic cell death. The oncogenic role of BIRC5 has been well documented in different malignancies. 34 Our data indicate the significant up‐expression of BIRC5 in OV tumors and suggest that it is a target for miR‐4510. Although, theses interactions should be functionally proven in OV tumor cells. In 2018, it has been shown that BIRC5 down‐regulation results in metastasis inhibition of OV tumor cells. This investigation introduces the regulatory miR‐203/BIRC5 axis in OV cancer. 35
The summary of previous studies concerning dysregulation of DEmiRs that have been already reported in OV shows in Table 1. Microarray data of DEmiRs expression are almost consistent with previous reports except miRNA‐328‐3p.
TABLE 1.
Summary of dysregulated miRNAs in different studies related to OV cancer
| Transcript | Study | Dysregulation | Methods |
|---|---|---|---|
| miRNA‐328‐3p | Wang et al 36 | Up | qRT‐PCR |
| Srivastava et al 37 | Up | qPCR, microarray analysis, luciferase reporter assay, immunoblotting, ALDH analyses, sphere‐forming assay, xenograft tumor study | |
| miRNA‐21‐3p | Báez‐Vega et al 38 | Up | qPCR, colony formation assays, in vitro invasion assay, cell viability assay, western blot analysis, luciferase assays, immunohistochemistry |
| miRNA‐133p | Liu et al 39 | Down | RT‐PCR, cell viability assay, cell proliferation assay, transwell invasion assay, western blot analysis, luciferase reporter assay |
| Yang et al 40 | Down | RT‐PCR, western blot assay, invasive and migration assays | |
| miRNA‐1294 | Guo et al 41 | Down | qRT‐PCR, cell counting kit‐8 assay, cell cycle analysis |
| Zhang et al 42 | Down | qRT‐PCR, MTT assays, wound healing, tumor invasion assays, western blot | |
| miRNA‐383‐5p | Jiang et al 43 | Down | qRT‐PCR, western blot assay, IHC, dual‐luciferase reporter assay, cell proliferation assay, Edu incorporation assay, animal models |
| miRNA‐532‐3p | Huang et al 44 | Down | RT‐qPCR, cell proliferation assay, colony formation assay, EdU incorporation assay, transwell assay, scratch wound assay, luciferase reporter gene assay, RIP assay |
| miRNA‐500b‐3p | Pandey et al 45 | Down | qRT‐PCR |
Abbreviations: ALDH, aldehyde dehydrogenase; IHC, immunohistochemistry; OV, ovarian; qPCR, quantitative PCR; RIP, RNA immunoprecipitation; RT‐PCR, real‐time polymerase chain reaction.
The co‐expression network, including 109 DEGs and their top 20 co‐expressed genes in OV tumors, indicates that ABCA8, KIFC1, ECM2, NAV3, and MAGI1 genes are most important genes in oncotranscriptomic profile. The role of these genes in pathogenesis of different cancers has been proven. ATP‐binding cassette subfamily A member 8 (ABCA8) in accordance to DAVID database is a component of plasma and mitochondrial inner membranes and participates in drug transmembrane, lipid, and xenobiotic transports (Table S4). Our in silico analysis revealed that ABCA8 is down‐regulated in OV cancer (Figure 3). Previous studies revealed ATP‐binding cassette (ABC) transporters have pivotal roles in different cancers and drug resistance. Dysregulation of ABCA8 has been documented in OV, 46 , 47 breast, and prostate cancer 48 as well as esophageal squamous cell carcinoma 49 and breast cancer. 50 Januchowski et al demonstrated that ABCA8 is down‐regulated in several drug‐resistant OV cancer cell lines. 51
Kinesin family member C1 (KIFC1) plays an indispensable performance in mitotic spindle assembly, mitotic sister chromatid segregation, and cell division (Table S4). According to previous reports, KIFC1 in people with OV cancer is overexpressed and significantly related to advanced stage and grade of tumors and patient's poor survival. 52 , 53 Also, the oncogenic role of KIFC1 in breast cancer was clarified. The suppression of this gene by poly ADP‐ribose polymerase in breast cancer cell lines and decreasing of their livability is the evidence of this claim. 54 These findings and our analyses indicate the remarkable roles of KIFC1 in oncotranscriptomic profile of ovarian cancer and its value to becoming therapeutic target. Interestingly, Zhang et al introduced an inhibitor of KIFC1 for the interdicting of its role in centrosome clustering in malignant cells that this finding accelerates the targeted cancer cell death without normal cell affection. 55
According to DAVID, the extracellular matrix protein 2 (ECM2) participates in positive regulation of cell‐matrix adhesion, axonogenesis, and extracellular matrix organization (Table S4). The high expression of ECM2 in normal OV epithelium and its down‐expression in OV tumors have been identified through gene expression profiling. 56 Result of our analysis according to TCGA and GTEx data is consistent with previous reports.
Another hub gene in the co‐expression network is neuron navigator 3 (NAV3). Its suppression in the OV cancer cell lines by miRNA‐21‐3p results in cisplatin resistance. 57 Moreover, in another study, NAV3 was identified as a target of miRNA‐429. In OV cell lines, which are transfected by miRNA‐429, NAV3 showed down‐expression and the metastatic ability of tumors reversed. 58 Our results show that this gene is significantly down‐regulated in OV cancers. Furthermore, in colon and squamous cell cancers, NAV3 copy number variations (deletion and amplification) are a common phenomenon and affects cell invasion. 59 , 60
Membrane‐associated guanylate kinase (MAGI1) plays important roles in protein complex assembly, cell adhesion, and cell surface receptor signaling pathway (Table S4). This gene shows the significant overexpression in OV tumors according to TCGA data. However, Kori et al identified MAGI1 as one of down‐expressed DEGs in their microarray findings in OV cancer samples. 61
Taken together, in oncotranscriptomic profile of OV tumors, two down‐expressed hub genes including ABCA8 and NAV3 have the key role in drug‐resistant tumors and should be monitored as long as cancer therapy is concerned.
In current study, the PPI network has been constructed which consists of DEGs in two GEO datasets and their co‐expressed genes. In this network, CDK1, PLK1, CCNB1, CCNA2, EZH2, and AURKA are considered as hub genes. All of these genes have a higher expression in OV tumors relative to normal tissues according to TCGA and GTEx data. The common targets that are present in both DEG PPI and miRNA networks were collected in Table S5. In 2017, Zhang et al showed CDK1 inhibition results in repression of cell proliferation of OV cancer cell lines. 62 Moreover, it was demonstrated that CDK1 is a target of miRNA‐490‐3p. This miRNA plays a tumor suppressive role in OV cancer cell line through inhibiting CDK1. 63 Another hub gene in the PPI network is PLK1 protein. When PLK1 is suppressed, OV cell propagation and proliferation are decreased. 64 In addition, the roles of PLK1 in the elevation of autophagy and drug resistance were elucidated in ovarian clear cell carcinoma. 65 According to Jiang et al study, the attenuation of FOXM1 and PLK1 results in reinforcing P21 amount and finally OV cell apoptosis. 66 PLK1 and CCNB1 have been introduced as downstream targets of FOXM1 TF, and all of them are overexpressed in OV tumors. 67 Both of the CCNB1 and CCNA2 are members of cyclin family genes and promote transition through G1/S and G2/M in the cell cycle. CCNA2 shows high expression in OV tumors and association with insensitivity to chemotherapy. 68 AURKA gene product is a protein kinase that shows to be involved in microtubule formation during chromosome segregation. The role of AURKA gene in the migration of OV cancer cells has been uncovered. 69 The EZH2 gene codes a histone methyltransferase which participates in histone methylation and consequently in transcriptional activity. Gain‐of‐function mutations and overexpression of EZH2 have been linked to many forms of cancer. 70 , 71
It is shown that one reason of resistance to cisplatin in OV cancer patients is activation of the cMyc/miRNA‐137/EZH2 axis. In normal cells, miR‐137 suppresses EZH2, but cMyc by trying to neutralize this inhibition reinforces the ability of resistance in malignant cells. 72 Interestingly, our investigation concerning EZH2 genetic alterations in OV tumors reveals an amplification in remarkable percentage of patients (11%). These data could justify EZH2 overexpression in a portion of OV cancer patients. Moreover, the detected protein module contains CDK1, PLK1, CCNB1, CCNA2, and EZH2. We show that this module is involved in the progression of different phases of the cell cycle. All the evidence considered, we demonstrated that CDK1, PLK1, CCNB1, CCNA2, AURKA, and EZH2 not only are hub nodes in PPI network but also are significantly overexpressed in OV tumors and could function as oncogenes. These proteins might become the efficient therapeutic targets in treatment‐resistant OV tumors.
Alisertib (MLN8237), AT9283, and CYC116 in our protein‐drug network classified in kinase inhibitors category. These anticancer compounds are able to inhibit AURKA protein. On the other hand, cyclin‐dependent kinases (CDK1) could be inhibited by Flavopiridol, Alsterpaullone, SU9516, AT7519, Olomoucine, Hymenialdisine, and indirubine‐3′‐monoxime.
In this study, we conducted a novel regulatory network of TF‐miRNA‐gene interactions in OV tumors. It reveals the role of regulatory feedback and feedforward loops in great complexity of OV tumors. This network indicates that TFs TFAP2C and GATA4 have the most interactions and are involved in feedback loops with miR‐26b. According to Cai et al report, GATA4 has lost its expression in ovarian tissues during cellular transformation and progression to malignancy. 73 In our study, for the first time, TFAP2C has been identified to be an important TF in ovarian cancer and might become both biomarker and therapeutic target. Interestingly, the expression level of miR‐26b in patients with ovarian cancer shows a significant reduction and correlates with the stage of tumors and patient's life expectancy. 74
In conclusion, in current study, we have collected and integrated different data to uncover the complex molecular interactions and oncomechanisms in OV tumors. The DEmiRs‐DEGs and dysregulated TF‐miRNA‐gene network reveal the potential interactions that could be significant pieces of OV tumors onco‐puzzle.
CONFLICT OF INTEREST
The authors declare no conflicts of interest.
AUTHOR CONTRIBUTIONS
All authors had full access to the data in the study and take responsibility for the integrity of the data and the accuracy of the data analysis. Conceptualization, S.K.; Software, S.K., F.D.; Resources, S.K., F.D.; Writing ‐ Original Draft, S.K.; Writing ‐ Review & Editing, F.D.; Supervision, J.T.‐B.; Project Administration, J.T.‐B.
ETHICAL STATMENT
Not applicable.
Supporting information
Figure S1. Boxplots of normalized data.
Table S1. The common DEGs in two datasets (GSE 119056 and GSE4122) with adj. P.value <0.05 and log FC ≥|2| which show same direction of expression.
Table S2. The red lines show DEmiRs with adj. P.value <0.05 and log FC ≥|2| in OV cancer tissues.
Table S3. Interactions of differential expressed (DE) miRNAs with DE mRNAs. The stars show applied databases for each interaction.
Table S4. Functional annotation of hub genes in co‐expression network by DAVID database.
Table S5. The common genes DEG PPI network and miRNA network.
Table S6. Dysregulated TF‐miR‐gene interations in ovarian tumors.
ACKNOWLEDGMENTS
We would like to thank the GEO, GEPIA, STRING, Enrichr, DAVID, cBioPortal, TargetScan, miRmap, KEGG mapper, miRTarBase, HOCOMOCO, TRUST, TransmiR, and RegNetwork databases, as well as Cytoscape software for free availability.
Kadkhoda S, Darbeheshti F, Tavakkoly‐Bazzaz J. Identification of dysregulated miRNAs‐genes network in ovarian cancer: An integrative approach to uncover the molecular interactions and oncomechanisms. Cancer Reports. 2020;3:e1286. 10.1002/cnr2.1286
DATA AVAILABILITY STATEMENT
The required data are provided in the supplementary tables.
REFERENCES
- 1. Reid BM, Permuth JB, Sellers TA. Epidemiology of ovarian cancer: a review. Cancer Biol Med. 2017;14(1):9‐32. 10.20892/j.issn.2095-3941.2016.0084. [DOI] [PMC free article] [PubMed] [Google Scholar]
- 2. Bray F, Ferlay J, Soerjomataram I, Siegel RL, Torre LA, Jemal A. Global cancer statistics 2018: GLOBOCAN estimates of incidence and mortality worldwide for 36 cancers in 185 countries. CA Cancer J Clin. 2018;68(6):394‐424. 10.3322/caac.21492. [DOI] [PubMed] [Google Scholar]
- 3. Burges A, Schmalfeldt B. Ovarian cancer: diagnosis and treatment. Dtsch Arztebl Int. 2011;108(38):635‐641. 10.3238/arztebl.2011.0635. [DOI] [PMC free article] [PubMed] [Google Scholar]
- 4. Mollashahi B, Aghamaleki FS, Movafagh A. The roles of miRNAs in medulloblastoma: a systematic review. J Cancer Prev. 2019;24(2):79‐90. 10.15430/JCP.2019.24.2.79. [DOI] [PMC free article] [PubMed] [Google Scholar]
- 5. Darbeheshti F, Rezaei N, Amoli MM, Mansoori Y, Tavakkoly Bazzaz J. Integrative analyses of triple negative dysregulated transcripts compared with non‐triple negative tumors and their functional and molecular interactions. J Cell Physiol. 2019;234(12):22386‐22399. 10.1002/jcp.28804. [DOI] [PubMed] [Google Scholar]
- 6. Lewis BP, Shih IH, Jones‐Rhoades MW, Bartel DP, Burge CB. Prediction of mammalian microRNA targets. Cell. 2003;115(7):787‐798. [DOI] [PubMed] [Google Scholar]
- 7. Vejnar CE, Blum M, Zdobnov EM. miRmap web: comprehensive microRNA target prediction online. Nucleic Acids Res. 2013;41(Web Server issue):W165‐W168. 10.1093/nar/gkt430. [DOI] [PMC free article] [PubMed] [Google Scholar]
- 8. Chou CH, Chang NW, Shrestha S, et al. miRTarBase 2016: updates to the experimentally validated miRNA‐target interactions database. Nucleic Acids Res. 2016;44(D1):D239‐D247. 10.1093/nar/gkv1258. [DOI] [PMC free article] [PubMed] [Google Scholar]
- 9. Shannon P, Markiel A, Ozier O, et al. Cytoscape: a software environment for integrated models of biomolecular interaction networks. Genome Res. 2003;13(11):2498‐2504. [DOI] [PMC free article] [PubMed] [Google Scholar]
- 10. Tang Z, Li C, Kang B, Gao G, Li C, Zhang Z. GEPIA: a web server for cancer and normal gene expression profiling and interactive analyses. Nucleic Acids Res. 2017;45(W1):W98‐W102. 10.1093/nar/gkx247. [DOI] [PMC free article] [PubMed] [Google Scholar]
- 11. Szklarczyk D, Morris JH, Cook H, et al. The STRING database in 2017: quality‐controlled protein‐protein association networks, made broadly accessible. 2017;45(D1):D362‐D368. 10.1093/nar/gkw937. [DOI] [PMC free article] [PubMed] [Google Scholar]
- 12. Huang DW, Sherman BT, Tan Q, et al. DAVID bioinformatics resources: expanded annotation database and novel algorithms to better extract biology from large gene lists. Nucleic Acids Res. 2007;35(Web Server issue):W169‐W175. 10.1093/nar/gkm415. [DOI] [PMC free article] [PubMed] [Google Scholar]
- 13. Kuleshov MV, Jones MR, Rouillard AD, et al. Enrichr: a comprehensive gene set enrichment analysis web server 2016 update. Nucleic Acids Res. 2016;44(W1):W90‐W97. 10.1093/nar/gkw377. [DOI] [PMC free article] [PubMed] [Google Scholar]
- 14. Bader GD, Hogue CW. An automated method for finding molecular complexes in large protein interaction networks. BMC Bioinform. 2003;4:2. [DOI] [PMC free article] [PubMed] [Google Scholar]
- 15. Kanehisa M, Sato Y. KEGG mapper for inferring cellular functions from protein sequences. Protein Sci. 2019;29:28‐35. 10.1002/pro.3711. [DOI] [PMC free article] [PubMed] [Google Scholar]
- 16. Gao J, Lindsay J, Watt S, et al. Abstract 5277: the cBioPortal for cancer genomics and its application in precision oncology. Cancer Res. 2016;76(14 Supplement):5277.27503933 [Google Scholar]
- 17. Kutmon M, Kelder T, Mandaviya P, Evelo CTA, Coort SL. CyTargetLinker: a cytoscape app to integrate regulatory interactions in network analysis. PloS One. 2013;8(12):e82160. 10.1371/journal.pone.0082160. [DOI] [PMC free article] [PubMed] [Google Scholar]
- 18. Kulakovskiy IV, Medvedeva YA, Schaefer U, et al. HOCOMOCO: a comprehensive collection of human transcription factor binding sites models. Nucleic Acids Res. 2012;41(D1):D195‐D202. 10.1093/nar/gks1089. [DOI] [PMC free article] [PubMed] [Google Scholar]
- 19. Wang J, Lu M, Qiu C, Cui Q. TransmiR: a transcription factor–microRNA regulation database. Nucleic Acids Res. 2009;38(suppl_1):D119‐D122. 10.1093/nar/gkp803. [DOI] [PMC free article] [PubMed] [Google Scholar]
- 20. Han H, Shim H, Shin D, et al. TRRUST: a reference database of human transcriptional regulatory interactions. Sci Rep. 2015;5:11432. [DOI] [PMC free article] [PubMed] [Google Scholar]
- 21. Liu ZP, Wu C, Miao H, Wu H. RegNetwork: an integrated database of transcriptional and post‐transcriptional regulatory networks in human and mouse. Database. 2015;2015:1‐12. 10.1093/database/bav095. [DOI] [PMC free article] [PubMed] [Google Scholar]
- 22. Doubeni CA, Doubeni AR, Myers AE. Diagnosis and management of ovarian cancer. Am Fam Physician. 2016;93(11):937‐944. [PubMed] [Google Scholar]
- 23. Kabekkodu SP, Shukla V, Varghese VK, et al. Cluster miRNAs and cancer: diagnostic, prognostic and therapeutic opportunities. Wiley Interdiscip Rev RNA. 2019;11:e1563. 10.1002/wrna.1563. [DOI] [PubMed] [Google Scholar]
- 24. Jia X, Wang X, Guo X, et al. MicroRNA‐124: an emerging therapeutic target in cancer. 2019;8(12):5638‐5650. 10.1002/cam4.2489. [DOI] [PMC free article] [PubMed] [Google Scholar]
- 25. Nowakowska‐Zajdel E, Mazurek U, Wierzgon J, et al. Expression of ADAM28 and IGFBP‐3 genes in patients with colorectal cancer – a preliminary report. Int J Immunopathol Pharmacol. 2013;26(1):223‐228. 10.1177/039463201302600122. [DOI] [PubMed] [Google Scholar]
- 26. Xing J, Cao G, Fu C. HMGA1 interacts with beta‐catenin to positively regulate Wnt/beta‐catenin signaling in colorectal cancer cells. Pathol Oncol Res. 2014;20(4):847‐851. 10.1007/s12253-014-9763-0. [DOI] [PubMed] [Google Scholar]
- 27. Li X, Xing J, Wang H, Yu E. The SLC34A2‐ROS‐HIF‐1‐induced up‐regulation of EZH2 expression promotes proliferation and chemo‐resistance to apoptosis in colorectal cancer. Biosci Rep. 2019;39(5):1‐14. 10.1042/BSR20180268. [DOI] [PMC free article] [PubMed] [Google Scholar]
- 28. Shyian M, Gryshkova V, Kostianets O, et al. Quantitative analysis of SLC34A2 expression in different types of ovarian tumors. Exp Oncol. 2011;33(2):94‐98. [PubMed] [Google Scholar]
- 29. Masciullo V, Baldassarre G, Pentimalli F, et al. HMGA1 protein over‐expression is a frequent feature of epithelial ovarian carcinomas. Carcinogenesis. 2003;24(7):1191‐1198. 10.1093/carcin/bgg075. [DOI] [PubMed] [Google Scholar]
- 30. Qian Y, Xia S, Feng Z. Sox9 mediated transcriptional activation of FOXK2 is critical for colorectal cancer cells proliferation. Biochem Biophys Res Commun. 2017;483(1):475‐481. 10.1016/j.bbrc.2016.12.119. [DOI] [PubMed] [Google Scholar]
- 31. Wang B, Liu G, Ding L, Zhao J, Lu Y. FOXA2 promotes the proliferation, migration and invasion, and epithelial mesenchymal transition in colon cancer. Exp Ther Med. 2018;16(1):133‐140. 10.3892/etm.2018.6157. [DOI] [PMC free article] [PubMed] [Google Scholar]
- 32. Peng Q, Qin J, Zhang Y, et al. Autophagy maintains the stemness of ovarian cancer stem cells by FOXA2. J Exp Clin Cancer Res. 2017;36(1):171. 10.1186/s13046-017-0644-8. [DOI] [PMC free article] [PubMed] [Google Scholar]
- 33. Raspaglio G, Petrillo M, Martinelli E, et al. Sox9 and Hif‐2alpha regulate TUBB3 gene expression and affect ovarian cancer aggressiveness. Gene. 2014;542(2):173‐181. 10.1016/j.gene.2014.03.037. [DOI] [PubMed] [Google Scholar]
- 34. Wang H, Zhang X, Wang L, et al. Investigation of cell free BIRC5 mRNA as a serum diagnostic and prognostic biomarker for colorectal cancer. J Surg Oncol. 2014;109(6):574‐579. 10.1002/jso.23526. [DOI] [PubMed] [Google Scholar]
- 35. Wang B, Li X, Zhao G, et al. miR‐203 inhibits ovarian tumor metastasis by targeting BIRC5 and attenuating the TGFbeta pathway. J Exp Clin Cancer Res. 2018;37(1):235. 10.1186/s13046-018-0906-0. [DOI] [PMC free article] [PubMed] [Google Scholar]
- 36. Wang W, Yin Y, Shan X, et al. The value of plasma‐based MicroRNAs as diagnostic biomarkers for ovarian cancer. Am J Med Sci. 2019;358(4):256‐267. 10.1016/j.amjms.2019.07.005. [DOI] [PubMed] [Google Scholar]
- 37. Srivastava AK, Banerjee A. Inhibition of miR‐328‐3p impairs cancer stem cell function and prevents metastasis in ovarian cancer. 2019;79(9):2314‐2326. 10.1158/0008-5472.CAN-18-3668. [DOI] [PMC free article] [PubMed] [Google Scholar]
- 38. Baez‐Vega PM, Echevarria Vargas IM, Valiyeva F, et al. Targeting miR‐21‐3p inhibits proliferation and invasion of ovarian cancer cells. Oncotarget. 2016;7(24):36321‐36337. [DOI] [PMC free article] [PubMed] [Google Scholar]
- 39. Liu X, Li G. MicroRNA‐133b inhibits proliferation and invasion of ovarian cancer cells through Akt and Erk1/2 inactivation by targeting epidermal growth factor receptor. Int J Clin Exp Pathol. 2015;8(9):10605‐10614. [PMC free article] [PubMed] [Google Scholar]
- 40. Yang L, Hou J, Cui XH, Suo LN, Lv YW. MiR‐133b regulates the expression of CTGF in epithelial‐mesenchymal transition of ovarian cancer. Eur Rev Med Pharmacol Sci. 2017;21(24):5602‐5609. [DOI] [PubMed] [Google Scholar]
- 41. Guo TY, Xu HY, Chen WJ, Wu MX, Dai X. Downregulation of miR‐1294 associates with prognosis and tumor progression in epithelial ovarian cancer. Eur Rev Med Pharmacol Sci. 2018;22(22):7646‐7652. [DOI] [PubMed] [Google Scholar]
- 42. Zhang Y, Huang S, Guo Y, Li L. MiR‐1294 confers cisplatin resistance in ovarian cancer cells by targeting IGF1R. Biomed Pharmacother. 2018;106:1357‐1363. 10.1016/j.biopha.2018.07.059. [DOI] [PubMed] [Google Scholar]
- 43. Jiang J, Xie C, Liu Y, et al. Up‐regulation of miR‐383‐5p suppresses proliferation and enhances chemosensitivity in ovarian cancer cells by targeting TRIM27. Biomed Pharmacother. 2019;109:595‐601. 10.1016/j.biopha.2018.10.148. [DOI] [PubMed] [Google Scholar]
- 44. Huang K, Fan WS, Fu XY, Li YL, Meng YG. Long noncoding RNA DARS‐AS1 acts as an oncogene by targeting miR‐532‐3p in ovarian cancer. Eur Rev Med Pharmacol Sci. 2019;23(6):2353‐2359. [DOI] [PubMed] [Google Scholar]
- 45. Pandey R, Woo HH, Varghese F, Zhou M, Chambers SK. Circulating miRNA profiling of women at high risk for ovarian cancer. Transl Oncol. 2019;12(5):714‐725. 10.1016/j.tranon.2019.01.006. [DOI] [PMC free article] [PubMed] [Google Scholar]
- 46. Hedditch EL, Gao B, Russell AJ, et al. ABCA transporter gene expression and poor outcome in epithelial ovarian cancer. J Natl Cancer Inst. 2014;106(7):1‐11. 10.1093/jnci/dju149. [DOI] [PMC free article] [PubMed] [Google Scholar]
- 47. Liu X, Gao Y, Zhao B, et al. Discovery of microarray‐identified genes associated with ovarian cancer progression. Int J Oncol. 2015;46(6):2467‐2478. 10.3892/ijo.2015.2971. [DOI] [PubMed] [Google Scholar]
- 48. Demidenko R, Razanauskas D, Daniunaite K, Lazutka JR, Jankevicius F, Jarmalaite S. Frequent down‐regulation of ABC transporter genes in prostate cancer. BMC Cancer. 2015;15:683. 10.1186/s12885-015-1689-8. [DOI] [PMC free article] [PubMed] [Google Scholar]
- 49. Xu CQ, Zhu ST, Wang M, et al. Pathway analysis of differentially expressed genes in human esophageal squamous cell carcinoma. Eur Rev Med Pharmacol Sci. 2015;19(9):1652‐1661. [PubMed] [Google Scholar]
- 50. Chen L, Ye C, Huang Z, et al. Differentially expressed genes and potential signaling pathway in Asian people with breast cancer by preliminary analysis of a large sample of the microarray data. Nan Fang Yi Ke Da Xue Xue Bao. 2014;34(6):807‐812. [PubMed] [Google Scholar]
- 51. Januchowski R, Zawierucha P, Andrzejewska M, Ruciński M, Zabel M. Microarray‐based detection and expression analysis of ABC and SLC transporters in drug‐resistant ovarian cancer cell lines. Biomed Pharmacother. 2013;67(3):240‐245. 10.1016/j.biopha.2012.11.011. [DOI] [PubMed] [Google Scholar]
- 52. Mittal K, Choi DH, Klimov S, et al. A centrosome clustering protein, KIFC1, predicts aggressive disease course in serous ovarian adenocarcinomas. J Ovarian Res. 2016;9:17. 10.1186/s13048-016-0224-0. [DOI] [PMC free article] [PubMed] [Google Scholar]
- 53. Pawar S, Donthamsetty S, Pannu V, et al. KIFCI, a novel putative prognostic biomarker for ovarian adenocarcinomas: delineating protein interaction networks and signaling circuitries. J Ovarian Res. 2014;7:53. 10.1186/1757-2215-7-53. [DOI] [PMC free article] [PubMed] [Google Scholar]
- 54. Li Y, Lu W, Chen D, et al. KIFC1 is a novel potential therapeutic target for breast cancer. Cancer Biol Ther. 2015;16(9):1316‐1322. 10.1080/15384047.2015.1070980. [DOI] [PMC free article] [PubMed] [Google Scholar]
- 55. Zhang W, Zhai L, Wang Y, et al. Discovery of a novel inhibitor of kinesin‐like protein KIFC1. Biochem J. 2016;473(8):1027‐1035. 10.1042/BJ20150992. [DOI] [PMC free article] [PubMed] [Google Scholar]
- 56. Santin AD, Zhan F, Bellone S, et al. Gene expression profiles in primary ovarian serous papillary tumors and normal ovarian epithelium: identification of candidate molecular markers for ovarian cancer diagnosis and therapy. Int J Cancer. 2004;112(1):14‐25. 10.1002/ijc.20408. [DOI] [PubMed] [Google Scholar]
- 57. Pink RC, Samuel P, Massa D, Caley DP, Brooks SA, Carter DRF. The passenger strand, miR‐21‐3p, plays a role in mediating cisplatin resistance in ovarian cancer cells. Gynecol Oncol. 2015;137(1):143‐151. 10.1016/j.ygyno.2014.12.042. [DOI] [PubMed] [Google Scholar]
- 58. Chen J, Wang L, Matyunina LV, Hill CG, McDonald JF. Overexpression of miR‐429 induces mesenchymal‐to‐epithelial transition (MET) in metastatic ovarian cancer cells. Gynecol Oncol. 2011;121(1):200‐205. 10.1016/j.ygyno.2010.12.339. [DOI] [PubMed] [Google Scholar]
- 59. Carlsson E, Ranki A, Sipila L, et al. Potential role of a navigator gene NAV3 in colorectal cancer. Br J Cancer. 2012;106(3):517‐524. 10.1038/bjc.2011.553. [DOI] [PMC free article] [PubMed] [Google Scholar]
- 60. Maliniemi P, Carlsson E, Kaukola A, et al. NAV3 copy number changes and target genes in basal and squamous cell cancers. Exp Dermatol. 2011;20(11):926‐931. 10.1111/j.1600-0625.2011.01358.x. [DOI] [PubMed] [Google Scholar]
- 61. Kori M, Gov E, Arga KY. Molecular signatures of ovarian diseases: insights from network medicine perspective. Syst Biol Reprod Med. 2016;62(4):266‐282. 10.1080/19396368.2016.1197982. [DOI] [PubMed] [Google Scholar]
- 62. Zhang R, Shi H, Ren F, et al. The aberrant upstream pathway regulations of CDK1 protein were implicated in the proliferation and apoptosis of ovarian cancer cells. J Ovarian Res. 2017;10(1):60. 10.1186/s13048-017-0356-x. [DOI] [PMC free article] [PubMed] [Google Scholar]
- 63. Wang LL, Sun KX, Wu DD, et al. DLEU1 contributes to ovarian carcinoma tumourigenesis and development by interacting with miR‐490‐3p and altering CDK1 expression. 2017;21(11):3055‐3065. 10.1111/jcmm.13217. [DOI] [PMC free article] [PubMed] [Google Scholar]
- 64. Ma S, Rong X, Gao F, Yang Y, Wei L. TPX2 promotes cell proliferation and migration via PLK1 in OC. Cancer Biomark. 2018;22(3):443‐451. 10.3233/CBM-171056. [DOI] [PubMed] [Google Scholar]
- 65. Chan KK, Wong OG, Wong ES, et al. Impact of iASPP on chemoresistance through PLK1 and autophagy in ovarian clear cell carcinoma. Int J Cancer. 2018;143(6):1456‐1469. 10.1002/ijc.31535. [DOI] [PubMed] [Google Scholar]
- 66. Jiang L, Cao XC, Cao JG, et al. Casticin induces ovarian cancer cell apoptosis by repressing FoxM1 through the activation of FOXO3a. Oncol Lett. 2013;5(5):1605‐1610. 10.3892/ol.2013.1258. [DOI] [PMC free article] [PubMed] [Google Scholar]
- 67. Integrated genomic analyses of ovarian carcinoma. Nature. 2011;474(7353):609‐615. 10.1038/nature10166. [DOI] [PMC free article] [PubMed] [Google Scholar]
- 68. Do TV, Xiao F, Bickel LE, et al. Aurora kinase a mediates epithelial ovarian cancer cell migration and adhesion. Oncogene. 2014;33(5):539‐549. 10.1038/onc.2012.632. [DOI] [PMC free article] [PubMed] [Google Scholar]
- 69. Ju W, Yoo BC, Kim IJ, Kim JW, Kim SC, Lee HP. Identification of genes with differential expression in chemoresistant epithelial ovarian cancer using high‐density oligonucleotide microarrays. Oncol Res. 2009;18(2–3):47‐56. [DOI] [PubMed] [Google Scholar]
- 70. Yoo KH, Hennighausen L. EZH2 methyltransferase and H3K27 methylation in breast cancer. Int J Biol Sci. 2012;8(1):59‐65. 10.7150/ijbs.8.59. [DOI] [PMC free article] [PubMed] [Google Scholar]
- 71. Zingg D, Debbache J, Schaefer SM, et al. The epigenetic modifier EZH2 controls melanoma growth and metastasis through silencing of distinct tumour suppressors. Nat Commun. 2015;6:6051. 10.1038/ncomms7051. [DOI] [PubMed] [Google Scholar]
- 72. Sun J, Cai X, Yung MM, et al. miR‐137 mediates the functional link between c‐Myc and EZH2 that regulates cisplatin resistance in ovarian cancer. Oncogene. 2019;38(4):564‐580. 10.1038/s41388-018-0459-x. [DOI] [PMC free article] [PubMed] [Google Scholar] [Retracted]
- 73. Cai KQ, Caslini C, Capo‐chichi CD, et al. Loss of GATA4 and GATA6 expression specifies ovarian cancer histological subtypes and precedes neoplastic transformation of ovarian surface epithelia. PLoS One. 2009;31(4):7, e6454. 10.1371/journal.pone.0006454. [DOI] [PMC free article] [PubMed] [Google Scholar]
- 74. Song KW, Zhang QG, Tan WB, Fang YN. Diagnostic significance of serum miR‐26b and miR‐21 expressions in ovarian cancer and their associations with clinicopathological characteristics and prognosis of patients. Eur Rev Med Pharmacol Sci. 2020;24(4):1697‐1703. 10.26355/eurrev_202002_20344. [DOI] [PubMed] [Google Scholar]
Associated Data
This section collects any data citations, data availability statements, or supplementary materials included in this article.
Supplementary Materials
Figure S1. Boxplots of normalized data.
Table S1. The common DEGs in two datasets (GSE 119056 and GSE4122) with adj. P.value <0.05 and log FC ≥|2| which show same direction of expression.
Table S2. The red lines show DEmiRs with adj. P.value <0.05 and log FC ≥|2| in OV cancer tissues.
Table S3. Interactions of differential expressed (DE) miRNAs with DE mRNAs. The stars show applied databases for each interaction.
Table S4. Functional annotation of hub genes in co‐expression network by DAVID database.
Table S5. The common genes DEG PPI network and miRNA network.
Table S6. Dysregulated TF‐miR‐gene interations in ovarian tumors.
Data Availability Statement
The required data are provided in the supplementary tables.


