

Abstract
With the circulation of wild poliovirus (WPV) types 1 and 3 continuing more than a decade after the original goal of eradicating all three types of WPVs by 2000, policymakers consider many immunization options as they strive to stop transmission in the remaining endemic and outbreak areas and prevent reintroductions of live polioviruses into non-endemic areas. While polio vaccination choices may appear simple, our analysis of current options shows remarkable complexity. We offer important context for current and future polio vaccine decisions and policy analyses by developing decision trees that clearly identify potential options currently used by countries as they evaluate national polio vaccine choices. Based on a comprehensive review of the literature we (1) identify the current vaccination options that national health leaders consider for polio vaccination, (2) characterize current practices and factors that appear to influence national and international choices, and (3) assess the evidence of vaccine effectiveness considering sources of variability between countries and uncertainties associated with limitations of the data. With low numbers of cases occurring globally, the management of polio risks might seem like a relatively low priority, but stopping live poliovirus circulation requires making proactive and intentional choices to manage population immunity in the remaining endemic areas and to prevent reestablishment in non-endemic areas. Our analysis shows remarkable variability in the current national polio vaccine product choices and schedules, with combination vaccine options containing inactivated poliovirus vaccine (IPV) and different formulations of oral poliovirus vaccine (OPV) making choices increasingly difficult for national health leaders.
Introduction
Launched in 1988, the Global Polio Eradication Initiative (GPEI) successfully eradicated wild poliovirus (WPV) type 2 (WPV2) in 1999.(1,2) However, in spite of intensive efforts to achieve the eradication of all three types of WPVs and interruption of transmission in India in early 2011, through 2012 types 1 and 3 (WPV1 and WPV3) continued to circulate in parts of three endemic countries (Afghanistan, Nigeria, and Pakistan).(3,4) Endemic countries export viruses to other countries, which caused outbreaks and in some cases led to sustained re-established transmission in other countries (e.g., Angola, Chad and Democratic Republic of the Congo, which sometimes also got exported).(3) Figure 1(a) shows the progress made toward the eradication of WPV types 1 and 3 since 2000 and the decline in the number of endemic countries that reported confirmed cases (red boxes), with the designation of endemic referring to countries that never completely interrupted indigenous transmission of all WPVs within their national borders. Figure 1a also shows the number of non-endemic countries (blue diamonds) that experienced an outbreak (defined as one or more cases of paralytic polio) due to reintroduced WPV1 or WPV3 and Table 1 lists the more than 50 countries that reported WPV cases between 2000 and 2012.(3-5) Figure 1(b) shows the distribution of the countries listed in Table 1 according to the total number of years in which they reported cases between 2000 and 2012 (cases officially reported through January 2, 2013).(3) Outbreaks that persist for >12 months imply re-established transmission. In 2010, an outbreak in Tajikistan,(7) which also impacted Turkmenistan, Kazakhstan, and the Russian Federation, demonstrated the ability of the WPVs to infect susceptible individuals far from endemic areas, sequentially spread, and cause outbreaks in polio-free countries, and underscored the need for vigilance in both vaccination and surveillance.(8,9)
Figure 1.


Number of countries (a) reporting cases of wild polioviruses (WPVs) by year and endemic status and (b) distribution of number of years individual countries reported cases between 2000 and 2012.(3)
Table 1.
| Country | Endemic until |
Endemic (E) years WPV cases reported |
Non-endemic (N) years WPV cases reported* |
Total years E/N |
Latest WPV3 |
Latest WPV1 |
|---|---|---|---|---|---|---|
| Afghanistan | Endemic | 2000-2012 | 13/0 | 11-Apr-10 | 25-Nov-12 | |
| Nigeria | Endemic | 2000-2012 | 13/0 | 10-Nov-12 | 20-Nov-12 | |
| Pakistan | Endemic | 2000-2012 | 13/0 | 18-Apr-12 | 20-Nov-12 | |
| India | 2011 | 2000-2011 | 12/0 | 22-Oct-10 | 13-Jan-11 | |
| Niger** | 2006 | 2000-2006 | 2007-2012 | 7/6 | 30-Oct-11 | 15-Nov-12 |
| Egypt** | 2006 | 2000-2004 | 5/0 | 7-Dec-00 | 3-May-04 | |
| Somalia | 2003 | 2000-2003 | 2005-2007 | 3/3 | 6-Oct-02 | 25-Mar-07 |
| Angola | 2002 | 2000-2001 | 2005-2011 | 2/7 | 17-Nov-08 | 7-Jul-11 |
| Sudan | 2002 | 2000-2001 | 2004, 2005, 2007-2009 | 2/5 | 16-Dec-08 | 27-Jun-09 |
| Ethiopia | 2002 | 2000-2001 | 2004-2006, 2008 | 2/4 | NA | 27-Apr-08 |
| Chad | 2001 | 2000 | 2003-2012 | 1/10 | 10-Mar-11 | 14-Jun-12 |
| DRC | 2001 | 2000 | 2006-2011 | 1/6 | 24-Jun-09 | 20-Dec-11 |
| Nepal | 2001 | 2000 | 2005-2008, 2010 | 1/5 | 15-Oct-08 | 30-Aug-10 |
| Côte d'Ivoire | 2001 | 2000 | 2003, 2004, 2008, 2009, 2011 | 1/5 | 24-Jul-11 | 6-Aug-09 |
| CAR | 2001 | 2000 | 2003, 2004, 2008, 2009, 2011 | 1/5 | 9-Aug-09 | 8-Dec-11 |
| Benin | 2001 | 2000 | 2003, 2004, 2008, 2009 | 1/4 | 1-Dec-08 | 19-Apr-09 |
| Ghana | 2001 | 2000 | 2003, 2008 | 1/2 | NA | 8-Nov-08 |
| Congo | 2001 | 2000 | 2010-2011 | 1/2 | 29-Sep-00 | 22-Jan-11 |
| Bangladesh | 2001 | 2000 | 2006 | 1/1 | 23-Oct-99 | 22-Nov-06 |
| Iraq | 2000 | 2000 | 1/0 | NA | 28-Jan-00 | |
| Mali | <2000 | 2004, 2005, 2008-2011 | 0/6 | 23-Jun-11 | 1-May-10 | |
| Burkina Faso | <2000 | 2002-2004, 2008, 2009 | 0/5 | NA | 25-Oct-09 | |
| Cameroon | <2000 | 2003-2006, 2009 | 0/5 | 15-Oct-09 | 6-Dec-06 | |
| Guinea | <2000 | 2004, 2009, 2011 | 0/3 | 3-Aug-11 | 3-Nov-09 | |
| Kenya | <2000 | 2006, 2009, 2011 | 0/3 | NA | 30-Jul-11 | |
| Mauritania§ | <2000 | 2001, 2009, 2010 | 0/3 | NA | 28-Apr-10 | |
| Togo | <2000 | 2003, 2008, 2009 | 0/3 | NA | 28-Mar-09 | |
| Indonesia | <2000 | 2005, 2006 | 0/2 | NA | 20-Feb-06 | |
| Liberia | <2000 | 2009, 2010 | 0/2 | NA | 8-Sep-10 | |
| Myanmar | <2000 | 2000, 2007 | 0/2 | NA | 28-May-07 | |
| Sierra Leone | <2000 | 2009, 2010 | 0/2 | NA | 28-Feb-10 | |
| Uganda | <2000 | 2009, 2010 | 0/2 | NA | 15-Nov-10 | |
| Yemen | <2000 | 2005, 2006 | 0/2 | NA | 2-Feb-06 | |
| Zambia | <2000 | 2001, 2002 | 0/2 | NA | 27-Feb-02 | |
| Algeria | <2000 | 2001 | 0/1 | NA | 13-Oct-01 | |
| Botswana | <2000 | 2004 | 0/1 | NA | 8-Feb-04 | |
| Bulgaria | <2000 | 2001 | 0/1 | NA | 24-Apr-01 | |
| Burundi | <2000 | 2009 | 0/1 | NA | 12-Sep-09 | |
| Cape Verde | <2000 | 2000 | 0/1 | NA | 13-Dec-00 | |
| China | <2000 | 2011 | 0/1 | NA | 9-Oct-11 | |
| Eritrea | <2000 | 2005 | 0/1 | NA | 23-Apr-05 | |
| Gabon | <2000 | 2011 | 0/1 | NA | 15-Jan-11 | |
| Georgia | <2000 | 2001 | 0/1 | NA | 2-Sep-01 | |
| Iran | <2000 | 2000 | 0/1 | NA | 18-Dec-00 | |
| Kazakhstan | <2000 | 2010 | 0/1 | NA | 12-Aug-10 | |
| Lebanon | <2000 | 2003 | 0/1 | NA | 23-Jan-03 | |
| Namibia | <2000 | 2006 | 0/1 | NA | 26-Jun-06 | |
| Russian Federation | <2000 | 2010 | 0/1 | NA | 25-Sep-10 | |
| Saudi Arabia | <2000 | 2004 | 0/1 | NA | 17-Dec-04 | |
| Senegal | <2000 | 2010 | 0/1 | NA | 30-Apr-10 | |
| Tajikistan | <2000 | 2010 | 0/1 | NA | 4-Jul-10 | |
| Turkmenistan | <2000 | 2010 | 0/1 | NA | 28-Jun-10 |
NA indicates onset of most recent case occurred prior to 2000
<2000 indicates country declared non-endemic before 2000
All cases are importation related
In 2005, no endemic circulation occurred in Egypt or Niger but their status remained endemic, all cases in Niger from 2005 onward relate to importations
2001 wild virus of unknown origin; 2009-2010 viruses are importation related
Table 2 lists countries that reported cases of a circulating vaccine-derived poliovirus (cVDPV), which can emerge when oral poliovirus vaccine (OPV) coverage levels become sufficiently low to allow susceptible individuals to continue to transmit infections.(10-12) This risk of cVDPVs represents a significant concern for post-eradication risk management, and in order to completely end all cases of paralytic poliomyelitis, ultimately the world will need to coordinate the cessation of OPV.(13-16)
Table 2.
Countries that reported circulation vaccine-derived poliovirus (cVDPV) cases associated with 2 or more cases of acute flaccid paralysis (AFP) since 2000, cVDPV type, years of cases reported, dates of last reported outbreak case and total paralytic polio cases as of January 2 2013.(10,11)
| Country | cVDPV type | Years with cVPDV cases | Latest case | Total cases |
|---|---|---|---|---|
| Afghanistan | 2 | 2010, 2011,2012 | 15-Nov-12 | 9 |
| Cambodia | 3 | 2005, 2006 | 15-Jan-06 | 2 |
| Chad* | 2 | 2010 | 10-Nov-10 | 1 |
| Chad | 2 | 2012 | 20-Oct-12 | 12 |
| China | 1 | 2004 | 11-Nov-04 | 2 |
| DOR/Haiti | 1 | 2000-2001 | 12-Jul-01 | 21 |
| DRC | 2 | 2008-2012 | 04-Apr-12 | 64 |
| Ethiopia | 3 | 2009-2010 | 4-Nov-10 | 7 |
| Ethiopia | 2 | 2008-2009 | 16-Feb-09 | 4 |
| India | 2 | 2009, 2010 | 18-Jan-10 | 17 |
| Indonesia | 1 | 2005 | 26-Oct-05 | 46 |
| Kenya* | 2 | 2012 | 25-Jun-12 | 1 |
| Madagascar | 2 | 2005 | 13-Jul-05 | 3 |
| Madagascar | 2 | 2001-2 | 30-Apr-02 | 5 |
| Mozambique | 1 | 2011 | 2-Jun-11 | 2 |
| Myanmar | 1 | 2006, 2007 | 6-Dec-07 | 5 |
| Niger* | 2 | 2010-2011 | 11-Nov-11 | 4 |
| Niger* | 2 | 2006 | 3-Oct-06 | 2 |
| Nigeria | 2 | 2005-2012 | 16-Aug-12 | 381 |
| Pakistan | 2 | 2012 | 4-Nov-12 | 12 |
| Philippines | 1 | 2001 | 26-Jul-01 | 3 |
| Somalia | 2 | 2008-2012 | 23-Jul-12 | 18 |
| Yemen | 2 | 2011 | 5-Oct-11 | 9 |
Niger 2006, 2010, Chad 2010, and Kenya 2012 cVDPVs are linked to the outbreak in Nigeria
Nigeria experienced multiple separate initiating events(12)
Achieving eradication of WPVs requires eliminating their circulation everywhere contemporaneously, which requires all countries to protect large proportions of their populations with a poliovirus vaccine.(17,18) Delays in achieving the eradication of WPVs increase costs. Dynamic disease and economic modeling helped national and global policy makers appreciate the strong economic justification for global polio eradication,(19,20) the reality that control is neither risk nor cost-free,(21) and issues related to post-eradication policies and decisions.(14-16,21-31) Countries face increasing complexity as they select their poliovirus vaccine(s) for national use, particularly with the current availability of monovalent OPV (mOPV) and bivalent OPV (bOPV) formulations and changing formulations for inactivated poliovirus vaccine (IPV). Global discussions about OPV cessation options also impact national choices.(16)
The most recent World Health Organization (WHO) recommendations about routine vaccination strategies focus on the potential for importation and transmission of WPVs,(32) and they provide limited guidance to help countries manage their population immunity. We recognize that choices of poliovirus vaccine and schedule represent national decisions, and based on a comprehensive review of the literature, we: (1) identify the current vaccination options that national health leaders face for polio vaccination, (2) characterize current practices and identify factors that appear to influence national and international choices, and (3) assess the evidence of vaccine effectiveness considering sources of variability between countries and uncertainties associated with limitations of the data.
Methods
To characterize current national poliovirus vaccine choices and potential options, we reviewed the existing national schedules reported to the WHO.(33) Similar to the approach we used to explore post-eradication policy options(21) and global policy options,(16) we developed decision trees that identify categories of current policies and list the possible decision options within those categories from the perspective of a national policy maker. In the process of reviewing the literature and developing decision trees to summarize the options, we identified a number of critical factors that may influence policy choices, including vaccine performance.
We comprehensively reviewed the evidence related to vaccine performance measured as the seroconversion achieved as a function of vaccine formulation and schedule. We focused on seroconversion data as opposed to seropositivity endpoints from clinical trials because seroconversion provides the most controlled measure of the fraction of vaccine recipients that becomes protected from poliomyelitis disease, presumably for life.(34) Seroconversion measures the probability that an individual experiences an immunological response from the vaccine (i.e., take), although we emphasize that it does not address protection from asymptomatic infection and transmission to provide population immunity, which represents another essential consideration for vaccine policy choices.(11,35) In contrast, seropositivity measured prior exposure to vaccine or live viruses may reflect some level of pre-existing immunity either from residual maternal antibodies (particularly in the case of vaccines administered shortly after birth) or natural exposure to live polioviruses, including WPV and OPV-related viruses excreted by OPV recipients (particularly in WPV-endemic settings or settings of intense OPV use).
We searched PubMed titles and abstracts using the keywords “polio” or “poliovirus” and “seroconversion,” “efficacy,” “antibodies,” “immunogenicity,” “response,” or “trial” and found 2,654 articles published in English between January 1, 1978 and December 31, 2012 and we reviewed unpublished reports and guidelines provided by the US Centers for Disease Control and Prevention (CDC) and the WHO. We excluded studies published before 1978 because the current enhanced-potency IPV (eIPV) did not become available until the late 1970s(36) and we wanted to rely on reasonably recent serology methods. Based on abstract review from this search and references cited in previously published reviews of the two vaccines,(36-38) we identified 266 studies published in English that potentially provided seroconversion results. We excluded 158 studies that did not report seroconversion results and instead mainly reported seropositivity levels and/or (geometric) mean antibody titers after vaccination. We also excluded 42 studies that we could not obtain, 9 studies that reviewed or included data from other studies, and 6 studies that only considered the effect of booster doses or cumulative seroconversion after more than 4 doses. We also excluded studies that provided only results for fewer than 20 subjects (n=3), considered only non-enhanced-potency IPV (n=2), or provided only class-specific seroconversion results (i.e., IgA) (n=1), which left 45 studies to code in our analysis. We extracted seroconversion results from these studies, in some cases using our judgment to determine whether to separately list or combine arms in the case of groups with relatively small differences (i.e., stratifications reported in studies include different schedules, vaccine formulations, levels of pre-existing (maternal) antibodies, risk groups, and/or administration with other vaccines or drugs). Consistent with a review of monovalent vaccines,(39) we stratified by temperate versus non-temperate climate settings as a rough proxy for many factors that may affect seroconversion rates in different places (e.g., prevalence of enteroviruses and enteric bacteria, SES, climate, quality of vaccine delivery systems, level of maternal immunity, genetics).(37)
In the process of reviewing the existing quantitative seroconversion evidence, we assessed the data quality and identified data gaps and significant sources of uncertainty. Notably, we assigned grades that provide information about seroconversion rates for the current vaccine formulations. We evaluated various grading options,(40,41) and eventually collapsed our assessments into three grades. We assigned a grade of 1 if the study used the current formulation of the vaccine and appropriate methods. As discussed by Patriarca et al.(37) changing the ratio of the three vaccine components in a trivalent formulation may alter responses, and could effectively impact the immunogenicity of tOPV. Similarly, the potency of eIPV matters, and some studies considered eIPV vaccines with lower potency than the current standard of 40, 8, and 32 D-antigen units for types 1, 2, and 3, respectively, or considered the fractional eIPV vaccines.(42-45) Thus, we placed the most weight in our assessment on the vaccine formulation and the information that it provides for the current vaccines. We assigned a grade of 2 if the study did not use the current formulation of the vaccine (i.e., 10:1:6 for tOPV, 10:6 for bOPV, and 40:8:32 for eIPV), but otherwise used appropriate methods. We assigned a grade of 3 if we identified methodological issues that led to questions about the reliability of the data or the study did not report sufficient information to determine the adequacy of the serological methods. We consider serology methods inadequate if they use an antibody titer of <1:4 or >1:10 as the minimum titer for seropositivity, if they do not define seroconversion (in initially seropositive subjects) by a fourfold rise in antibody titers, or if they include the decay of maternal antibody titers for vaccine schedules that administer the first dose before 3 months of age. Although the laboratory procedures, assays, and reference strains used also may affect the results,(46,47) we did not consider this limitation because in many studies we could not determine whether the methods conformed to current standards. We also did not include the design of the study as a factor in the grading.
Results
We identified the policy options for the two main components of immunization strategies that countries use to increase population immunity: routine immunization and supplemental immunization activities (SIAs). Countries continue to evaluate their policies and change their schedules as vaccine options change, and we see an increasing shift toward IPV adoption, particularly in the context of using combination vaccines. As countries consider the impact of switching from OPV to IPV for routine vaccination to avoid cases of VAPP or as OPV cessation approaches,(14,16) they may consider sequential schedules of IPV and OPV, multiple different IPV formulations in combined and uncombined forms, costs, and different potential delivery schedules and dosing regimens (e.g., fractional doses). Notably, IPV use initiated before global WPV eradication may influence national immunization choices for the transition and post-eradication time periods (e.g., current IPV-using countries will most likely continue their use after global eradication, at least for some period of time).(16,21) We explicitly include and examine the potential role of SIAs as a strategy that countries use to enhance disease control and population immunity,(9) and we cover the options for countries from the perspective of both developing and developed countries, which go beyond the topic of routine immunization covered in the WHO position paper.(34) Since achieving high levels of population immunity in many countries requires the use of SIAs and countries differ significantly in their experiences, we emphasize the importance of national leaders considering all of the relevant options.(9)
Routine Immunization
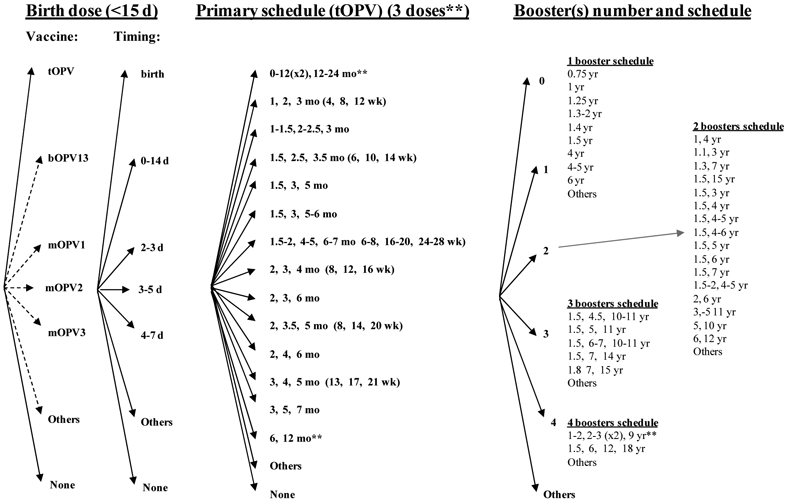
The categories of choices for routine vaccination include deciding whether to include a birth dose, selecting the timing for it, selecting the specific type(s) of vaccine for use in primary immunization and for boosters, determining the formulation(s) and method(s) of delivery, determining a primary immunization number of doses and schedule, and number and timing for booster doses, as shown in Figure 2. Routine immunization represents a planned activity, accounting for an expected part of an annual national health budget and relying on access to vaccine based on contractual relationships that generally ensure a secure supply (i.e., at least in the absence of any disruptions in production). In order to ensure supply, countries may also wish to support the development of a vaccine stockpile.(48) National health leaders may constrain vaccine and schedule choices by the availability of sufficient supplies of the various types of vaccine products licensed within the country, cost, and the schedules of other vaccines they might wish to administer during the same times. Given that tOPV contains three different and competing serotypes of live poliovirus and that IPV (i.e., also a trivalent vaccine) induces a prime-boost type of immune response, individuals must receive multiple doses of poliovirus-containing vaccines, with delivery of the doses containing multiple serotypes occurring at intervals of 4 or more weeks. Thus, routine immunization requires multiple contacts with health services, with the vaccine administration time and costs and parental preferences for fewer needle sticks representing important considerations for any national health system. Countries continue to gradually move toward the use of combination IPV products (e.g., DTaPIPV, DTaPHibIPV, DTaPHepIPV, DTaPHibHepBIPV) or parallel administration of OPV along with one or more other vaccines (e.g., bacille Calmette-Guerin (BCG), DTP, HepB, measles, Hib, and rotavirus) during a child visit. These shifts continue to impact the availability of vaccine products, including access to stand alone IPV, which could potentially impact national choices related to outbreak response.(48)
Figure 2: Decision tree of national poliovirus routine immunization policy choices*.

* Some countries that use OPV apply exclusion criteria from OPV vaccination and use IPV for the small number excluded individuals.
Over 50 countries currently include a birth dose (or zero dose) of OPV in their schedules, because the birth dose may induce early protection, improve the seroconversion rates of subsequent doses, and protect against VAPP by providing a first dose when many infants still benefit from protection from maternal antibodies.(32,49) Maternal antibodies interfere with IPV, and consequently the WHO does not recommend the use of IPV for a birth dose or for children under 6 weeks of age (i.e., maternal antibodies probably explain the reduced efficacy observed with IPV vaccination given at 6 weeks compared to 2 months). (50-52) Thus, Figure 2 only includes OPV as an option for the birth dose. All countries that include a birth dose in their schedule use tOPV, but in Figure 2 we include other theoretical options (e.g., bOPV, mOPV) and we use dashed lines to indicate these. The rapid changes occurring in the poliovirus-containing vaccine market suggest that countries will most likely continue to consider new options not currently represented in the Figure (and subsequent figures), so we included “Others” as a reminder that at any time other options may become available. We define primary vaccination as the first three doses of polio vaccination received after 3 weeks of age. To allow for consistent comparisons, we define boosters as any doses received after the primary schedule, although we note that this includes some doses given to children under 2 years of age that might not represent optimal timing for boosters,(53) and that some countries might count as a fourth dose in their primary schedule.
Although Figure 2 shows numerous permutations of vaccine choices for routine immunization, currently countries only use the trivalent formulations (i.e., tOPV, IPV stand alone or in a combined formulation, or sequential schedules involving both). The selection of vaccine strongly correlates with income, with lower-income countries using tOPV and higher-income countries using IPV-containing vaccines to avoid VAPP. Figure 2 includes the other options to emphasize that countries may consider other choices, but the reasons for using trivalent formulations for routine immunization stem from the need to provide protection from all types of live polioviruses that pose a potential threat. Although WPV2 disappeared from indigenous circulation in 1999, the threat of type 2 cVDPVs represents a real issue (Table 2). Thus, until the point of coordinated cessation of one or more OPVs (e.g., tOPV or all formulations containing OPV type 2), routine immunization programs must protect individuals from all three serotypes.(16) Following the successful eradication of any single WPV type, which already occurred with WPV2, global health leaders may consider the option of ceasing the use of OPV of the eradicated type(s).(16) However, such an action must be coordinated globally and should only occur after (1) disruption of transmission of any currently circulating cVDPV viruses of that type, (2) development of appropriate outbreak response plans, and (3) creation of a mOPV stockpile of that type that can be used to rapidly respond to any cVDPV outbreak.(15,16,54)
The WHO position paper recommended that countries continue to follow their established national schedules and use tOPV for routine immunization, unless they have high socioeconomic status (SES), tertiary sewage treatment systems, and DTP3 coverage >90-95%, in which case the recommendations include the options of schedules using IPV only, sequential IPV/tOPV, sequential tOPV/IPV, or tOPV.(32) Given the complexity of the existing choices, we depict the options related to using: (1) only tOPV and (2) any IPV in the national routine immunization schedule (including sequential schedules) in Figures 3 and 4, respectively, which include the very large spectrum of options countries currently use.(33) Many countries that only list OPV for their official routine immunization schedule apply specific exclusion criteria, particularly related to immunocompromised individuals, and they use IPV to vaccinate the small number of individuals who meet the criteria. Table 3 indicates the numbers of countries that include such exclusion criteria and those that do not by schedule, and it also shows the total number of countries using the indicated primary schedules that also give a birth dose of tOPV. Although the private market may provide IPV in countries that only list OPV for their routine immunization, this is not captured in our analysis. Currently all countries maintain a primary schedule that seeks to vaccinate children as they reach specific ages, except Cuba, which delivers OPV universally in mass immunization campaigns twice a year as its routine immunization strategy.(55) All countries currently use a primary immunization schedule with at least 3 doses, except Japan, for which the current schedule includes 2 doses of tOPV, although Japan began a transition toward adoption of IPV in late 2012. We defined primary immunization as up to 3 doses that start after 15 days of age and we counted any doses beyond these as boosters. Table 4 shows the number of countries that use any IPV-containing vaccine for routine vaccination in their schedule by schedule, which demonstrates that many countries include combination formulations of IPV in their schedules, at least as an option, which adds significant complexity to Figure 4 relative to Figure 3. Several countries use sequential schedules that include both tOPV and IPV-containing vaccines, with South Africa representing the only country that currently includes IPV-containing vaccines in its primary immunization schedule that also gives a birth dose of tOPV. As depicted in Figure 4, countries vary significantly with respect to their choices of vaccines and schedules for boosters.
Figure 3: Decision tree for routine immunization national schedules that only use tOPV, based on current national schedules(33) *.
* Always delivered as standalone oral formulation. Some countries that use OPV apply exclusion criteria from OPV vaccination and use IPV for excluded individuals.
** Cuba vaccinates all children under 3 years of age in two annual campaigns, and Japan currently lists a schedule with only 2 doses.
Figure 4: Decision tree for routine immunization national schedules including any use of IPV, based on current national schedules(33)*.
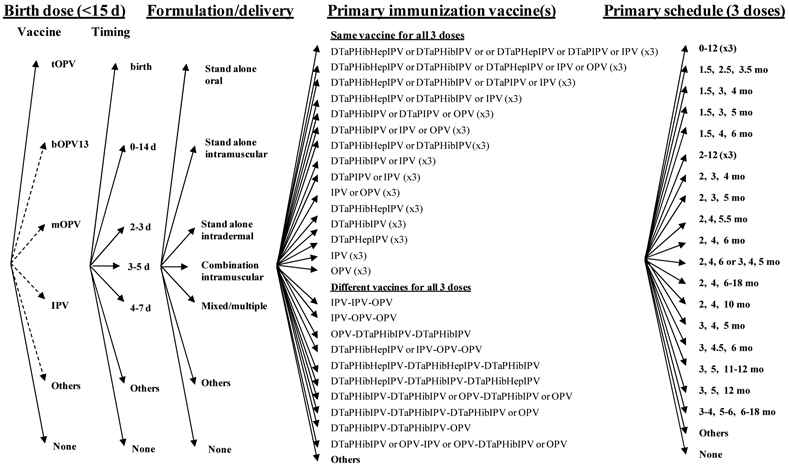
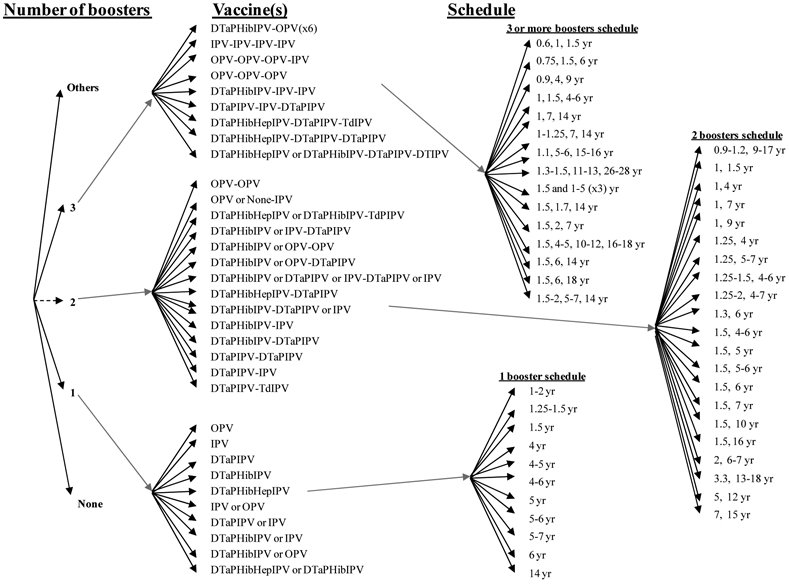
(a) Birth and primary immunization options.
(b) Booster options.
* Some countries that use OPV apply exclusion criteria from OPV vaccination and use IPV for excluded individuals (applies above for some schedules that include OPV).
Table 3.
Distribution of countries using OPV for routine immunization by schedule and count of those giving a birth dose (n=129)(33)
| Primary schedule (mo) | Number of countries | Birth dose given** | |
|---|---|---|---|
| OPV only | OPV* | ||
| 1.5, 2.5, 3.5 | 64 | 40 | |
| 2, 4, 6 | 18 | 17 | 5 |
| 2, 3, 4 | 13 | 1 | 8 |
| 3, 4, 5 | 4 | 1 | |
| 2, 3.5, 5 | 2 | 1 | 1 |
| 1-1.5, 2-2.5, 3 | 1 | 1 | |
| 0-12(x2), 12-24(x1) *** | 1 | ||
| 1, 2, 3 | 1 | ||
| 1.5, 3, 5 | 1 | ||
| 1.5, 3, 5-6 | 1 | ||
| 1.5-2, 4-5, 6-7 | 1 | ||
| 2, 3, 6 | 1 | ||
| 3, 5, 7 | 1 | ||
| 6, 12**** | 1 | ||
| Total | 108 | 21 | 56 |
Country applies exclusion criteria for some risk groups and uses IPV to vaccinate excluded individuals
Includes 53 countries that give the dose at birth, 1 country each that give the dose at 0-14 (<15) days, 2-3 days, or 4-7 days.
Cuba
Japan
Table 4.
Distribution of countries using any IPV-containing vaccines by schedule (n=65)(33)
| Vaccine | Number |
|---|---|
| IPV only for all 3 doses | |
| 2, 4, 6 months | 1 |
| 2, 4, 6-18 months | 2 |
| 3, 4, 5 months | 1 |
| 3-4, 5-6, 16-18 months | 1 |
| Combination IPV option for all 3 doses** | |
| 2, 4, 6 months | 19 |
| 2, 3, 4 months | 9 |
| 3, 5, 12 months | 5 |
| 1.5, 3, 5 months | 2 |
| 3, 4.5, 6 months | 2 |
| 3, 5, 11-12 months | 2 |
| 0-12 (x3) months | 1 |
| 1.5, 3, 4 months | 1 |
| 1.5, 4, 6 months | 1 |
| 2-12 (x3) months | 1 |
| 2, 3, 5 months | 1 |
| 2, 4, 5.5 months | 1 |
| 2, 4, 10 months | 1 |
| 3, 4, 5 months | 1 |
| 3, 4, 5, or 2, 4, 6 months | 1 |
| IPV or OPV for all 3 doses*** | |
| 2, 4, 6 months | 1 |
| OPV only for all 3 doses*** | |
| 2, 3, 4 months | 1 |
| IPV-IPV-OPV | |
| 3, 4, 5 months | 1 |
| 3, 4.5, 6 months | 1 |
| IPV-OPV*-OPV* | |
| 2, 4, 6 months | 2 |
| IPV-OPV-OPV | |
| 2, 4, 6 months | 2 |
| Combination IPV option (x2)-OPV | |
| 3, 4, 5 months | 1 |
| Combination IPV option-OPV*-OPV* | |
| 2, 4, 6 months | 1 |
| Combination IPV option-OPV-OPV | |
| 2, 4, 6 months | 1 |
| OPV-Combination IPV option (x2)**** | |
| 1.5, 2.5, 3.5 months | 1 |
Country applies exclusion criteria for some risk groups and uses IPV to vaccinate excluded individuals
Countries that include any form of a combination vaccine (DTaPHepIPV, DTaPHibIPV, DTaPHibHepIPV, DTwPHibHepBIPV, DTaPIPV) as an option or as the requirement for the IPV component in their schedule
Brunei Darussalam included here because it includes a dose of DTaPIPV in its schedule at 5 years.
South Africa also includes a birth dose of OPV in its schedule
Table 5 summarizes the evidence from seroconversion studies for OPV identified in our review of the literature.(42,49,50,56-89) Numerous studies from countries of all income levels around the world demonstrate the ability of OPV to induce seroconversion, although they also reveal important variability and generally lower rates in less temperate settings. All OPV studies share the limitation that seroconversion may occur not as a result of direct vaccination but from exposure to live polioviruses (i.e., WPV or OPV-related), as reported for unvaccinated subjects in several studies(60,62,63,71,73,90-92) As shown in Table 5, the existing studies show a wide range of seroconversion estimates for a birth dose, with particularly low rates in two recent studies in India for unknown reasons.(65,66) However, this difference disappears after subsequent doses(75) and several studies found increased cumulative seroconversion rates with the addition of a birth dose to the primary immunization schedule.(62,63,75) Despite this variability, the WHO recommends a birth dose for all countries with moderate or high potential for WPV transmission, determined mainly by relatively low levels of routine immunization coverage, poor sanitation, and/or lower SES.(32)
Table 5.
Studies reporting cumulative seroconversion rates for oral poliovirus vaccine (adapted from Patriarca et al.(37)) and updated, only includes studies published in English between 1978 and 2012 with ≥ 20 subjects and ≤ 4 doses)
| Country(ref) | Study perioda |
Settingb | No. of subjectsc |
Vaccine formulationd |
Schedule | Cut- offe |
Fold rise in antibodies |
Assumed half-life for maternal antibodiesf |
Cumulative seroconversion (%) |
Gradeg | ||
|---|---|---|---|---|---|---|---|---|---|---|---|---|
| PV1 | PV2 | PV3 | ||||||||||
| tOPV, 1 dose: | ||||||||||||
| Bangladesh(56)h | 1990-1992 | Non-temperate | 99;98;99 | 10:1:3 | 6-16 w | 1:16 | 4 | NR | 33 | 41 | 27 | 3 |
| Bangladesh(56)i | 1990-1992 | Non-temperate | 211;209;212 | 10:1:3 | 6-16 w | 1:16 | 4 | NR | 34 | 56 | 42 | 3 |
| Brazil(57) | 1986-1988 | Non-temperate | 27 | 10:1:5 | 2 m | 1:5 | 4 | 30 d | 63 | 96 | 22 | 2 |
| Brazil(57) | 1986-1988 | Non-temperate | 27 | 10:1:3 | Birth | 1:5 | 4 | 30 d | 22 | 59 | 11 | 2 |
| Brazil(58) | 1988-1989 | Non-temperate | 195 | 20:1:6 | Birth | 1:8 | 4 | 28 d | 30 | 51 | 14 | 2 |
| Brazil(58) | 1988-1989 | Non-temperate | 184 | 10:0.5:6 | Birth | 1:8 | 4 | 28 d | 31 | 52 | 11 | 2 |
| Brazil(58) | 1988-1989 | Non-temperate | 175 | 10:1:6 | Birth | 1:8 | 4 | 28 d | 30 | 59 | 13 | 1 |
| Brazil(58) | 1988-1989 | Non-temperate | 176 | 10:1:3 | Birth | 1:8 | 4 | 28 d | 22 | 60 | 13 | 2 |
| Egypt(59) | 2005 | Non-temperate | 190 | 25:1:10 | Birth | 1:8 | 4 | 28 d | 32 | 62 | 17 | 2 |
| Ghana(60) | 1977-1978 | Non-temperate | 158;131;161 | 10:1:3 | 3-8 m | 1:8 | 2 | NA | 22 | 31 | 28 | 3 |
| Ghana(61) | 1990-1991 | Non-temperate | 200 | 10:1:3 | Birth | 1:8 | 4 | 28 d | 34 | 60 | 35 | 2 |
| Ghana(61) | 1990-1991 | Non-temperate | 195 | 10:1:3 | 6 w | 1:8 | 4 | 28 d | 42 | 67 | 52 | 2 |
| Indla(62) | < 1993 | Non-temperate | 30 | NR | 3 d | NR | 4 | 21-45 d | 42 | 39 | 35 | 2 |
| India(63) | < 1997 | Non-temperate | 25 | NR | Birth | 1:10 | 4 | NA | 56 | 72 | 28 | 3 |
| India(49) | < 1997 | Non-temperate | 51 | 10:1:6 | 3 d | 1:4 | 2 | 4 w | 69 | 73 | 69 | 3 |
| India(64)j | < 1997 | Non-temperate | ~100 | NR | 3 d | 1:4 | 4 | 3-4 w | 72 | 82 | 64 | 2 |
| India(65)k | 2005-2008 | Non-temperate | 363 | 10:1:6 | Birth | 1:8 | 4 | 28 d | 10 | 15 | 1 | 1 |
| India(66) | 2008 | Non-temperate | 168 | 10:1:6 | Birth | 1:8 | 4 | 28 d | 15 | 25 | 4 | 1 |
| Mexico(67)l | 1992-1995 | Non-temperate | 96 | 10:1:4 | 2 m | 1:8 | 4 | 28 d | 67 | 92 | 40 | 2 |
| Mexico(67)m | 1992-1995 | Non-temperate | 85 | 10:1:4 | 6 w - 6 m | 1:8 | 4 | 28 d | 72 | 89 | 32 | 2 |
| South Africa(68) | < 2012 | Non-temperate | 184 | 10:1:6 | Birth | 1:8 | 4 | 30 d | 39 | 63 | 21 | 1 |
| Thailand(69) | < 1994 | Non-temperate | 105;103;104 | 10:1:3 | 2 m | 1:8 | 4 | NA | 25 | 81 | 35 | 3 |
| Tunisia(70) | 1993-1994 | Non-temperate | 109 | 10:1:6 | 3 m | 1:8 | 4 | NA | 69 | 88 | 20 | 1 |
| China(71) | 1981-1982 | Temperate | 107 | 10:1:3 | 3 d | 1:4 | 4 | 45 d | 41 | 42 | 33 | 2 |
| China(71) | 1981-1982 | Temperate | 107 | 10:1:3 | 60 d | 1:4 | 4 | 45 d | 72 | 82 | 91 | 2 |
| Croatia (now)(72)n | 1984 | Temperate | 68;62 | 10:1:3 | 3 m | 1:2 | 4 | NA | 62 | NR | 37 | 3 |
| Italy(73)n | 1984-1985 | Temperate | ~ 40 | NR | ~ 3 m | 1:4 | 4 | NA | 78 | NR | 38 | 2 |
| USA(42) | 1980-1983 | Temperate | 287;303;295 | 8:1:5 | 2.2 m (on average) | 1:4 | 4 | 28 d | 39 | 84 | 71 | 2 |
| USA(74) | 1990-1991 | Temperate | NR (≤ 55) | NR | 2 m | 1:8 | 4 | 28 d | 43 | 95 | 25 | 2 |
| tOPV, 2 doses: | ||||||||||||
| Brazil(57) | 1986-1988 | Non-temperate | 27 | 10:1:5 | 2, 4 m | 1:5 | 4 | 30 d | 85 | 100 | 67 | 2 |
| Brazil(57) | 1986-1988 | Non-temperate | 27 | 10:1:3 | Birth, 2 m | 1:5 | 4 | 30 d | 59 | 96 | 67 | 2 |
| Brazil(58) | 1988-1989 | Non-temperate | 195 | 20:1:6 | Birth, 6 w | 1:8 | 4 | 28 d | 65 | 78 | 43 | 2 |
| Brazil(58) | 1988-1989 | Non-temperate | 184 | 10:0.5:6 | Birth, 6 w | 1:8 | 4 | 28 d | 57 | 77 | 36 | 2 |
| Brazil(58) | 1988-1989 | Non-temperate | 175 | 10:1:6 | Birth, 6 w | 1:8 | 4 | 28 d | 57 | 81 | 38 | 1 |
| Brazil(58) | 1988-1989 | Non-temperate | 176 | 10:1:3 | Birth, 6 w | 1:8 | 4 | 28 d | 48 | 78 | 39 | 2 |
| Gambia(58) | 1988-1989 | Non-temperate | 161 | 20:1:6 | < 6, ~ 8 w | 1:8 | 4 | 28 d | 61 | 76 | 45 | 2 |
| Gambia(58) | 1988-1989 | Non-temperate | 169 | 10:0.5:6 | < 6, ~ 8 w | 1:8 | 4 | 28 d | 51 | 78 | 43 | 2 |
| Gambia(58) | 1988-1989 | Non-temperate | 190 | 10:1:6 | < 6, ~ 8 w | 1:8 | 4 | 28 d | 54 | 74 | 46 | 1 |
| Gambia(58) | 1988-1989 | Non-temperate | 159 | 10:1:3 | < 6, ~ 8 w | 1:8 | 4 | 28 d | 52 | 77 | 36 | 2 |
| Ghana(60) | 1977-1978 | Non-temperate | 51;47;52 | 10:1:3 | 3-8, 9-14 m | 1:8 | 2 | NA | 24 | 60 | 52 | 3 |
| Ghana(75) | 1990-1991 | Non-temperate | 200 | 10:1:3 | Birth, 6 w | 1:8 | 4 | 28 d | 59 | 79 | 67 | 2 |
| Ghana(75) | 1990-1991 | Non-temperate | 196 | 10:1:3 | 6, 10 w | 1:8 | 4 | 28 d | 64 | 80 | 67 | 2 |
| India(65) | 2005-2008 | Non-temperate | 143;133;159 | 10:1:6 | Birth, 30 d | 1:8 | 4 | 28 d | 56 | 77 | 40 | 1 |
| India(66) | 2008 | Non-temperate | 168 | 10:1:6 | Birth, 30 d | 1:8 | 4 | 28 d | 63 | 91 | 52 | 1 |
| Mexico(67)l | 1992-1995 | Non-temperate | 96 | 10:1:4 | 2, 4 m | 1:8 | 4 | 28 d | 83 | 99 | 59 | 2 |
| Mexico(67)m | 1992-1995 | Non-temperate | 85 | 10:1:4 | 6 w - 6 m (2 m apart) | 1:8 | 4 | 28 d | 91 | 95 | 65 | 2 |
| China(71) | 1981-1982 | Temperate | 107 | 10:1:3 | 3, 60 d | 1:4 | 4 | 45 d | 87 | 95 | 97 | 2 |
| Italy(73)n | 1984-1985 | Temperate | ~80 | NR | ~ 3 m, then at 6 w interval | 1:4 | 4 | NA | 90 | NR | 80 | 2 |
| USA(74) | 1990-1991 | Temperate | 36;35;36 | NR | 2, 3 m | 1:8 | 4 | 28 d | 78 | 97 | 86 | 2 |
| USA(74) | 1990-1991 | Temperate | 27;26;27 | NR | 2, 4 m | 1:8 | 4 | 28 d | 89 | 100 | 93 | 2 |
| tOPV, 3 doses: | ||||||||||||
| Bangladesh(56)h | 1990-1992 | Non-temperate | 99;100;100 | 10:1:3 | 6-16 w, then at 4 w intervals | 1:16 | 4 | NR | 69 | 77 | 67 | 3 |
| Bangladesh(56)i | 1990-1992 | Non-temperate | 213;210;214 | 10:1:3 | 6-16 w, then at 4 w intervals | 1:16 | 4 | NR | 70 | 85 | 74 | 3 |
| Brazil(57) | 1986-1988 | Non-temperate | 27 | 10:1:5 | 2, 4, 6 m | 1:5 | 4 | 30 d | 96 | 100 | 74 | 2 |
| Brazil(57) | 1986-1988 | Non-temperate | 27 | 10:1:3 | Birth, 2, 4 m | 1:5 | 4 | 30 d | 93 | 96 | 93 | 2 |
| Brazil(58) | 1988-1989 | Non-temperate | 195 | 20:1:6 | Birth, 6, 10 w | 1:8 | 4 | 28 d | 82 | 87 | 56 | 2 |
| Brazil(58) | 1988-1989 | Non-temperate | 184 | 10:0.5:6 | Birth, 6, 10 w | 1:8 | 4 | 28 d | 73 | 88 | 52 | 2 |
| Brazil(58) | 1988-1989 | Non-temperate | 175 | 10:1:6 | Birth, 6, 10 w | 1:8 | 4 | 28 d | 75 | 88 | 55 | 1 |
| Brazil(58) | 1988-1989 | Non-temperate | 176 | 10:1:3 | Birth, 6, 10 w | 1:8 | 4 | 28 d | 68 | 87 | 53 | 2 |
| Ghana(60) | 1977-1978 | Non-temperate | 75;64;74 | 10:1:3 | 3-8, 9-14, 15-20 m | 1:8 | 2 | NA | 36 | 73 | 64 | 3 |
| Ghana(75) | 1990-1991 | Non-temperate | 200 | 10:1:3 | Birth, 6, 10 w | 1:8 | 4 | 28 d | 73 | 90 | 78 | 2 |
| Ghana(75) | 1990-1991 | Non-temperate | 196 | 10:1:3 | 6, 10, 14 w | 1:8 | 4 | 28 d | 75 | 83 | 79 | 2 |
| India(76) | 1974 | Non-temperate | 78 | 10:1:3 | 1 m intervals between 3-36 m | 1:10 | NAo | NA | 29 | 67 | 55 | 3 |
| India(77) | < 1984 | Non-temperate | 139 | 10:1:3 | 7-42 d, then at 4 w intervals | 1:8 | 4 | ~ 28 d | 73 | 87 | 63 | 2 |
| India(78) | 1988-1989 | Non-temperate | 42 | NR | 6-12 w, then at 4-6 w intervals | 1:20 | 4 | NA | 64 | 81 | 57 | 3 |
| India(78)p | 1988-1989 | Non-temperate | 35 | NR | 6-12 w, then at 4-6 w intervals | 1:20 | 4 | NA | 77 | 80 | 60 | 3 |
| India(62) | < 1993 | Non-temperate | 41 | NR | 6-8 w, then at 4-6 w intervals | NR | 4 | 21-45 d | 90 | 83 | 76 | 2 |
| India(63) | < 1997 | Non-temperate | 30 | NR | 6, 10, 14 w | 1:10 | 4 | NA | 57 | 77 | 47 | 3 |
| India(79) | < 1999 | Non-temperate | 27 | 10:1:3 | Birth, 6, 10 w | 1:8 | 4 | 30 d | 93 | 100 | 93 | 2 |
| Indonesia(80)j | 1992-1993 | Non-temperate | 304;353;347 | 10:1:6 | 6, 10, 14 w | 1:2 | NAr | 4 w | 99 | 100 | 100 | 3 |
| Indonesia(81)r | < 1999 | Non-temperate | 478 | NR | 8, 12, 16 w | 1:2 | 4 | 30 d | 97 | 100 | 97 | 3 |
| Morocco(82) | 1987-1988 | Non-temperate | 42 | 10:1:3 (Vero) | Birth, 6, 10, 14 w | 1:5 | 4 | 4 w | 95 | 100 | 86 | 2 |
| Morocco(82) | 1987-1988 | Non-temperate | 42 | 10:1:3 | Birth, 6, 10, 14 w | 1:5 | 4 | 4 w | 95 | 100 | 79 | 2 |
| Nigeria(83) | < 1978 | Non-temperate | 56 | 10:1:3 | 2, 3, 5 m | 1:8 | NR | NR | 43 | 88 | 48 | 3 |
| Oman(50) | 1990-1992 | Non-temperate | 150 | 10:1:3 | Birth, 6, 10 w | 1:8 | 4 | 28 d | 81 | 97 | 73 | 2 |
| Sri Lanka(84)s | 1975 | Non-temperate | 68 | 10:1:2 | 3-6 m, then at 6-8 w intervals | 1:16 | 4 | NA | 69 | 91 | 78 | 3 |
| Sri Lanka(84)t | 1975 | Non-temperate | 35 | 10:1:2 | 3-6 m, then at 6-8 w intervals | 1:16 | 4 | NA | 6 | 49 | 34 | 3 |
| Thailand(50) | 1991-1992 | Non-temperate | 125 | 10:1:3 | Birth, 6, 10 w | 1:8 | 4 | 28 d | 94 | 99 | 93 | 2 |
| Thailand(69) | < 1994 | Non-temperate | 94 | 10:1:3 | 2, 4, 6 m | 1:8 | 4 | NA | 67 | 93 | 80 | 3 |
| Tunisia(70) | 1993-1994 | Non-temperate | 114 | 10:1:6 | 3, 4, 5 m | 1:8 | 4 | NA | 95 | 100 | 89 | 1 |
| Australia(85)n | 1995-1998 | Temperate | 198;197;198 | 10:1:3 | 2, 4, 6 m | 1:8 | 4 | 30 d | 94 | 100 | 98 | 2 |
| Belgium(86)u | < 2005 | Temperate | 138 | 10:1:6 (MRC-5) | 3, 4, 5 m | 1:4 | 2 | 28 d | 90 | 99 | 97 | 3 |
| Belgium(86) | < 2005 | Temperate | 45;44;46 | 10:1:6 | 3, 4, 5 m | 1:4 | 2 | 28 d | 98 | 95 | 98 | 3 |
| China(71) | 1981-1982 | Temperate | 107 | 10:1:3 | 60, 90, 120 d | 1:4 | 4 | 45 d | 99 | 98 | 98 | 2 |
| China(87) | 2009-2010 | Temperate | 92 | 10:1:3 | 2, 4, 6 m | 1:8 | 4 | NA | 100 | 100 | 100 | 2 |
| Taiwan(88)n | < 1999 | Temperate | ~ 130 | ~10:1:2 | 2, 4, 6 m | 1:4 | 4 | 21 d | 98 | 98 | 98 | 2 |
| USA(74) | 1990-1991 | Temperate | 25 | NR | 2, 3, 4 m | 1:8 | 4 | 28 d | 96 | 100 | 100 | 2 |
| USA(74) | 1990-1991 | Temperate | 26;25;26 | NR | 2, 4, 6 m | 1:8 | 4 | 28 d | 100 | 100 | 96 | 2 |
| tOPV, 4 doses: | ||||||||||||
| Gambia(58) | 1988-1989 | Non-temperate | 161 | 20:1:6 | < 6 w, ~ 8, ~ 16, ~ 21 w | 1:8 | 4 | 28 d | 93 | 96 | 71 | 2 |
| Gambia(58) | 1988-1989 | Non-temperate | 169 | 10:0.5:6 | < 6 w, ~ 8, ~ 16, ~ 21 w | 1:8 | 4 | 28 d | 85 | 97 | 73 | 2 |
| Gambia(58) | 1988-1989 | Non-temperate | 190 | 10:1:6 | < 6 w, ~ 8, ~ 16, ~ 21 w | 1:8 | 4 | 28 d | 81 | 94 | 73 | 1 |
| Gambia(58) | 1988-1989 | Non-temperate | 159 | 10:1:3 | < 6 w, ~ 8, ~ 16, ~ 21 w | 1:8 | 4 | 28 d | 78 | 95 | 70 | 2 |
| Ghana(75) | 1990-1991 | Non-temperate | 200 | 10:1:3 | Birth, 6, 10, 14 w | 1:8 | 4 | 28 d | 84 | 91 | 83 | 2 |
| India(62) | < 1993 | Non-temperate | 30 | NR | 3 d, 6 w, then at 4-6 w intervals | NR | 4 | 21-45 d | 87 | 90 | 87 | 2 |
| India(63) | < 1997 | Non-temperate | 25 | NR | Birth, 6, 10, 14 w | 1:10 | 4 | NA | 92 | 88 | 72 | 3 |
| India(49) | < 1997 | Non-temperate | 51 | 10:1:6 | 3 d, 6, 10, 14 w | 1:4 | 2 | 4 w | 92 | 94 | 90 | 3 |
| Pakistan(89) | 1996 | Non-temperate | 302 | 10:1:6 | Birth, 6, 10, 14 w | 1:8 | 4 | 28 d | 89 | 96 | 95 | 1 |
| Brazil(57) | 1986-1988 | Non-temperate | 27 | 10:1:3 | Birth, 2, 4, 6 m | 1:5 | 4 | 30 d | 100 | 100 | 96 | 2 |
| Brazil(58) | 1988-1989 | Non-temperate | 195 | 20:1:6 | Birth, 6, 10, 14 w | 1:8 | 4 | 28 d | 92 | 95 | 64 | 2 |
| Brazil(58) | 1988-1989 | Non-temperate | 184 | 10:0.5:6 | Birth, 6, 10, 14 w | 1:8 | 4 | 28 d | 86 | 93 | 64 | 2 |
| Brazil(58) | 1988-1989 | Non-temperate | 175 | 10:1:6 | Birth, 6, 10, 14 w | 1:8 | 4 | 28 d | 85 | 91 | 66 | 1 |
| Brazil(58) | 1988-1989 | Non-temperate | 176 | 10:1:3 | Birth, 6, 10, 14 w | 1:8 | 4 | 28 d | 84 | 91 | 63 | 2 |
| Morocco(82) | 1987-1988 | Non-temperate | 39 | 10:1:3 (Vero) | Birth, 6, 10, 14 w | 1:5 | 4 | 4 w | 95 | 100 | 90 | 2 |
| Morocco(82) | 1987-1988 | Non-temperate | 35 | 10:1:3 | Birth, 6, 10, 14 w | 1:5 | 4 | 4 w | 86 | 100 | 89 | 2 |
| Oman(50) | 1990-1992 | Non-temperate | 150 | 10:1:3 | Birth, 6, 10, 14 w | 1:8 | 4 | 28 d | 94 | 99 | 81 | 2 |
| Thailand(69) | < 1994 | Non-temperate | 89 | 10:1:3 | 2, 4, 6, 9 m | 1:8 | 4 | NA | 80 | 92 | 83 | 3 |
| Thailand(50) | 1991-1992 | Non-temperate | 125 | 10:1:3 | Birth, 6, 10, 14 w | 1:8 | 4 | 28 d | 98 | 100 | 100 | 2 |
| China(71) | 1981-1982 | Temperate | 107 | 10:1:3 | 3, 60, 90, 120 d | 1:4 | 4 | 45 d | 98 | 99 | 99 | 2 |
| mOPV, 1 dose: | ||||||||||||
| Egypt(59)(mOPV1) | 2005 | Non-temperate | 231 | 106.8 | Birth | 1:8 | 4 | 28 d | 55 | - | - | 1 |
| India(65)w(mOPV1) | 2005-2008 | Non-temperate | 778 | 106.0-6.8 | Birth, 30 d | 1:8 | 4 | 28 d | 14 | - | - | 1 |
| India(66)(mOPV1) | 2008 | Non-temperate | 168 | 106 | Birth | 1:8 | 4 | 28 d | 20 | - | - | 1 |
| India(66)(mOPV2) | 2008 | Non-temperate | 170 | 105 | Birth | 1:8 | 4 | 28 d | - | 21 | - | 1 |
| India(66)(mOPV3) | 2008 | Non-temperate | 165 | 105.8 | Birth | 1:8 | 4 | 28 d | - | - | 12 | 1 |
| South Africa(68)y (mOPV1) | < 2012 | Non-temperate | 383 | ~106 | Birth | 1:8 | 4 | 30 d | 75 | - | - | 1 |
| South Africa(68) (mOPV3) | < 2012 | Non-temperate | 195 | ~105.8 | Birth | 1:8 | 4 | 30 d | - | - | 58 | 1 |
| mOPV, 2 doses: | ||||||||||||
| Egypt(59)(mOPV1) | 2005 | Non-temperate | 231 | 106.8 | Birth, 30 d | 1:8 | 4 | 28 d | 81 | - | - | 1 |
| India(65)v (mOPV 1) | 2005-2008 | Non-temperate | 363 | 106.0-6.8 | Birth, 30 d | 1:8 | 4 | 28 d | 87 | - | - | 1 |
| India(66)(mOPV1) | 2008 | Non-temperate | 168 | 106 | Birth, 30 d | 1:8 | 4 | 28 d | 90 | - | - | 1 |
| India(66)(mOPV2) | 2008 | Non-temperate | 170 | 105 | Birth, 30 d | 1:8 | 4 | 28 d | - | 90 | - | 1 |
| India(66)(mOPV3) | 2008 | Non-temperate | 165 | 105.8 | Birth, 30 d | 1:8 | 4 | 28 d | - | - | 84 | 1 |
| bOPV, 1 dose: | ||||||||||||
| India(66) | 2008 | Non-temperate | 159;159 | 10:6 | Birth | 1:8 | 4 | 28 d | 20 | - | 7 | 1 |
| bOPV, 2 doses: | ||||||||||||
| India(66) | 2008 | Non-temperate | 159;159 | 10:6 | Birth, 30 d | 1:8 | 4 | 28 d | 86 | - | 74 | 1 |
Acronyms: bOPV = bivalent oral poliovirus vaccine; CID50 = tissue- or culture-infective doses; d = days; m = months; ml= milliliter; mOPV(1,2,3) = monovalent oral poliovirus vaccine (types 1, 2, and 3, respectively); NA = not applicable; NR = not reported; PV(1,2,3) = poliovirus (types 1, 2, and 3, respectively); tOPV = trivalent oral poliovirus vaccine; w = weeks
Notes:
If not reported, we list the upper bound as the year of publication
Stratification by setting adopted from Cáceres and Sutter (2001)(39)
If not equal for all serotype, then semicolon-separated values indicates numbers for each reported serotype (e.g., PV1;PV2;PV3)
Ratio of CID50 virus content by type for tOPV and bOPV (as formulated) or absolute CID50 virus content for mOPV
Minimum antibody titer used to define seropositivity; if not reported, we assume this equals the lowest dilution tested
NA in this column indicates that the study did not account for maternal antibody decay; NR indicates that a study accounted for maternal antibody decay but did not state the assumed half-life.
Grade 1: standard vaccine formulation (10:1:6 for tOPV, 10:6 for bOPV, any for mOPV) and standard serological methods; Grade 2: non-standard vaccine formulation (or not reported), but standard serological methods; Grade 3: non-standard serological methods (see methods). If the failure to account for maternal antibody decay represents the only reason for non-standard serological methods, then we still consider a 100% seroconversion rate consistent with serological standards, since the seroconversion rate would remain the same after accounting for maternal antibody decay.
Study arm “diarrheal cohort”
Study arm “non-diarrheal cohort”
Unweighted (if precise number of subjects by arm not provided) or weighted average of results for arms that received or did not receive Vitamin A supplement at time of tOPV immunization
Weighted average of results for arms that received tOPV from different manufacturers in trials I and II
Study arm that received tOPV through routine immunization
Study arm that received tOPV through mass immunization campaign
Weighted average of results for arms that received or did not receive various other vaccines at time of tOPV immunization
“Seroconversion” numbers from this study reflect the difference of the percent seropositive before and after immunization
This study arm received 0.2 ml instead of the conventional 0.1 ml of tOPV
Seroconversion defined as an antibody titer of more than 1:2 “minus the calculated expected titer of passively acquired maternal antibody to poliovirus, assuming a half-life of immunoglobulin G to be 4 wk”(80, p. 2204)
Weighted average of results for arms that received or did not receive oral iodine supplementation at time of tOPV immunization
Study site Colombo
Weighted average of results from Kandy and Jaffna study sites, outside Colombo. Seroconversion found decreasing seroconversion with distance from Colombo, suggesting cold chain problems for the study sites outside Colombo.
Weighted average of results from different trial with different lots of the experimental tOPV vaccine produced on MRC-5 cells
Weighted average of results for arms that received mOPV from different manufacturers and potency in trials I and II
Weighted average of results for arms that received mOPV1 from different manufacturers
With respect to primary immunization with tOPV, the data in Table 5 suggest that after receiving all 3 doses, in temperate countries seroconversion rates for all three serotypes approach 100%, while non-temperate countries show more variability and generally lower rates. (As discussed in the methods, we excluded numerous studies from the analysis that reported approximately 100% seropositivity because they did not report seroconversion rates.(93)) Possible explanations for lower seroconversion in lower-income countries include competition with other enteric pathogens, diarrheal disease, interference with high levels of maternal antibody (including those received during breastfeeding), environmental conditions not conducive to effective vaccination, and vaccine quality issues due to problems in the cold chain.(32) For two doses, similar variability according to setting arises, with estimates as low as 24% seroconversion for type 1 in Ghana,(60) but 100% seroconversion with just two doses for type 2 in the United States.(74) The data collected after individual doses show important trends with respect to the different serotypes, with the first dose of tOPV formulations tending to induce relatively greater protection for type 2 than types 1 and 3, which demonstrates the known interference between type 2 and types 1 and 3(37) even with the standard formulation. Although in theory vaccine formulations might be adjusted to optimize seroconversion rates for the different types, in practice this would depend on investing resources to change formulations and relicense the product, which would lead to significant costs and delays. Thus, we assume that vaccine reformulation currently represents more of a theoretical option than a practical option. The studies in Table 5 considered a large array of schedules, all with at least 4-week intervals between doses, but few studies(57,74,75) directly compare different schedules with the same number of tOPV doses and none of them show substantial differences between the schedules.
Booster doses provide a way to make up for missed doses earlier in life and increase antibody levels in previously immune individuals, which may reduce their potential to participate in poliovirus transmission.(34,94) In the context of understanding population immunity for polio, waning immunity represents an important source of uncertainty, and studies of polio antibodies provide relatively limited data.(34,94) Although immunity from paralytic disease appears life-long following a successful vaccination, a few studies that explored waning show that antibody concentrations decrease over time,(95-97) which suggests the possibility that individuals may become relatively more susceptible to infection and participate more in the transmission of infection as the time since their last live poliovirus infection or IPV vaccination increases. With the increasing use of IPV, the dynamics of waning immunity might also change due to the absence of boosting via exposure to secondary OPVs.
Table 6 summarizes the evidence from seroconversion studies for immunization strategies involving enhanced potency IPV identified by our literature review,(42-45,50,55,63,69,87, 98-101) Many studies provide evidence of seroconversion using IPV-containing vaccines for routine immunization. A recent study reported significantly higher rates of seroconversion for IPV delivered using a 2, 4, 6-month primary schedule than for a 6, 10, 14-week (i.e., 1.5, 2.5, 3.5-month) schedule(101) and studies that investigated early administration of the first dose typically found lower seroconversion rates than those administering the first dose at a later age in similar settings. These results suggest that countries should consider their choice of primary schedule carefully when using IPV, because substituting IPV in for a first dose may lead to the need to shift the immunization schedule such that the first dose occurs at least 2 months after birth. Unlike OPV, which causes infection to produce a local immunological response in the mucosa and systemic antibody production, IPV stimulates good systemic antibody production but very limited, if any, mucosal immunity.(34,94) For the 6, 10, 14-week schedule used by many developing countries, the WHO suggests the need for an additional booster dose given the inferiority of the schedule.(34)
Table 6.
Studies reporting cumulative seroconversion rates for eIPV (adapted from Sutter et al.(38)) and updated, only includes studies published in English between 1978 and 2012 with ≥ 20 subjects and ≤ 4 doses)
| Country(ref) | Study perioda |
Settingb | No. of subjectsc |
Vaccine formulationd |
Schedule | Cut- offe |
Fold rise in antibodies |
Assumed half-life for maternal antibodiesf |
Cumulative seroconversion (%) |
Gradeg | ||
|---|---|---|---|---|---|---|---|---|---|---|---|---|
| PV1 | PV2 | PV3 | ||||||||||
| 1 dose: | ||||||||||||
| Cuba(44) | 2006-2007 | Non-temperate | 177 | 40:8:32 | 6 w | 1:8 | 4 | 28 d | 29 | 38 | 43 | 1 |
| Cuba(44)h | 2006-2007 | Non-temperate | 187 | 5:1.6:6.4 | 6 w | 1:8 | 4 | 28 d | 10 | 20 | 8 | 2 |
| India(63) | < 1997 | Non-temperate | 50 | 40:8:32 | Birth | 1:10 | 4 | NA | 48 | 64 | 30 | 3 |
| Oman(45) | 2007 | Non-temperate | 182;180;183 | 40:8:32 | 2 m | 1:8 | 4 | 28 d | 22 | 32 | 45 | 1 |
| Oman(45)h | 2007 | Non-temperate | 184;185;186 | 5:1.6:6.4 | 2 m | 1:8 | 4 | 28 d | 11 | 17 | 9 | 2 |
| Thailand(69) | < 1994 | Non-temperate | 103 | 40:8:32 | 2 m | 1:8 | 4 | NA | 25 | 39 | 28 | 3 |
| USA(42)i | 1980-1983 | Temperate | 618;622;612 | Variablej | 2.2 m (on average) | 1:4 | 4 | 28 d | 42 | 35 | 54 | 2 |
| 2 doses: | ||||||||||||
| Cuba(55) | 2001 | Non-temperate | 72 | 40:8:32 | 8, 16 w | 1:8 | 4 | 30 d | 90 | 89 | 90 | 1 |
| Cuba(44) | 2006-2007 | Non-temperate | 177 | 40:8:32 | 6, 10 w | 1:8 | 4 | 28 d | 73 | 78 | 94 | 1 |
| Cuba(44)h | 2006-2007 | Non-temperate | 187 | 5:1.6:6.4 | 6, 10 w | 1:8 | 4 | 28 d | 33 | 57 | 44 | 2 |
| India(98) | < 1985 | Non-temperate | 100 | 40:8:32 | 6-45 w, then at 4 w interval | 1:8 | 4 | 4 w | 96 | 80 | 96 | 1 |
| India(98) | < 1985 | Non-temperate | 114 | 40:8:32 | 6-45 w, then at 8 w interval | 1:8 | 4 | 4 w | 96 | 88 | 97 | 1 |
| India(99) | < 1992 | Non-temperate | 30 | 40:8:32 | 6-24 w, then at 4 w interval | 1:10 | 4 | 4 w | 93 | 93 | 87 | 1 |
| India(99) | < 1992 | Non-temperate | 22 | 40:8:32 | 6-24 w, then at 8 w interval | 1:10 | 4 | 4 w | 91 | 91 | 86 | 1 |
| India(43)h | < 1998 | Non-temperate | 30 | 5:1.6:6.4 | 6-8 w, then at 8 w interval | 1:4 | 4 | 4 w | 90 | 70 | 97 | 2 |
| Oman(50) | 1990-1992 | Non-temperate | 136 | 40:8:32 | 6, 10 w | 1:8 | 4 | 28 d | 71 | 83 | 81 | 1 |
| Oman(45) | 2007 | Non-temperate | 182;180;183 | 40:8:32 | 2, 4 m | 1:8 | 4 | 28 d | 91 | 91 | 96 | 1 |
| Oman(45)h | 2007 | Non-temperate | 184;185;186 | 5:1.6:6.4 | 2, 4 m | 1:8 | 4 | 28 d | 71 | 72 | 72 | 2 |
| Thailand(50) | 1991-1992 | Non-temperate | 141 | 40:8:32 | 6, 10 w | 1:8 | 4 | 28 d | 40 | 48 | 79 | 1 |
| 3 doses: | ||||||||||||
| Cuba(55) | 2001 | Non-temperate | 52 | 40:8:32 | 6, 10, 14 w | 1:8 | 4 | 30 d | 94 | 83 | 100 | 1 |
| Cuba(44) | 2006-2007 | Non-temperate | 177 | 40:8:32 | 6, 10, 14 w | 1:8 | 4 | 28 d | 89 | 95 | 99 | 1 |
| Cuba(44)h | 2006-2007 | Non-temperate | 187 | 5:1.6:6.4 | 6, 10, 14 w | 1:8 | 4 | 28 d | 53 | 85 | 69 | 2 |
| India(63) | < 1997 | Non-temperate | 25 | 40:8:32 | Birth, 6, 10 w | 1:10 | 4 | NA | 88 | 88 | 100 | 3;3;2 |
| India(43)h | < 1998 | Non-temperate | 39 | 5:1.6:6.4 | 6-8 w, then at 4 w intervals | 1:4 | 4 | 4 w | 90 | 79 | 97 | 2 |
| Oman(50) | 1990-1992 | Non-temperate | 136 | 40:8:32 | 6, 10, 14 w | 1:8 | 4 | 28 d | 90 | 96 | 95 | 1 |
| Oman(45) | 2007 | Non-temperate | 182;180;183 | 40:8:32 | 2, 4, 6 m | 1:8 | 4 | 28 d | 100 | 100 | 100 | 1 |
| Oman(45)h | 2007 | Non-temperate | 184;185;186 | 5:1.6:6.4 | 2, 4, 6 m | 1:8 | 4 | 28 d | 97 | 96 | 98 | 2 |
| Philippines(100) | 2008 | Non-temperate | ~ 115 | 40:8:32 | 6, 10, 14 w | 1:8 | 4 | 28 d | 98 | 98 | 100 | 1 |
| Philippines(100)h | 2008 | Non-temperate | ~ 115 | 5:1.6:6.4 | 6, 10, 14 w | 1:8 | 4 | 28 d | 99 | 95 | 95 | 2 |
| Puerto Rico(101) | 2003-2004 | Non-temperate | 225 | 40:8:32 | 6, 19, 14 w | 1:8 | 4 | 28 d | 86 | 86 | 97 | 1 |
| Puerto Rico(101) | 2003-2004 | Non-temperate | 230 | 40:8:32 | 8, 16, 24 w | 1:8 | 4 | 28 d | 100 | 100 | 99 | 1 |
| Thailand(69) | < 1994 | Non-temperate | 92 | 40:8:32 | 2, 4, 6 m | 1:8 | 4 | NA | 97 | 95 | 98 | 3 |
| Thailand(50) | 1991-1992 | Non-temperate | 141 | 40:8:32 | 6, 10, 14 w | 1:8 | 4 | 28 d | 67 | 65 | 94 | 1 |
| China(87) | 2009-2010 | Temperate | 91 | 40:8:32 | 2, 3, 4 m | 1:8 | 4 | NA | 100 | 90 | 98 | 1;3;3 |
| China(87)k | 2009-2010 | Temperate | 266 | Variablel | 2, 3, 4 m | 1:8 | 4 | NA | 98 | 91 | 97 | 3 |
Acronyms: d = days; eIPV = enhanced-potency inactivated poliovirus vaccine; NA = not applicable; NR = not reported; PV(1,2,3) = poliovirus (types 1, 2, and 3, respectively); w = weeks
Notes:
If not reported, we list the upper bound as the year of publication
Stratification by setting adopted from Cáceres and Sutter (2001)(39)
If not equal for all serotype, then semicolon-separated values indicates numbers for each reported serotype (e.g., PV1;PV2;PV3)
D-antigen content by serotype
Minimum antibody titer used to define seroposivity; if not reported, we assume this equals the minimal dilution tested
NA indicates that the study did not account for maternal antibody decay
Grade 1: standard vaccine formulation (40:8:32 of D-antigen content) and standard serological methods; Grade 2: non-standard vaccine formulation (or not reported), but standard serological methods; Grade 3: non-standard serological methods (see methods); if failure to account for maternal antibody decay represents the only reason for non-standard serological methods, then we still consider a 100% seroconversion rate consistent with serological standards, since the seroconversion rate would remain the same after accounting for maternal antibody decay. If this leads to different grades by serotype, then we indicated serotype-specific grades separated by semicolons.
Study arm that received intradermally-administered fractional dose
Weighted average of results for arms that received eIPV from two different manufacturers
Potency testing found D-antigen contents of 24-38:3.6-6.5:28-36 (Merieux vaccine) or 20-25:3.7-9.2:26-30 (Connaught vaccine)
Weighted average of results for arms that received different formulations of IPV produced from Sabin seed strains
85 subjects had received high D-antigen content (45:64:67.5), 92 middle D-antigen content (30:32:45), and 89 low D-antigen content (15:16:22.5) Sabin IPV
IPV use in middle- and low-income countries remains limited, in large part due to the relatively high cost of IPV compared to OPV. However, the existing studies in Table 6 suggest that 3 doses of eIPV administered after 2 months of age can lead to seroconversion in a high fraction of recipients to all three serotypes. The experience with intradermally-administered fractional IPV doses remains mixed, with good results in Oman(45) and the Philippines(100) but sub-optimal seroconversion in Cuba(44) after 3 doses, perhaps owing to the different schedules and/or devices used.
Table 7 summarizes the evidence from seroconversion studies for immunization strategies that used sequential IPV and OPV strategies, which all involving 4 or more total doses.(50,63,69,89) Developed countries that transitioned from OPV to IPV often used an IPV/OPV sequential schedule, which yielded high levels of seropositivity in both temperate(36) and non-temperate settings (Table 7). A sequential schedule beginning with IPV and followed by OPV induces both mucosal and humoral immunity while significantly reducing (or completely preventing) VAPP.(102) Studies that explored the potential impact of administering OPV and IPV simultaneously(50,63,69,89) suggest that simultaneous schedules may offer important opportunities to address immunity gaps, albeit at a cost.(34) IPV costs and availability continue to influence national vaccine choices, and a recent study showed success with respect to seroconversion with fractional doses administered intradermally.(45) Efforts to find more cost-effective strategies for producing and using IPV continue to explore dose sparing options with subcutaneous delivery and/or improved adjuvants.
Table 7.
Studies reporting cumulative seroconversion rates for tOPV and eIPV (includes studies published in English between 1978 and 2012 with ≥ 20 subjects)
| Country(ref) | Study perioda |
Settingb | No. of subjectsc |
Vaccine formulationd |
Schedule | Cut- offe |
Fold rise in antibodies |
Assumed half-life for maternal antibodiesf |
Cumulative seroconversion (%) |
Gradeg | ||
|---|---|---|---|---|---|---|---|---|---|---|---|---|
| PV1 | PV2 | PV3 | ||||||||||
| eIPV and tOPV, 4 doses: | ||||||||||||
| India(63) | < 1997 | Non-temperate | 25 | 40:8:32 (eIPV) NR(tOPV) |
Birth (eIPV), 6, 10, 14 w (tOPV) | 1:10 | 4 | NA | 96 | 92 | 84 | 3 |
| Thailand(69) | < 1994 | Non-temperate | 84 | 40:8:32 (eIPV) 10:1:3 (tOPV) |
2, 4, 6 m (eIPV), 9 m (tOPV) | 1:8 | 4 | NA | 90 | 94 | 94 | 3 |
| eIPV and tOPV, > 4 doses: | ||||||||||||
| Oman(50) | 1990-1992 | Non-temperate | 138 | 40:8:32 (eIPV) 10:1:3 (tOPV) |
Birth (tOPV), 6, 10 w (tOPV+eIPV) | 1:8 | 4 | 28 d | 81 | 99 | 91 | 1 |
| Oman(50) | 1990-1992 | Non-temperate | 138 | 40:8:32 (eIPV) 10:1:3 (tOPV) |
Birth (tOPV), 6, 10, 14 w (tOPV+eIPV) | 1:8 | 4 | 28 d | 96 | 99 | 97 | 1 |
| Pakistan(89) | 1996 | Non-temperate | 304 | 40:8:32 (eIPV) 10:1:6 (tOPV) |
Birth, 6, 10, 14 w (tOPV), 14 w (eIPV) | 1:8 | 4 | 28 d | 90 | 96 | 95 | 2 |
| Pakistan(89) | 1996 | Non-temperate | 304 | 40:8:32 (eIPV) 10:1:6 (tOPV) |
Birth (tOPV), 6, 10, 14 w (tOPV+eIPV) | 1:8 | 4 | 28 d | 95 | 97 | 98 | 2 |
| Oman(50) | 1990-1992 | Non-temperate | 128 | 40:8:32 (eIPV) 10:1:3 (tOPV) |
Birth (tOPV), 6, 10 w (tOPV+eIPV) | 1:8 | 4 | 28 d | 94 | 99 | 95 | 1 |
| Oman(50) | 1990-1992 | Non-temperate | 128 | 40:8:32 (eIPV) 10:1:3 (tOPV) |
Birth (tOPV), 6, 10, 14 w (tOPV+eIPV) | 1:8 | 4 | 28 d | 99 | 99 | 99 | 1 |
Acronyms: d = days; eIPV = enhanced-potency inactivated poliovirus vaccine; NA = not applicable; NR = not reported; PV(1,2,3) = poliovirus (types 1, 2, and 3, respectively); w = weeks
Notes:
If not reported, we list the upper bound as the year of publication
Stratification by setting adopted from Cáceres and Sutter (2001)(32)
If not equal for all serotype, then semicolon-separated values indicates numbers for each reported serotype (e.g., PV1;PV2;PV3)
D-antigen content by serotype
Minimum antibody titer used to define seroposivity; if not reported, we assume this equals the minimal dilution tested
NA indicates that the study did not account for maternal antibody decay
Grade 1: standard vaccine formulation (40:8:32 of D-antigen content) and standard serological methods; Grade 2: non-standard vaccine formulation (or not reported), but standard serological methods; Grade 3: non-standard serological methods (see methods); if failure to account for maternal antibody decay represents the only reason for non-standard serological methods, then we still consider a 100% seroconversion rate consistent with serological standards, since the seroconversion rate would remain the same after accounting for maternal antibody decay. If this leads to different grades by serotype, then we indicated serotype-specific grades separated by semicolons.
The evidence from Tables 5-7 relate only to the ability of the vaccines to protect individuals from contracting paralytic polio. In addition to protecting individuals from disease, national decision makers must also protect the population from the possibility that any introduced WPVs or VDPVs can establish transmission. This depends on the ability of the vaccines to reduce excretion upon infection or reinfection(34,35) and managing the levels of population immunity.(9) While both IPV and OPV provide good protection against oropharyngeal excretion, OPV remains superior in its ability to induce enteric mucosal immunity, which reduces fecal excretion.(103,104) Experience with IPV in reducing WPV transmission in developed countries suggests that oropharyngeal transmission may represent an important route of transmission in temperate climate settings with good hygiene.(34-36) Since fecal-oral transmission may represent the dominant route of transmission in developing countries with tropical climates and poor hygiene settings, which also obtain lower routine immunization coverage and lower seroconversion, many developing countries elect to conduct SIAs to maintain high population immunity levels.
Supplemental Immunization Activities (SIAs)
Figure 5 shows the categories and options for SIAs, which include choices about whether to conduct SIAs, the vaccine formulation(s) to use, the number of rounds, the target age group and coverage, and the geographic scale (e.g., National Immunization Days (NIDs), Sub-NIDs (SNIDs)). Very limited recommendations exist with respect to providing criteria for determining when to conduct preemptive SIAs (i.e., SIAs intended to close an identified potential immunity gap prior to an outbreak),(105) and we believe this represents an important area for additional tools and guidance. With respect to the decision about whether to conduct SIAs in Figure 5, we anticipate that countries will first assess whether their routine immunization program provides sufficient population immunity. If population immunity is too low they will decide to conduct SIAs (Yes), if population immunity is sufficient then they will decide not to conduct SIAs (No), or they might conduct targeted SIAs in high-risk areas as needed to address a specific immunity gap or respond to a threat (e.g., concern about importation of a virus from a bordering country) (As needed).
Figure 5: Decision tree of supplemental immunization activity (SIA) policy choices and options*.
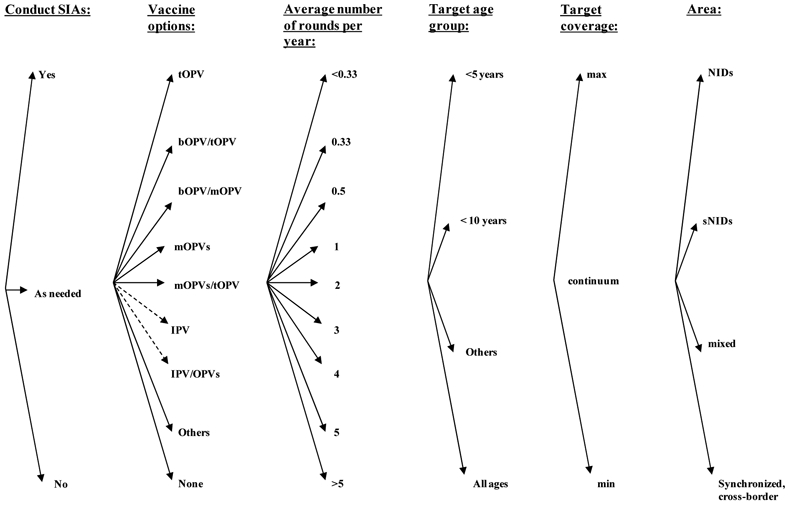
* Some countries that use OPV apply exclusion criteria from OPV vaccination and use IPV for excluded individuals
Typically only the countries that use tOPV for routine immunization perform SIAs, and consequently tOPV represents the main vaccine used. However, with the licensure of mOPV1 and mOPV3 vaccine products in 2005, these vaccines became available as tools for use in SIAs to specifically decrease immunity gaps for a specific serotype. Using mOPV instead of tOPV for an SIA round increases the immunological protection against the serotype of the mOPV,(59) but it does not provide protection against the other two serotypes.(9,16) Thus, using mOPV or bOPV for SIAs implies a relative shift in the overall population immunity profile compared to using only tOPV, and health leaders should carefully consider the impacts on population immunity. Evidence suggests that bOPV provides non-inferior response to mOPV1 and mOPV3 use for the respective serotypes, while providing superior response to the type 1 and type 3 seroconverison induced by tOPV.(66)
Countries could also potentially use IPV in SIAs, although we could not find any evidence of this occurring to date. Increasing evidence suggests that IPV can both boost mucosal immunity in subjects previously infected with a live poliovirus(36,106) and help close humoral immunity gaps among previously susceptible individuals,(50,63,69,89,107,108) although additional studies will need to evaluate its impact on poliovirus transmission and operational issues. Given that WPVs still continue to circulate and pose a threat, countries must decide whether to conduct NIDs, SNIDs, or no SIAs and link their decisions to population immunity, and we suggest that a model of population immunity might help inform their decisions.(9)
Based on the data from Tables 5-7, Table 8 summarizes cumulative seroconversion rates for the possible vaccinations that countries might consider for routine immunization. The data provide some indication of effectiveness, but countries should carefully consider the relevance of the evidence to their own situations, because we see substantial variation between studies and large ranges for many estimates. As shown in Table 8, the strictness of grading inclusion criteria applied affects the best estimates. Overall, the evidence suggests that seroconversion rates remain lower in non-temperate than in temperate settings. Serotype 2 consistently leads to the highest seroconversion rates, followed by type 1 and 3, but the difference between types reduces as seroconversion improves (e.g., going from non-temperate to temperate, or from 3 to 4 doses). While the impact of the birth dose on cumulative seroconversion with tOPV remains relatively small, Table 8 clearly shows the impact of the age at the first dose for eIPV regardless of the grading restrictions. We did not systemically review take rates for sequential schedules, but the evidence suggests that sequential vaccination performs similar to IPV-only vaccination or better.(36)
Table 8:
Best estimates for cumulative and average per-dose seroconversion rates (%), showing number of data points (n), median;mean [minimum-maximum] based on studies and grades in Tables 5-7
| Quantity | Setting | Age at first dose |
Based on grade 1 only | Based on grades 1 or 2 only | Based on all studies | |||||||||
|---|---|---|---|---|---|---|---|---|---|---|---|---|---|---|
| n | PV1 | PV2 | PV3 | n | PV1 | PV2 | PV3 | n | PV1 | PV2 | PV3 | |||
| Routine immunization: | ||||||||||||||
| Cumulative seroconversion rate, 3 tOPV | Non-temperate | ≥ 7 days | 1 | 94 | 100 | 89 | 5 | 90;86 [73-96] |
87;91 [83-100] |
76;76 [63-89] |
18 | 70;67 [6;99] |
84;84 [49-100] |
71;69 [69-100] |
| Temperate | ≥ 7 days | 0 | ND | ND | ND | 6 | 98;98 [94-100] |
100;99 [98-100] |
98;98 [96-100] |
8 | 98;97 [90-100] |
100;99 [95-100] |
98;98 [96-100] |
|
| Cumulative seroconversion rate, 4 tOPV | Non-temperate | < 7 days | 2 | 87;87 [85-89] |
94;94 [91-96] |
80;80 [66-95] |
12 | 88;90 [84-100] |
96;96 [90-100] |
85;81 [63-100] |
14 | 90;90 [84-100] |
94;95 [88-100] |
85;81 [63-100] |
| Non-temperate | ≥ 7 days | 1 | 81 | 94 | 73 | 4 | 83;84 [78-93] |
96;95 [94-97] |
72;72 [70-73] |
5 | 81;83 [78-93] |
95;95 [92-97] |
73;74 [70-83] |
|
| Temperate | Any | 0 | NDa | NDa | NDa | 1 | 98a | 99a | 99a | 1 | 98a | 99a | 99a | |
| Cumulative seroconversion rate, 2 eIPV | Non-temperate | ≤ 6 weeks | 3 | 71;61 [40-73] |
78;70 [48-83] |
81;84 [79-94] |
4b | 55;54 [33-73] |
67;66 [48-83] |
80;74 [44-94] |
4b | 55;54 [33-73] |
67;66 [48-83] |
80;74 [44-94] |
| Non-temperate | > 6 weeksc | 7 | 90;89 [90-96] |
90;89 [80-93] |
93;92 [86-97] |
8d | 91;90 [71-96] |
88;84 [70-93] |
93;90 [72-97] |
8d | 91;90 [71-96] |
88;84 [70-93] |
93;90 [72-97] |
|
| Temperate | Any | 0 | NDe | NDe | NDe | 0 | NDe | NDe | NDe | 0 | NDe | NDe | NDe | |
| Cumulative seroconversion rate, 3 eIPV | Non-temperate | ≤ 6 weeks | 6 | 90;87 [67-98] |
91;87 [65-98] |
98;97 [94-100] |
8b | 90;85 [53-99] |
90;88 [65-98] |
97-94 [69-100]f |
9b | 89;85 [53-99] |
88;88 [65-98] |
97;94 [69-100] |
| Non-temperate | > 6 weeksc | 2 | 100;100 [100-100] |
100;100 [100-100] |
100;100 [99-100] |
4d | 98;97 [90-100] |
98;94 [79-100] |
98;99 [97-99] |
5d | 97;97 [90-100] |
96;94 [79-100] |
98;98 [97-99] |
|
| Temperate | Any | 0 | 100e,f | NDe | NDe | 0 | 100e,f | NDe | NDe | 2g | 99;99 [98-100] |
90;90 [90-91] |
97;97 [97;98] |
|
| SIAs: | ||||||||||||||
| Average per-dose seroconversion rate, tOPVh | Non-temperate | ≥ 7 days | 2 | 48;48 [34-63] |
64;64 [50-78] |
40;40 [28-53] |
9 | 38;45 [32-67] |
53;57 [45-78] |
28;34 [26-53] |
23 | 33;37 [2-76] |
49;51 [20-84] |
29;35 [13-86] |
| Temperate | ≥ 7 days | 0 | ND | ND | ND | 5 | 72;71 [61-79] |
78;76 [72-78] |
73;73 [66-78] |
7 | 72;69 [53-79] |
78;75 [64-81] |
72;72 [66-78] |
|
| Average per-dose seroconversion rate, mOPVi | Non-temperate | Any | 3j | 64;63 [57-68] |
68 | 60 | 3j | 64;63 [57-68] |
68 | 60 | 3j | 64;63 [57-68] |
68 | 60 |
| Temperate | Any | 0 | NDk | NDk | NDk | 0 | NDk | NDk | NDk | 0 | NDk | NDk | NDk | |
| Average per-dose seroconversion rate, bOPVg | Non-temperate | Any | 1 | 62 | NA | 49 | 1 | 62 | NA | 49 | 1 | 62 | NA | 49 |
| Temperate | Any | ND | ND | ND | ND | ND | ND | ND | ND | ND | ||||
Acronyms: bOPV = bivalent (types 1&3) oral poliovirus vaccine; NA = not applicable; ND = no data; eIPV = enhanced-potency inactivated poliovirus vaccine; mOPV = monovalent oral poliovirus vaccine; PV(1,2,3) = poliovirus (types 1, 2, and 3, respectively); tOPV = trivalent oral poliovirus vaccine
Notes:
While we found only one seroconversion data point for this stratum, numerous studies suggest near 100% seropositivity after 3 or more tOPV doses in temperate countries(62)
Includes data point from study arms that received the first dose at 6-8,(43) 6-24,(99) or 6-45 weeks(98)
While we found no seroconversion data for this stratum, numerous studies suggest near 100% seropositivity after 2 or more eIPV doses in temperate countries(36)
One more data point for this serotype given inclusion of 100% seroconversion rate data point from a study that did not include maternal immunity decay (Table 6)
Includes one data point for IPV with variable potency based on Sabin seed strains(87)
Average per-dose seroconversion rate that gives the cumulative seroconversion rate measured after 3 or 4 tOPV doses administered in schedules without a birth dose, computed as 1-(1-cum. serconv. rate after d doses)1/d; For studies that report 100% cumulative seroconversion, this formula would imply 100% seroconversion per dose, but to reflect the reality that not all subjects would seroconvert to each dose and that sufficiently large trial would detect some non-responders, we arbitrarily set the cumulative seroconversion rate at 99.9%. This translates into per-dose seroconversion rates of 78% (3-dose cumulative seroconversion of 99.9%) or 68% (4-dose cumulative seroconversion of 99.9%).
Average per-dose seroconversion rate that gives the cumulative seroconversion rate measured after 2 mOPV or bOPV doses, computed as 1-(1-cum. serconv. ate after d doses)1/d. Given that all three available studies administered the first dose at birth,(59,65,66)we did not impose any restrictions in the age at first dose, although possibly administration of the first dose at older age may have resulted in different cumulative seroconversion rates.
Only one data point available for mOPV2 and mOPV3
While we found no recent seroconversion studies (i.e., published 1978 or later) for mOPV in temperate-climate countries, Cáceres and Sutter (2001)(39) revievewed earlier mOPV seroconversion studies and found per-dose seroconversion rates of 95 (range 90-100), 98 (range 83-100) and 94 (range 74-100) for types 1, 2, and 3, respectively.
Countries that conduct SIAs typically give single doses of OPV vaccine administered during each round to all people in the target population, regardless of vaccination history. Thus, the fraction that remains susceptible after exposure to multiple SIA rounds depends on the average seroconversion rate obtained with each dose, as estimated in Table 8. We calculate these from the cumulative seroconversion rates from Table 5 observed after 3 or 4 doses, excluding birth dose schedules since they may behave differently. With the current widespread use of mOPVs and bOPV for SIAs, Table 8 also includes available estimates from recent trials that compared these with tOPV(59,65,66) with relatively high per-dose take rates observed before 1978 for temperate climates reviewed elsewhere.(39)
Discussion
With most countries in the world currently free of all three types of WPVs and cVDPVs, maintaining high levels of population immunity for polio represents a critical issue that nations should continue to prioritize due to the known risk of outbreaks following reintroduction of a live poliovirus and continued exportation of WPV1 and WPV3 from endemic and reinfected countries. The 2010 outbreaks in Tajikistan and Congo served as painful reminders that the absence of observed cases over a period of several years does not guarantee the maintenance of sufficiently high levels of population immunity to keep any future imported viruses from causing an outbreak. They also substantiated the need for a population immunity model applicable to countries with relatively low routine immunization coverage.(9) Complete eradication of WPVs continues to represent the best strategy to minimize the risk of WPV importation(9,25)
Countries face a large number of choices to maintain high levels of population immunity, including whether to use IPV or OPV for routine immunization and whether to conduct periodic SIAs. Endemic countries or countries experiencing frequent WPV introductions face more complicated choices, because they must determine the number of SIAs to conduct with mOPVs, bOPV, and/or tOPV, or potentially with IPV, to pre-empt or respond to serotype-specific threats. Recent experience with efforts that focused on using mOPV1 to reduce the burden of WPV1(109) between 2006-9 in India led to increased susceptibility to types 2 and 3 and outbreaks of WPV3 and to cVDPV2 cases.(3,110) Similarly, the shift to the nearly exclusive use of mOPV1 and mOPV3 in SIAs instead of tOPV between 2006-9 in Nigeria,(12,111) which did not achieve high levels of coverage, increased susceptibility to type 2 and led to the largest documented cVDPV type 2 outbreak to date.(112) We suggest that understanding population immunity emerges as the key to prevention and to determining optimal policies,(9) although we note that practical considerations such as costs, supply constraints, combination vaccines and harmonization with other childhood vaccines all remain important factors that we identified in our review as likely to influence national decisions. National and global immunization policy makers can use the decision trees and context presented here to identify and evaluate their poliovirus immunization options and to estimate the expected seroconversion.
Additional research, policy development, and discussion play important roles in encouraging simplification of vaccination strategies for both routine immunization and SIAs. The remarkable range of existing schedules provides some indication that vaccine choice and schedule decisions might benefit from optimization at the national and global levels. The evolution of different combination vaccine products continues to complicate choices, since national health leaders will need to consider the optimal timing of a vaccine containing multiple antigens. At the same time, the inclusion of IPV in combination vaccines may make it easier to protect children from polio at a time when parents do not see cases of paralytic polio impacting their children, and consequently they may not perceive a great need for the vaccine.
With current discussions about coordinated global cessation of type 2 OPV (OPV2),(16) we expect that many countries that do not use IPV now will begin to explore the potential role of IPV in their immunization programs. Currently, manufacturers do not produce sufficient quantities of IPV to supply enough doses to meet a complete global switch from OPV to IPV, but they could do so in the future. In addition, the significantly higher vaccine and delivery costs associated with IPV compared to OPV make it a relatively poor option with respect to its cost-effectiveness.(14) However, current efforts underway to develop cheaper and more abundant supplies of IPV may soon support the introduction of at least a single dose of IPV in all countries that wish to provide some protection from paralysis to those who receive the IPV from a potentially reintroduced type 2 live poliovirus. We find the national and global vaccination options remarkably complex, and we hope that this paper provides some useful context for national policymakers with respect to identifying their current polio vaccination options.
Acknowledgments
Drs. Thompson and Duintjer Tebbens thank the Bill and Melinda Gates Foundation for providing a contract to Kid Risk, Inc. to support their work on this paper under Work Order 4533-17492. The contents of this manuscript are solely the responsibility of the authors and do not necessarily represent the official views of the Bill and Melinda Gates Foundation or the US Centers for Disease Control.
References
- 1.Thompson KM. Modeling poliovirus risks and the legacy of polio eradication. Risk Analysis. 2013; In press. [DOI] [PMC free article] [PubMed] [Google Scholar]
- 2.World Health Organization. Transmission of wild poliovirus type 2: Apparent global interruption. Weekly Epidemiological Record. 2001; 76, 95–97. [PubMed] [Google Scholar]
- 3.World Health Organization. Global Polio Eradication Initiative -- cases of wild poliovirus by country and by year 2000-2012. Available at: http://www.polioeradication.org/Dataandmonitoring/Poliothisweek/Wildpolioviruslist.aspx, accessed January 2, 2013.
- 4.World Health Organization. Polio news - April 2001. Geneva; 2001. Report No.: WHO/POLIO/01.02. [Google Scholar]
- 5.World Health Organization . Polio news - December 2000. Geneva; 2000. Report No.: WHO/POLIO/00.08. [Google Scholar]
- 6.World Health Organization. India records one year without polio cases. Available at: http://www.who.int/mediacentre/news/releases/2012/polio_20120113/en/index.html, accessed January 2, 2013.
- 7.World Health Organization Regional Office for Europe. WHO epidemiological brief: Tajikistan polio outbreak and regional response 2010: http://www.euro.who.int/__data/assets/pdf_file/0019/118342/EPI_TJK_Issue3.pdf, accessed January 2, 2013.
- 8.MacDonald N, Hébert PC. Polio outbreak in Tajikistan is cause for alarm. Canadian Medical Association Journal 2010;182(10):1013. [DOI] [PMC free article] [PubMed] [Google Scholar]
- 9.Thompson KM, Pallansch MA, Duintjer Tebbens RJ, Wassilak SGF, Cochi SL. Modeling population immunity to support efforts to end the transmission of live polioviruses. Risk Analysis. 2012; DOI: 10.1111/j.1539-6924.2012.01891.x. [DOI] [PMC free article] [PubMed] [Google Scholar]
- 10.World Health Organization. Circulating vaccine-derived poliovirus (cVDPV) 2000-2012. Available at: http://www.polioeradication.org/Dataandmonitoring/Poliothisweek/Circulatingvaccinederivedpoliovirus.aspx, accessed January 2, 2013.
- 11.Duintjer Tebbens RJ, Pallansch MA, Kim JH, Burns CC, Kew OM, Oberste S, Diop O, Wassilak SGF, Cochi SL, Thompson KM. Oral poliovirus vaccine evolution and insights relevant to modeling the risks of circulating vaccine-derived polioviruses. Risk Analysis. 2013; In press. [DOI] [PMC free article] [PubMed] [Google Scholar]
- 12.Wassilak SGF, Pate MA, Wannemuehler K, Jenks J, Burns C, Chenoweth P, Abanida EA, Adu F, Baba M, Gasasira A, Iber J, Mkanda P, Williams AJ, Shaw J, Pallansch MA, Kew OM. Outbreak of type 2 vaccine-derived poliovirus in Nigeria: Emergence and widespread circulation in an underimmunized population. Journal of Infectious Diseases 2011;203(7):898–909. [DOI] [PMC free article] [PubMed] [Google Scholar]
- 13.World Health Assembly. Poliomyelitis: Mechanism for management of potential risks to eradication (resolution 61.1). Geneva: World Health Organization; 2008. http://apps.who.int/gb/ebwha/pdf_files/WHA61-REC1/A61_Rec1-part2-en.pdf, accessed January 2, 2013. [Google Scholar]
- 14.Thompson KM, Duintjer Tebbens RJ, Pallansch MA, Kew OM, Sutter RW, Aylward RB, Watkins M, Gary HE Jr., Alexander JP Jr., Jafari H, Cochi SL. The risks, costs, and benefits of possible future global policies for managing polioviruses. American Journal of Public Health 2008;98(7):1322–1330. [DOI] [PMC free article] [PubMed] [Google Scholar]
- 15.Thompson KM, Duintjer Tebbens RJ. The case for cooperation in managing and maintaining the end of poliomyelitis: Stockpile needs and coordinated OPV cessation. The Medscape Journal of Medicine 2008;10(8):190. [PMC free article] [PubMed] [Google Scholar]
- 16.Thompson KM, Duintjer Tebbens RJ. Current polio global eradication and control policy options: Perspectives from modeling and prerequisites for OPV cessation. Expert Reviews of Vaccines 2012;11(4):449–459. [DOI] [PubMed] [Google Scholar]
- 17.Thompson KM, Duintjer Tebbens RJ. Challenges related to the economic evaluation of the direct and indirect benefits and the costs of disease elimination and eradication efforts. Chapter 9 in Cochi SL and Dowdle WR (eds). Disease Eradication in the 21st Century: Implications for Global Health. Cambridge, MA: MIT Press, 2011. [Google Scholar]
- 18.Thompson KM, Duintjer Tebbens RJ. Retrospective cost-effectiveness analyses for polio vaccination in the United States. Risk Analysis 2006;26(6):1423–1440. [DOI] [PubMed] [Google Scholar]
- 19.Duintjer Tebbens RJ, Pallansch MA, Cochi SL, Wassilak SGF, Linkins J, Sutter RW, Aylward RB, Thompson KM. Economic analysis of the Global Polio Eradication Initiative. Vaccine 2011;29(2):334–343. [DOI] [PubMed] [Google Scholar]
- 20.Thompson KM, Duintjer Tebbens RJ. Eradication versus control for poliomyelitis: An economic analysis. Lancet 2007;369(9570):1363–1371. [DOI] [PubMed] [Google Scholar]
- 21.Sangrujee NK, Duintjer Tebbens RJ, Cáceres VM, Thompson KM. Policy decision options during the first five years following certification of polio eradication. Medscape General Medicine 2003(December 19);5(4):35. [PubMed] [Google Scholar]
- 22.Duintjer Tebbens RJ, Pallansch MA, Kew OM, Cáceres VM, Sutter RW, Thompson KM. A dynamic model of poliomyelitis outbreaks: Learning from the past to help inform the future. American Journal of Epidemiology 2005;162(4):358–372. [DOI] [PubMed] [Google Scholar]
- 23.Thompson KM. Poliomyelitis and the role of risk analysis in global infectious disease policy and management. Risk Analysis 2006;26(6):1419–1421. [DOI] [PubMed] [Google Scholar]
- 24.Aylward RB, Sutter RW, Cochi SL, Thompson KM, Jafari H, Heymann DL. Risk management in a polio-free world. Risk Analysis 2006;26(6):1441–1448. [DOI] [PubMed] [Google Scholar]
- 25.Duintjer Tebbens RJ, Pallansch MA, Kew OM, Cáceres VM, Jafari H, Cochi SL, Aylward RB, Thompson KM. Risks of paralytic disease due to wild or vaccine-derived poliovirus after eradication. Risk Analysis 2006;26(6):1471–1505. [DOI] [PubMed] [Google Scholar]
- 26.Duintjer Tebbens RJ, Sangrujee N, Thompson KM. The costs of polio risk management policies after eradication. Risk Analysis 2006;26(6):1507–1531. [DOI] [PubMed] [Google Scholar]
- 27.Thompson KM, Duintjer Tebbens RJ, Pallansch MA. Evaluation of response scenarios to potential polio outbreaks using mathematical models. Risk Analysis 2006;26(6):1541–1556. [DOI] [PubMed] [Google Scholar]
- 28.Thompson KM, Duintjer Tebbens RJ, Pallansch MA, Kew OM, Sutter RW, Aylward RB, Watkins M, Gary HE Jr., Alexander JP Jr., Venczel L, Johnson D, Cáceres VM, Sangrujee N, Jafari H, Cochi SL. Development and consideration of global policies for managing the future risks of poliovirus outbreaks: Insights and lessons learned through modeling. Risk Analysis 2006;26(6):1571–1580. [DOI] [PubMed] [Google Scholar]
- 29.de Gourville EM, Sangrujee N, Duintjer Tebbens RJ, Pallansch MA, Thompson KM. Global surveillance and the value of information: The case of the global polio laboratory network. Risk Analysis 2006;26(6):1557–1569. [DOI] [PubMed] [Google Scholar]
- 30.Duintjer Tebbens RJ, Pallansch MA, Kew OM, Sutter RW, Aylward RB, Watkins M, Gary HE Jr., Alexander JP Jr., Jafari H, Cochi SL, Thompson KM. Uncertainty and sensitivity analyses of a decision analytic model for post-eradication polio risk management. Risk Analysis 2008;28(4):855–876. [DOI] [PubMed] [Google Scholar]
- 31.Duintjer Tebbens RJ, Pallansch MA, Alexander JP Jr., Thompson KM. Optimal vaccine stockpile design for an eradicated disease: Application to polio. Vaccine 2010;28(26):4312–4327. [DOI] [PubMed] [Google Scholar]
- 32.World Health Organization. Polio vaccines and polio immunization in the pre-eradication era: WHO position paper. Weekly Epidemiological Record 2010;85:213–228. [PubMed] [Google Scholar]
- 33.World Health Organization. WHO vaccine-preventable diseases: Monitoring system - 2012 global summary (data up to December 2012) 2012: http://apps.who.int/immunization_monitoring/en/globalsummary/ScheduleResult.cfm, accessed January 2, 2013. [Google Scholar]
- 34.Duintjer Tebbens RJ, Pallansch MA, Chumakov KM, Halsey NA, Hovi T, Minor PD, Modlin JF, Patriarca PA, Sutter RW, Wright PF, Wassilak SGF, Cochi SL, Kim J-H, Thompson KM. Expert review on poliovirus immunity and transmission. Risk Analysis. 2012; DOI: 10.1111/j.1539-6924.2012.01864.x. [DOI] [PMC free article] [PubMed] [Google Scholar]
- 35.Duintjer Tebbens RJ, Pallansch MA, Kalkowska DA, Wassilak SGF, Cochi SL, Thompson KM. Characterizing poliovirus transmission and evolution: Insights from modeling experiences with wild and vaccine-related polioviruses. Risk Analysis. 2013; In press. [DOI] [PMC free article] [PubMed] [Google Scholar]
- 36.Plotkin SA, Orenstein WA, Offit PA. Vaccines. Fifth ed: Saunders Elsevier; 2008. [Google Scholar]
- 37.Patriarca PA, Wright PF, John TJ. Factors affecting the immunogenicity of oral poliovirus vaccine in developing countries: Review. Reviews of Infectious Diseases 1991;13:926–39. [DOI] [PubMed] [Google Scholar]
- 38.Sutter RW, Cáceres VM, Más Lago P. The role of routine immunization in the postcertification era. Bulletin of the World Health Organization 2004;82(1):31–38. [PMC free article] [PubMed] [Google Scholar]
- 39.Cáceres VM, Sutter RW. Sabin monovalent oral polio vaccines: Review of past experiences and their potential use after polio eradication. Clinical Infectious Diseases 2001;33(4):531–541. [DOI] [PubMed] [Google Scholar]
- 40.Kavanagh B The GRADE system for rating clinical guidelines. PLoS Medicine 2009;6(9):e1000094. [DOI] [PMC free article] [PubMed] [Google Scholar]
- 41.GRADE Working Group. Grading quality of evidence and strength of recommendations. British Medical Journal 2004;328:1–8.14703521 [Google Scholar]
- 42.McBean AM, Thoms ML, Albrecht P, Cuthie JC, Bernier R. Serologic response to oral polio vaccine and enhanced-potency inactivated polio vaccines. American Journal of Epidemiology 1988;128(3):615–628. [DOI] [PubMed] [Google Scholar]
- 43.Nirmal S, Cherian T, Samuel B, Rajasingh J, Raghupathy P, John TJ. Immune response of infants to fractional doses of intradermally administered inactivated poliovirus vaccine. Vaccine 1998;16(9-10):928–931. [DOI] [PubMed] [Google Scholar]
- 44.Resik S, Tejeda A, Lago PM, Diaz M, Carmenates A, Sarmiento L, Alemani N, Galindo B, Burton A, Friede M, Landaverde M, Sutter RW. Randomized controlled clinical trial of fractional doses of inactivated poliovirus vaccine administered intradermally by needle-free device in Cuba. Journal of Infectious Diseases 2011;201(9):1344–1352. [DOI] [PubMed] [Google Scholar]
- 45.Mohammed AJ, Al Awaidy S, Bawikar S, Kurup PJ, Elamir E, Shaban MM, Sharif SM, van der Avoort HG, Pallansch MA, Malankar P, Burton A, Sreevatsava M, Sutter RW. Fractional doses of inactivated poliovirus vaccine in Oman. New England Journal of Medicine 2010;362(25):2351–2359. [DOI] [PubMed] [Google Scholar]
- 46.Wood DJ, Heath AB. Comparability of poliovirus neutralizing antibody tests. Biologicals 1992;20(4):293–300. [DOI] [PubMed] [Google Scholar]
- 47.World Health Organization. Polio laboratory manual. Geneva; 2004. November. Report No.: WHO/IVB/04.10. [Google Scholar]
- 48.Thompson KM, Wallace GS, Duintjer Tebbens RJ, Smith PH, Barskey AE, Pallansch MA, Gallagher KM, Alexander JP, Armstrong GL, Cochi SL, Wassilak SG. Trends in the risk of u.S. Polio outbreaks and poliovirus vaccine availability for response. Public Health Reports 2012;127(1):23–37. [DOI] [PMC free article] [PubMed] [Google Scholar]
- 49.Bhaskaram P, et al. Systemic and mucosal immune response to polio vaccination with additional dose in newborn period. Journal of Tropical Pediatrics 1997;43:232–234. [DOI] [PubMed] [Google Scholar]
- 50.World Health Organization Collaborative Study Group on Oral and Inactivated Poliovirus Vaccines. Combined immunization of infants with oral and inactivated poliovirus vaccines: Results of a randomized trial in the Gambia, Oman, and Thailand. WHO collaborative study group on oral and inactivated poliovirus vaccines. Bulletin of the World Health Organization 1996;74(3):253–268. [PMC free article] [PubMed] [Google Scholar]
- 51.Sormunen H, Stenvik M, Eskola J, Hovi T. Age- and dose-interval-dependent antibody responses to inactivated poliovirus vaccine. Journal of Medical Virology 2001;63(4):305–310. [DOI] [PubMed] [Google Scholar]
- 52.Vidor E, Meschievitz C, Plotkin S. Fifteen years of experience with vero-produced enhanced potency inactivated poliovirus vaccine. Pediatric Infectectious Disease Journal 1997;16(3):312–322. [DOI] [PubMed] [Google Scholar]
- 53.Centers for Disease Control and Prevention. Updated recommendations of the Advisory Committee on Immunization Practices (ACIP) regarding routine poliovirus vaccination. Morbidity and Mortality Weekly Report 2009;58(30):829–830. [PubMed] [Google Scholar]
- 54.Fine PEM, Sutter RW, Orenstein WA. Stopping a polio outbreak in the post-eradication era. Developments in Biologicals 2001;105:129–147. [PubMed] [Google Scholar]
- 55.The Cuba IPV Study Collaborative Group. Randomized, placebo-controlled trial of inactivated poliovirus vaccine in Cuba. New England Journal of Medicine 2007;356(15):1536–1544. [DOI] [PubMed] [Google Scholar]
- 56.Myaux JA, Unicomb L, Besser RE, Modlin JF, Uzma A, Islam AM, Santosham M. Effect of diarrhea on the humoral response to oral polio vaccination. Pediatric Infectectious Disease Journal 1996;15(3):204–209. [DOI] [PubMed] [Google Scholar]
- 57.Weckx LY, Schmidt BJ, Herrmann AA, Miyasaki CH, Novo NF. Early immunization of neonates with trivalent oral poliovirus vaccine. Bulletin of the World Health Organization 1992;70(1):85–91. [PMC free article] [PubMed] [Google Scholar]
- 58.World Health Organization Collaborative Study Group on Oral Poliovirus Vaccine. Factors affecting the immunogenicity of oral poliovirus vaccine: A prospective evaluation in Brazil and the Gambia. World Health Organization collaborative study group on oral poliovirus vaccine. Journal of Infectious Diseases 1995;171(5):1097–1106. [DOI] [PubMed] [Google Scholar]
- 59.El-Sayed N, El-Gamal Y, Abbassy AA, Seoud I, Salama M, Kandeel A, Hossny E, Shawky A, Hussein HA, Pallansch MA, van der Avoort HG, Burton AH, Sreevatsava M, Malankar P, Wahdan MH, Sutter RW. Monovalent type 1 oral poliovirus vaccine in newborns. New England Journal of Medicine 2008;359(16):1655–1665. [DOI] [PubMed] [Google Scholar]
- 60.Böttiger M, Litvinov S, Assaad F, Lundbeck H, Heller L, Beausoleil E. Antibodies against poliomyelitis and measles viruses in immunized and unimmunized children, Ghana 1976-78. Bulletin of the World Health Organization 1981;59(5):729–736. [PMC free article] [PubMed] [Google Scholar]
- 61.Osei-Kwasi M, Afari EA, Mimura K, Obeng-Ansah I, Ampofo WK, Nkrumah FK. Randomized, controlled trial of trivalent oral poliovirus vaccine (Sabin) starting at birth in Ghana. Bull World Health Organ 1995;73(1):41–46. [PMC free article] [PubMed] [Google Scholar]
- 62.Khare S, Kumari S, Nagpal I, Sharma D, Verghese T. Oral polio vaccination in infants: Beneficial effect of additional dose at birth. Indian Journal of Pediatrics 1993;60(2):275–281. [DOI] [PubMed] [Google Scholar]
- 63.Jain P, Dutta A, Nangia S, Khare S, Saili A. Seroconversion following killed polio vaccine in neonates. Indian Journal of Pediatrics 1997;64(4):511–515. [DOI] [PubMed] [Google Scholar]
- 64.Bhaskaram P, Balakrishna N. Effect of administration of 200,000 IU of vitamin A to women within 24 hrs after delivery on response to PPV administered to the newborn. Indian Pediatrics 1998;35(3):217–222. [PubMed] [Google Scholar]
- 65.John TJ, Jain H, Ravishankar K, Amaresh A, Verma H, Deshpande J, Pallansch MA, Singh AP, Sreevatsava M, Burton A, Malankar P, Chatterjee A, Sutter RW. Monovalent type 1 oral poliovirus vaccine among infants in India: Report of two randomized double-blind controlled clinical trials. Vaccine 2011;29(34):5793–5801. [DOI] [PubMed] [Google Scholar]
- 66.Sutter RW, John TJ, Jain H, Agarkhedkar S, Ramanan PV, Verma H, Deshpande JM, Singh AP, Sreevatsava M, Malankar P, Burton A, Chatterjee A, Jafari H, Aylward RB. Immunogenicity of bivalent types 1 and 3 oral poliovirus vaccine: A randomised, doubleblind, controlled trial. The Lancet 2010;376(9753):1682–1688. [DOI] [PubMed] [Google Scholar]
- 67.Maldonado YA, Peña-Cruz V, Sanchez MD, Logan L, Blandón S, Cantwell MF, Matsui SM, MillanVelasco F, Valdespino JL, Sepulveda J. Host and viral factors affecting the decreased immunogenicity of Sabin type 3 vaccine after administration of trivalent oral polio vaccine to rural Mayan children. Journal of Infectious Diseases 1997;175(3):545–553. [DOI] [PMC free article] [PubMed] [Google Scholar]
- 68.Waggie Z, Geldenhuys H, Sutter RW, Jacks M, Mulenga H, Mahomed H, De Kock M, Hanekom W, Pallansch MA, Kahn AL, Burton AH, Sreevatsava M, Hussey G. Randomized trial of type 1 and type 3 oral monovalent poliovirus vaccines in newborns in Africa. Journal of Infectious Diseases 2012;205(2):228–236. [DOI] [PubMed] [Google Scholar]
- 69.Simasathien S, Migasena S, Beuvery C, Vansteenis G, Samakoses R, Pitisuttitham P, Vesikari T. Comparison of enhanced potency inactivated poliovirus vaccine (EIPV) versus standard oral poliovirus vaccine (OPV) in Thai infants. Scandinavian Journal of Infectious Diseases 1994;26(6):731–738. [DOI] [PubMed] [Google Scholar]
- 70.Triki H, Abdallah M, Ben Aissa R, Bouratbine A, Kacem MBA, Bouraoui S, Koubaa C, Zouari S, Mohsni E, Crainic R, Dellagi K. Influence of host related factors on the antibody response to trivalent oral polio vaccine in Tunisian infants. Vaccine 1997;15(10):1123–1129. [DOI] [PubMed] [Google Scholar]
- 71.Dong DX, Hu XM, Liu WJ, Li JS, Jin YC, Tan SG, Chen TQ, Fu JZ, Niu BY, Yu HM, Zhou Y. Immunization of neonates with trivalent oral poliomyelitis vaccine (Sabin). Bulletin of the World Health Organization 1986;64(6):853–860. [PMC free article] [PubMed] [Google Scholar]
- 72.Vodopija I, Baklaic Z, Vlatkovic R, Bogaerts H, Delem A, Andre FE. Combined vaccination with live oral polio vaccine and the bovine rotavirus RIT 4237 strain. Vaccine 1986;4(4):233–236. [DOI] [PubMed] [Google Scholar]
- 73.Giammanco G, De Grandi V, Lupo L, Mistretta A, Pignato S, Teuween D, Bogaerts H, Andre FE. Interference of oral poliovirus vaccine on RIT 4237 oral rotavirus vaccine. European Journal of Epidemiology 1988;4(1):121–123. [DOI] [PubMed] [Google Scholar]
- 74.Cohen-Abbo A, Culley BS, Reed GW, Sannella EC, Mace RL, Robertson SE, Wright PF. Seroresponse to trivalent oral poliovirus vaccine as a function of dosage interval. Pediatric Infectious Diseases Journal 1995;14(2):100–106. [DOI] [PubMed] [Google Scholar]
- 75.Osei-Kwasi M, Afari EA, Mimura K, Obengansah I, Ampofo WK, Nkrumah FK. Randomized, controlled trial of trivalent oral poliovirus vaccine (Sabin) starting at birth in Ghana. Bulletin of the World Health Organization 1995;73(1):41–46. [PMC free article] [PubMed] [Google Scholar]
- 76.Hardas U, Pathak A, Jahagirdar V. Sero-conversion after oral polio vaccine. Indian Journal of Pediatrics 1978;45(10):310–313. [DOI] [PubMed] [Google Scholar]
- 77.John T Immune response of neonates to oral poliomyelitis vaccine. British Medical Journal 1984;289(6449):881. [DOI] [PMC free article] [PubMed] [Google Scholar]
- 78.Agarwal A, Sharma D, Kumari S, Khare S. Antibody response to three doses of standard and double dose of trivalent oral polio vaccine. Indian Pediatrics 1991;28(10):1141–1145. [PubMed] [Google Scholar]
- 79.Bavdekar SB, Naik S, Nadkarni SS, Kamat JR, Deshpande JM, Vaswani LK. Effect of passively transferred anti-poliovirus antibodies on seroconversion. Indian Journal of Pediatrics 1999;66(1):45–48. [DOI] [PubMed] [Google Scholar]
- 80.Semba RD, Muhilal, Mohgaddam NE, Munasir Z, Akib A, Permaesih D, Muherdiyantiningsih, Osterhaus A. Integration of vitamin A supplementation with the expanded program on immunization does not affect seroconversion to oral poliovirus vaccine in infants. Journal of Nutrition 1999;129(12):2203–2205. [DOI] [PubMed] [Google Scholar]
- 81.Taffs RE, Enterline JC, Rusmil K, Muhilal, Suwardi SS, Rustama D, Djatnika, Cobra C, Semba RD, Cohen N, Asher DM. Oral iodine supplementation does not reduce neutralizing antibody responses to oral poliovirus vaccine. Bulletin of the World Health Organization 1999;77(6):484–491. [PMC free article] [PubMed] [Google Scholar]
- 82.Lahrech MT, Caudrelier P. Immunological response of moroccan children and newborns to oral poliovirus vaccine prepared on vero cells. Vaccine 1990;8(4):306–307. [DOI] [PubMed] [Google Scholar]
- 83.Oduntan S, Lucas A, Wennen E. The immunological response of Nigerian infants to attenuated and inactivated poliovaccines. Annals of Tropical Medicine and Parasitology 1978;72(2):111–115. [DOI] [PubMed] [Google Scholar]
- 84.Forbes C, Fernando N, de la Motte P, Mendis N. A survey to determine the immunity status and antibody creating effect of oral polio vaccine. The Journal of Tropical Medicine and Hygiene 1980;83(3):109–113. [PubMed] [Google Scholar]
- 85.Hogg K, Hogg G. The immunogenicity of oral poliomyelitis vaccine in a primary vaccination series at 2, 4 and 6 months given concurrently with Hib, hepatitis B and diphtheria, tetanus and whole-cell pertussis vaccines administered as three separate injections or as a combination pentavalent vaccine. Vaccine 2003;21(21-22):2906–2910. [DOI] [PubMed] [Google Scholar]
- 86.Prikazsky V, Leroux-Roels G, Van Damme P, Safary A, Colau B, Duchene M. Comparative pre-clinical and clinical experience with oral polio vaccine produced on mrc-5 cells or on primary monkey kidney cells. Vaccine 2005;23(33):4219–4227. [DOI] [PubMed] [Google Scholar]
- 87.Liao G, Li R, Li C, Sun M, Li Y, Chu J, Jiang S, Li Q. Safety and immunogenicity of inactivated poliovirus vaccine made from Sabin strains: A phase II, randomized, positive-controlled trial. Journal of Infectious Diseases 2012;205(2):237–243. [DOI] [PubMed] [Google Scholar]
- 88.Lee CY, Thipphawong J, Huang LM, Lee PI, Chiu HH, Lin W, Debois H, Harrison D, Xie F, Barreto L. An evaluation of the safety and immunogenicity of a five-component acellular pertussis, diphtheria, and tetanus toxoid vaccine (DTaP) when combined with a Haemophilus influenzae type b-tetanus toxoid conjugate vaccine (PRP-T) in Taiwanese infants. Pediatrics 1999;103(1):25–30. [DOI] [PubMed] [Google Scholar]
- 89.Parent du Chatelet I, Merchant AT, Fisher-Hoch S, Luby SP, Plotkin SA, Moatter T, Agboatwalla M, McCormick JB. Serological response and poliovirus excretion following different combined oral and inactivated poliovirus vaccines immunization schedules. Vaccine 2003;21(15):1710–1718. [DOI] [PubMed] [Google Scholar]
- 90.Heymann DL, Murphy K, Brigaud M, Aymard M, Tembon A, Maben GK. Oral poliovirus vaccine in tropical Africa: Greater impact on incidence of paralytic disease than expected from coverage surveys and seroconversion rates. Bulletin of the World Health Organization 1987;65(4):495–501. [PMC free article] [PubMed] [Google Scholar]
- 91.Richardson G, Linkins RW, Eames MA, Wood DJ, Campbell PJ, Ankers E, Deniel M, Kabbaj A, Magrath DI, Minor PD, et al. Immunogenicity of oral poliovirus vaccine administered in mass campaigns versus routine immunization programmes. Bulletin of the World Health Organization 1995;73(6):769–777. [PMC free article] [PubMed] [Google Scholar]
- 92.Rümke HC, Schlumberger M, Floury B, Nagel J, van Steenis B. Serological evaluation of a simplified immunization schedule using quadruple DPT-polio vaccine in Burkina Faso. Vaccine 1993;11(11):1113–1118. [DOI] [PubMed] [Google Scholar]
- 93.Sutter RW, Cochi SL, Melnick JL. Live attenuated poliovirus vaccines. In: Plotkin SA, Orenstein WA, editors. Vaccines. 3rd ed. Philadelphia: W.B. Saunders; 1999. [Google Scholar]
- 94.Duintjer Tebbens RJ, Pallansch MA, Chumakov KM, Halsey NA, Hovi T, Minor PD, Modlin JF, Patriarca PA, Sutter RW, Wright PF, Wassilak SGF, Cochi SL, Kim J-H, Thompson KM. Review and assessment of poliovirus immunity and transmission: Synthesis of knowledge gaps and identification of research needs. Risk Analysis; 2013: In press. [DOI] [PMC free article] [PubMed] [Google Scholar]
- 95.Böttiger M Polio immunity to killed vaccine: An 18-year follow-up. Vaccine 1990;8(5):443–445. [DOI] [PubMed] [Google Scholar]
- 96.Faden H, Duffy L, Sun M, Shuff C. Long-term immunity to poliovirus in children immunized with live attenuated and enhanced-potency inactivated trivalent poliovirus vaccines. Journal of Infectious Diseases 1993;168(2):452–454. [DOI] [PubMed] [Google Scholar]
- 97.Pirez MC, Olivera I, Diabarboure H, Montano A, Baranano R, Badia F, Bonnet MC. Seroprevalence of anti-polio antibodies in a population 7 months to 39 years of age in Uruguay: Implications for future polio vaccination strategies. Vaccine 2009;27(20):2689–2694. [DOI] [PubMed] [Google Scholar]
- 98.Simoes EAF, Padmini B, Steinhoff MC, Jadhav M, John TJ. Antibody response to two doses of inactivated poliovirus vaccine of enhanced potency. American Journal of Diseases of Children 1985;139:977–980. [DOI] [PubMed] [Google Scholar]
- 99.Singh J, Ravi RN, Dutta AK, Kumari S, Khare S. Immunogenicity of enhanced potency inactivated polio vaccine. Indian Pediatrics 1992;29(11):1353–1356. [PubMed] [Google Scholar]
- 100.Cadorna-Carlos J, Vidor E, Bonnet MC. Randomized controlled study of fractional doses of inactivated poliovirus vaccine administered intradermally with a needle in the Philippines. International Journal of Infectious Diseases 2012;16(2):e110–e116. [DOI] [PubMed] [Google Scholar]
- 101.Dayan GH, Thorley M, Yamamura Y, Rodriguez N, McLaughlin S, Torres LM, Seda A, Carbia M, Alexander LN, Caceres V, Pallansch MA. Serologic response to inactivated poliovirus vaccine: A randomized clinical trial comparing 2 vaccination schedules in Puerto Rico. Journal of Infectious Diseases 2007;195(1):12–20. [DOI] [PubMed] [Google Scholar]
- 102.Alexander LN, Seward JF, Santibanez TA, Pallansch MA, Kew OM, Prevots DR, Strebel PM, Cono J, Wharton M, Orenstein WA, Sutter RW. Vaccine policy changes and epidemiology of poliomyelitis in the United States. Journal of the American Medical Association 2004;292(14):1696–1701. [DOI] [PubMed] [Google Scholar]
- 103.Onorato IM, Modlin JF, McBean MA, Thoms ML, Losonsky GA, Bernier RH. Mucosal immunity induced by enhanced-potency inactivated and oral polio vaccines. Journal of Infectious Diseases 1991;163:1–6. [DOI] [PubMed] [Google Scholar]
- 104.Sutter RW, Kew OM, Cochi SL. Poliovirus vaccine-live. In: Plotkin SA, Orenstein WA, Offit PA, editors. Vaccines. Fifth ed: Saunders Elsevier; 2008. p. 631–686. [Google Scholar]
- 105.World Health Organization. Report of the seventh meeting of the Global Technical Consultative Group for poliomyelitis eradication. Geneva: Department of Vaccines and Biologicals, World Health Organization; 2002. April 9-11. Report No.: WHO/V&B/02.12. [Google Scholar]
- 106.Herremans TMPT, Reimerink JH, Buisman AM, Kimman TG, Koopmans MP. Induction of mucosal immunity by inactivated poliovirus vaccine is dependent on previous mucosal contact with live virus. Journal of Immunology 1999;162:5011–5018. [PubMed] [Google Scholar]
- 107.Estivariz CF, Jafari H, Sutter RW, John TJ, Jain V, Agarwal A, Verma H, Pallansch MA, Singh AP, Guirguis S, Awale J, Burton A, Bahl S, Chatterjee A, Aylward RB. Immunogenicity of supplemental doses of poliovirus vaccine for children aged 6-9 months in moradabad, India: A community-based, randomised controlled trial. Lancet Infect Dis 2012;12(2):128–135. [DOI] [PubMed] [Google Scholar]
- 108.Quiambao B, Van Der Meeren O, Kolhe D, Gatchalian S. A randomized, dose-ranging assessment of the immunogenicity and safety of a booster dose of a combined diphtheriatetanus-whole cell pertussis-hepatitis B-inactivated poliovirus-hemophilus influenzae type b (DTPw-HBV-IPV/Hib) vaccine vs. Co-administration of DTPw-HBV/Hib and IPV vaccines in 12 to 24 months old Filipino toddlers. Human Vaccines and Immunotherapeutics 2012;8(3). [DOI] [PMC free article] [PubMed] [Google Scholar]
- 109.Grassly NC, Jafari H, Bahl S, Durrani S, Wenger J, Sutter RW, Aylward RB. Asymptomatic wild-type poliovirus infection among children with previous oral poliovirus vaccination. Journal of Infectious Diseases 2010;10:1535–1543. [DOI] [PubMed] [Google Scholar]
- 110.Centers for Disease Control and Prevention. Progress toward poliomyelitis eradication --- India, January 2007--May 2009. Morbidity and Mortality Weekly Report 2010;58(26):718–723. [PubMed] [Google Scholar]
- 111.Centers for Disease Control and Prevention. Progress toward poliomyelitis eradication --- Nigeria, January 2009--June 2010. Morbidity and Mortality Weekly Report 2010;59(26):802–807. [PubMed] [Google Scholar]
- 112.Jenkins HE, Aylward RB, Gasasira A, Donnelly CA, Mwanza M, Corander J, Garnier S, Chauvin C, Abanida E, Pate MA, Adu F, Baba M, Grassly NC. Implications of a circulating vaccine-derived poliovirus in Nigeria. New England Journal of Medicine 2010;326(25):2360–2369. [DOI] [PubMed] [Google Scholar]