
Figure 6. In vivo pilot study for vaccinated mice inoculated with 4T1 tumor.
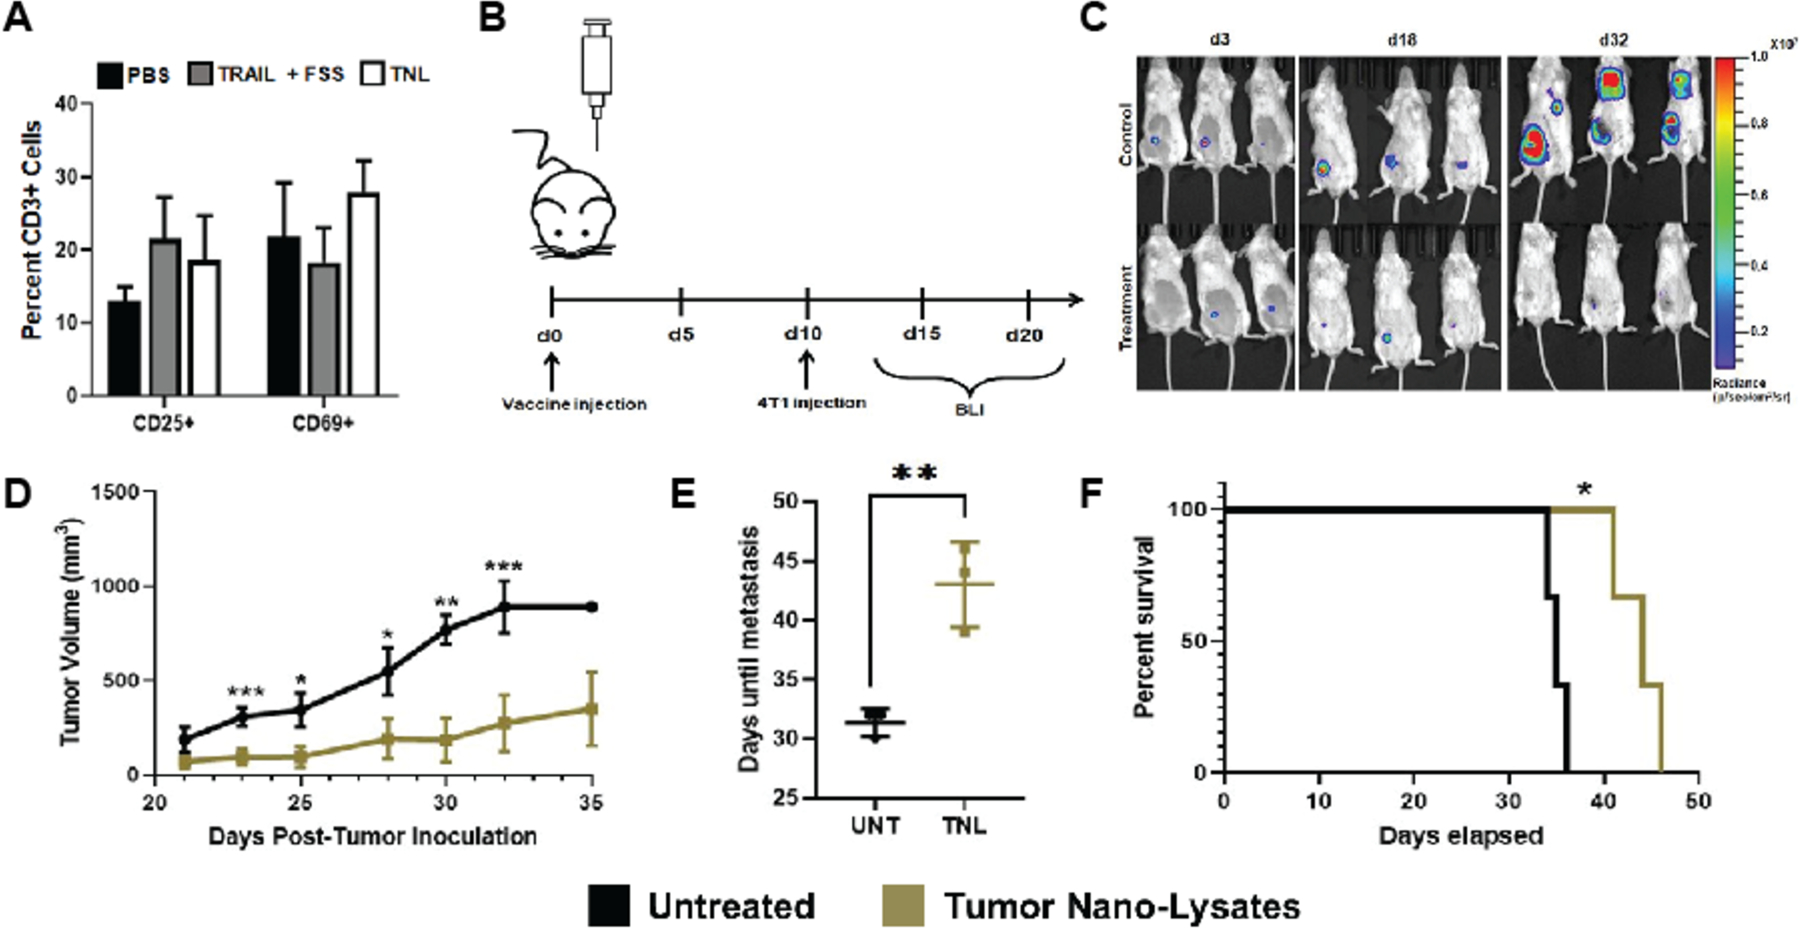
(A) In vitro assay comparing T cell activation for PBS vs TNL-treated spleenocytes. (B) Timeline for in vivo study (C) IVIS imaging of mice using bioluminescent and Luc-expressing 4T1 cells (D) Tumor size over time for measurements taken via caliper (E) Days of metastasis observation post-tumor inoculation (F) Survival curve. Statistical significance determined by two-tailed ANOVA. *p<0.05, **p<0.01, ***p<0.005