Abstract
Background
Lung squamous cell carcinoma (LUSC) is one of the major types of non-small-cell lung cancer. Epigenetic alterations, such as DNA methylation, have been recognized to be closely associated with the tumorigenesis and progression.
Material/Methods
In this study, we investigated the prognosis subgroups and assessed their correlation with clinical characteristics in LUSC using a methylation array acquired from The Cancer Genome Atlas (TCGA) database.
Results
A total of 196 DNA methylation sites exhibited a significant association with patient prognosis, and patients were further stratified into 7 prognosis subgroups based upon the consensus clustering. The patients in every subgroup were different in terms of prognosis and TNM stage. In addition, we found these 196 significant methylation sites corresponded to 258 genes. The function enrichment analysis revealed that these 258 genes enriched in biological pathways were closely related to cancers, such as DNA methylation and demethylation, cell cycle DNA replication, regulation of signal transduction by p53 class mediator, and genetic imprinting. Subsequently, we determined the levels of methylation sites in 7 subgroups, and found 24 intra-subgroup-specific methylation sites. Meanwhile, we selected 3 subgroups-specific methylation sites to construct the prognosis model for LUSC patients using multivariate Cox proportional risk regression model analysis. This model can effectively predict the prognosis of LUSC patients.
Conclusions
Our study identified a new classification of LUSC into 7 prognosis subgroups on the basis of DNA methylation data in TCGA, which demonstrated that molecular subtypes are independent factor for prognosis in LUSC. This may provide a more detailed explanation for LUSC heterogeneity. Additionally, this classification will contribute to discovery of new biomarkers of LUSC and provide more accurate subdivision of LUSC. Furthermore, these specific DNA methylation sites and corresponding genes can serve as biomarkers for early diagnosis, accurate therapy, and prognosis prediction.
Keywords: Carcinoma, Non-Small-Cell Lung; Computational Biology; DNA Methylation
Background
Lung cancer is a major public health problem and remains the leading cause of cancer-related mortality worldwide. Non-small-cell lung cancer (NSCLC) accounts for approximate 80–85% of all lung cancer cases, and lung squamous cell carcinoma (LUSC) is one of the most common histological subtypes in NSCLC [1]. Despite progress made in diagnosis and treatment of lung cancer over the past few decades, there still a lack of effective therapeutic methods for patients. Owing to differences in genetic and epigenetic changes among different subtypes of lung cancer, effective therapy for lung adenocarcinoma (LUAD) may not be available for LUSC, like epidermal growth factor receptor-tyrosine kinase inhibitors (EGFR-TKI) [2]. Therefore, more potential diagnostic biomarkers and novel therapeutic targets for LUSC still need to be discovered.
In recent years, the study of molecular characteristics in cancers has been proved to improve the treatments and prognosis in patients with cancer. For example, human epidermal growth factor receptor 2 (HER2)-positive breast cancer was associated with sensitivity to some endocrine and chemotherapy agents [3]. Owing to different treatment modalities, accurate classification of lung cancer plays an important role in targeting therapy and clinical management. Therefore, it is necessary to identify specific molecular signatures for discriminating lung cancer subtypes. A study by Lebanony et al [4] indicated that hsa-miR-205 could serve as a specific marker to distinguish LUSC from non-squamous NSCLC. Hou et al [5] revealed histo-pathological attributes of NSCLC based on the gene expression profiling datasets. Another study showed that a scoring system of hsa-miR-205, hsa-miR-21, and U6snR can divide NSCLC cases into LUAD or LUSC cases [6].
Epigenetics is defined as mitotic modulation of gene expression that occurs without alterations in the nucleotide sequences [7]. Epigenetic alterations, particularly DNA methylation, have been implicated in tumor initiation and progression [8]. DNA methylation is DNA methyl-transferase (DNMT)-mediated methylation reaction, which occurs primarily within a cytosine preceding a guanosine (CpG) dinucleotide [9]. CpG islands are clusters of CpG-rich dinucleotides frequently located in the promoter region of genes [10]. Hypermethylation of CpG islands leads to transcriptional silencing of tumor suppressor genes, while hypomethylation of CpG islands promotes transcriptional oncogenes [11]. DNA methylation is frequently associated with the occurrence and development of lung tumor, including LUSC [12]. Wang et al [13] demonstrated that AKAP13 mRNA and its methylated CpG sites were potential prognostic indicators in LUSC patients. Zhang et al found that TRIM58/cg26157385 methylation site were associated with 8 prognostic genes in LUSC [14]. A previous study showed that methylation-driven genes DQX1 and WDR61 might be potential biomarkers for predicting the prognosis of LUSC [15]. In addition, a prognostic risk model constructed with 4 abnormally methylated genes was used to predict the prognosis of LUSC patients [16]. Zhang et al [17] also reported that a risk scoring system based on the 10-gene-related methylation can be applied for predicting the outcomes of patients with LUSC. However, their classification does not provide detailed analysis, and the specific sites that are linked to each category have not been fully elucidated.
In the present study, our aim was to explore LUSC classification by identifying specific prognosis-related subtypes on the basis of DNA methylation profiles of LUSC from The Cancer Genome Atlas (TCGA) database. Additionally, based on multivariate Cox analysis, we selected 3 CpG sites to construct a risk signature to predict prognosis in patients with LUSC. This classification system may help identify novel biomarkers or molecular subtypes of LUSC to more accurately subdivide patients with LUSC. Furthermore, our classification system can provide guidance for clinicians on diagnosis and treatment for LUSC patients.
Material and Methods
Data Preprocessing and Initial Screening of DNA Methylation Sites in LUSC
A total of 370 LUSC samples and 42 paracancerous samples with DNA methylation data generated from the Illumina Infinium HuamnMethylation-450 Bead-Chip array were downloaded from the TCGA database by using the UCSC Cancer Genomics Browser [18] (https://xena.ucsc.edu/) on May 1st, 2020. We downloaded clinical information data (including 504 samples) from the TCGA database (https://portal.gdc.cancer.gov), and 403 samples provided complete clinical information, which included survival time and status as well as clinicopathological parameters (age, sex, TNM stage, T, N, and M). There were 274 matched samples between the DNA methylation profiles and the complete clinical information in patients with LUSC (Table 1). Additional information regarding surgically-extracted LUSC samples can be seen in TCGA collection protocols [19,20].
Table 1.
The clinicopathological characteristic of patents with LUSC.
| Clinical characteristic | N (274) | |
|---|---|---|
| Age | ≤65 | 104 |
| >65 | 170 | |
| Gender | Female | 69 |
| Male | 205 | |
| TNM stage | I | 123 |
| II | 104 | |
| III | 44 | |
| IV | 3 | |
| T | T1 | 65 |
| T2 | 154 | |
| T3 | 45 | |
| T4 | 10 | |
| N | N0 | 174 |
| N1 | 76 | |
| N2 | 24 | |
| M | M0 | 271 |
| M1 | 3 | |
The DNA methylation data were preprocessed as follows. First, the CpG sites with a not available ratio of over 70% were removed from all samples. Second, the k-nearest neighbors method in the impute R package was utilized to estimate the missing values in methylation profiles [21]. Batch effects from non-biological factors were adjusted with the use of the ComBat algorithm of the R package of sva. Third, we discarded the instable genomic sites in the sex chromosomes which contained the CpG sites or single-nucleotide sites [22]. Because DNA methylation in promoter regions can influence gene expression, CpG sites in promoter regions were chosen. The promoter region was defined as the 2kb sequence upstream to the 0.5kb sequence downstream in the transcription initiation site. Finally, 16 381 methylation sites were used for the following analysis.
Univariate and Multivariate Cox Proportional Hazards Regression Model Analysis of Methylation Sites
CpG sites of DNA methylation affecting survival were employed as the classification feature. First, the R package of survival coxph function was utilized to construct a univariate Cox proportional risk regression model to filter the significant CpG sites [23]. Second, the significant CpG sites obtained from the univariate model were introduced into a further multivariate Cox proportional risk regression model to determine independent prognostic factors, where age, sex, T, N, M, and TNM stage were used as the covariates in the model. Finally, the methylation sites that were still significant both in univariate and multivariate analyses were used as classification features.
Selection of Molecular Subtypes Based on Consensus Clustering
Based on the intersected methylation sites that were significant both in univariate and multivariate Cox proportional hazards regression model analysis, we used the ConsensusClusterPlus R package to obtain consistent clustering to identify the LUSC subtypes [24]. In the present study, 80% of the LUSC samples were sampled 100 times by using the resampling program. The similarity distance between samples using the Euclidean distance was calculated, and K-means was used as the clustering algorithm to obtain the reliable and stable subgroup classification.
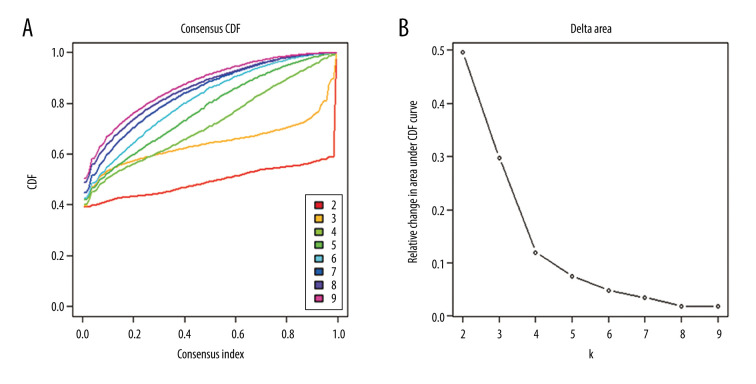
The optimal number of clusters was identified using the cumulative distribution function (CDF) and the delta area plot. The criteria for determining the optimal number of clusters should be that the consistency of the cluster was relatively high, the coefficient of variation was relatively low, and no significant rise in the area under the CDF curve. The number of categories was selected with no appreciable rise in the area under the CDF curve. The corresponding heatmap of the consensus clustering was constructed using the R package of pheatmap.
Survival and Clinical Characteristic Analysis
We used the Kaplan-Meier curve method to identify overall survival for LUSC subsets defined by DNA methylation profiles and used the log-rank test to determine the statistical differences among the clusters. The survival R package was utilized for survival analysis.
GO and KEGG Analyses for Annotated Genes by the CpG Sites
The DNA methylation sites that were statistically significant both in univariate and multivariate analyses were annotated to the corresponding genes. Subsequently, gene ontology (GO) and Kyoto Encyclopedia of Genes and Genomes pathways (KEGG) analyses were conducted on those corresponding genes with the use of the clusterProfiler package in R software [25].
Specific DNA Methylation Sites for LUSC Subgroups
To identify the subgroup-specific methylation sites, we performed the differential analysis with the screened methylation profiles of each subgroup. In addition, we analyzed prognosis-related methylation sites in each subgroup. We explored the difference in the methylation level of each CpG site between samples of a certain subgroup and those not of that subgroup using the Wilcox test (denoted as p). Moreover, we calculated the ratio (denoted as fold change (FC)) of the average methylation level of each CpG site in samples of a certain subgroup to that not of the certain subgroup. Then, the CpG sites satisfying the adjusted P value <0.05 and the absolute value of log2FC >1 were retained for further analysis.
Generation of the Prediction Model for LUSC Patients
The subgroup-specific-expressed methylation sites were used to establish a prognostic risk score to evaluate patient prognosis using multivariate Cox proportional hazards regression model analysis. Risk score=β1*the methylation level of CpG site1+ β2*the methylation level of CpG site2+β3*the methylation level of CpG site3+…+βn*the methylation level of CpG site n, where β represents the prognosis-relevant coefficient. According to the formula of the risk score, we calculated the value of each sample and set the median risk score as a cut-off to determine which samples were divided into low-risk and high-risk groups. The prognostic performance for prediction model of risk score was assessed by the area under the time-dependent receiver operating characteristic (ROC) curve.
Results
DNA Methylation Characteristic for Classification Based on Prognosis
To determine the CpG sites which were significantly related to survival in LUSC, we downloaded the 450k DNA methylation profile from TCGA database (Figure 1). After preprocessing the data, including imputing the missing values, eliminating batch effects, removing single-nucleotide sites from the sex chromosomes, and selecting CpG sites located in promoter regions, we obtained 16 381 CpG sites with 274 samples for the following analysis. The univariate Cox model was used to explore the association between each methylation site and survival data. As a result, a total of 247 methylation sites were found to be significantly associated with prognosis, with the p value set as less than 0.01. Additionally, those 247 significant methylation sites were used for multivariate Cox proportional hazards regression models, including age, sex, TNM, T, M, and N stage incorporated as the covariates in the model. Ultimately, we obtained 196 significant CpG sites (P<0.01). The methylation sites (n=196) that were significant both in univariate and multivariate analyses were obtained for further analysis.
Figure 1.
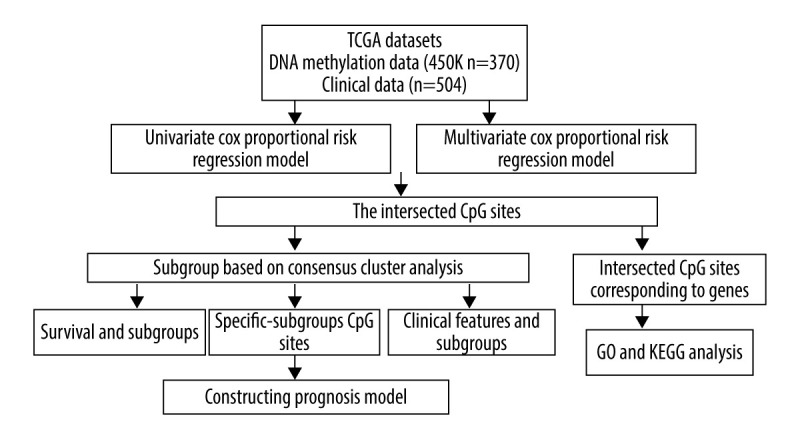
The flowchart of data analysis.
Consensus Clustering of LUSC Identified Distinct DNA Methylation Prognosis Subgroups
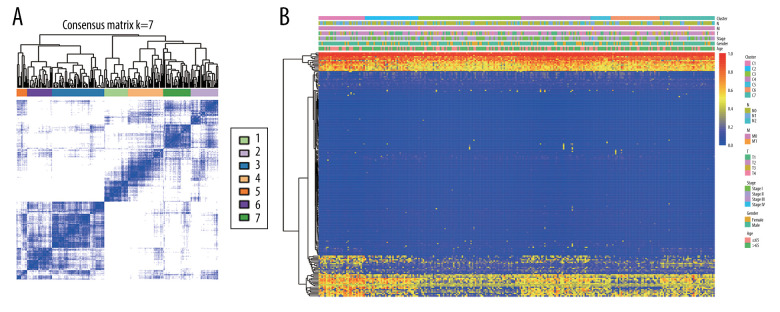
To obtain unique prognostic DNA methylation subgroups of LUSC, consensus clustering of 196 independent prognosis-related methylation sites was analyzed with the use of the ConsensusClusterPlus package in R software. The average cluster consensus and inter-cluster variation coefficient for the number of each cluster were calculated to obtain the appropriate cluster number. Based on the CDF curve, when the cluster was 7 or 8, the curve began to stabilize (Figure 2A). As depicted in the CDF delta area curve, 7 clusters that led the area under the CDF curve tended to be relatively stable (Figure 2B). Therefore, 274 LUSC samples were divided into the 7 subgroups (Figure 3A). As displayed in Figure 3B, most methylation sites had low DNA methylation levels in each sample.
Figure 2.
Criteria for selection of the number of subtypes. (A), The consensus among clusters for each category number k. (B) Delta area plot reflecting relative change in area under the cumulative distribution function (CDF).
Figure 3.
The consensus matrix for DNA methylation classification with the corresponding heatmap. (A) The blue color heatmap corresponding to the consensus matrix for 7 molecular subtypes. (B) The heatmap corresponding to the dendrogram in (A). The blue bars and red bars represent the hypomethylate CpG site and hypermethylated CpG site, respectively.
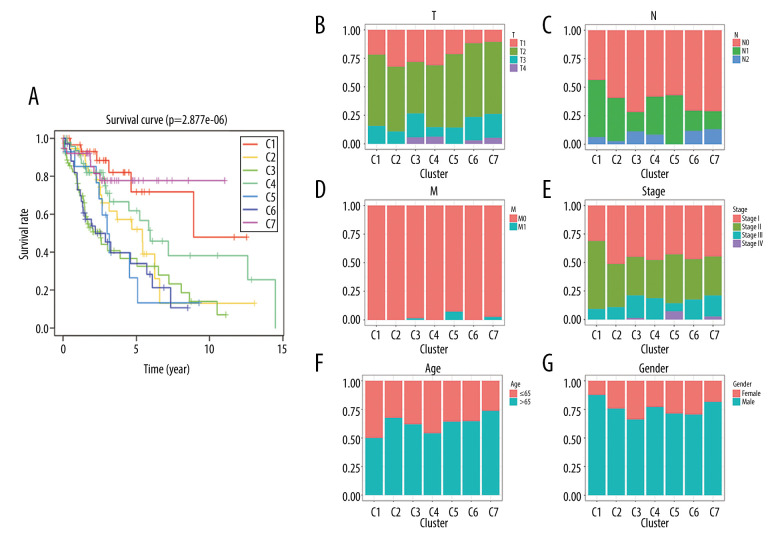
The Kaplan-Meier curve analysis demonstrated that the prognosis of LUSC defined by the methylation-based consensus clustering was significantly different among the 7 clusters. Of the 7 clusters, clusters 1 and 7 had the best prognosis, while clusters 5 and 6 had the worst prognosis (Figure 4A). The distribution of every sample from the 7 subgroups in age, sex, TNM, T, N, and M stage was further examined. As depicted in Figure 4B, cluster 2 had low invasiveness, while cluster 4 had high invasiveness. Figure 4C indicates cluster 6 and cluster 7 had high relevance with lymph node involvement. Figure 4D and 4E show that cluster 5 was associated with distant metastasis and high TNM stage. No difference was found in age or sex among these 7 subgroups of LUSC samples (Figure 4F, 4G). These findings indicate that different DNA methylation subgroups were associated with different prognoses and clinical features.
Figure 4.
Characterization of 7 DNA clusters. (A) The survival curves of each DNA methylation subgroups. The horizontal axis represents the survival time (years) and the vertical axis represents the survival rate. Distribution of T (B), N (C), M (D), TNM stage (E), age (F), and sex (G) in the 7 clusters. The horizontal axis represents the DNA methylation clusters and the vertical axis represents the proportion of samples.
Functional Enrichment Analysis of Methylation Site Annotated Genes
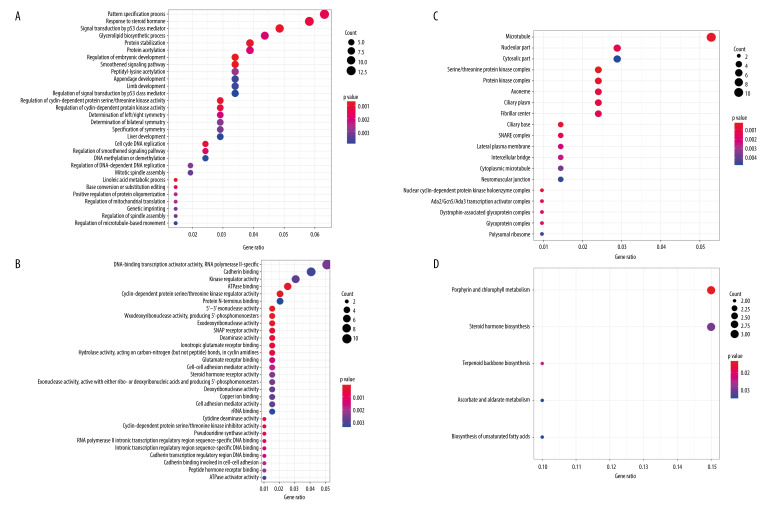
To further understand the mechanism of the 196 independently prognosis-related methylation sites, the 258 genes corresponding to the methylation sites located on the promoter region were used for functional enrichment analysis using the clusterProfiler package in R software. The results demonstrated that these genes were particularly enriched in molecular function (MF), biological processes (BP), cell components (CC), and KEGG classification. In the BP group, the top 3 items were pattern specification process, response to steroid hormone, and signal transduction by p53 class mediator (Figure 5A). Regarding MF, these genes were mainly enriched in DNA-binding transcription activator activity for RNA polymerase II-specific, cadherin binding, and kinase regulator activity (Figure 5B). With respect to CC, these genes were mainly involved in microtubule, nucleolar part, and cytosolic part (Figure 5C). Finally, the KEGG results showed that these methylated genes were enriched in porphyrin and chlorophyll metabolism, steroid hormone biosynthesis, and terpenoid backbone biosynthesis signaling pathways (Figure 5D). These findings further illustrate that these prognosis-related methylation sites were closely related to tumor occurrence and progression.
Figure 5.
Gene ontology (GO) and Kyoto Encyclopedia of Genes and Genomes pathways (KEGG) pathway enrichment analysis of the genes corresponding to 196 significant DNA methylation sites. (A) Biological process (BP) enrichment analysis. (B) Cell components (CC) enrichment analysis. (C) Molecular function (MF) enrichment analysis. (D) KEGG pathway enrichment analysis.
Identifying Subgroup-specific DNA Methylation Markers
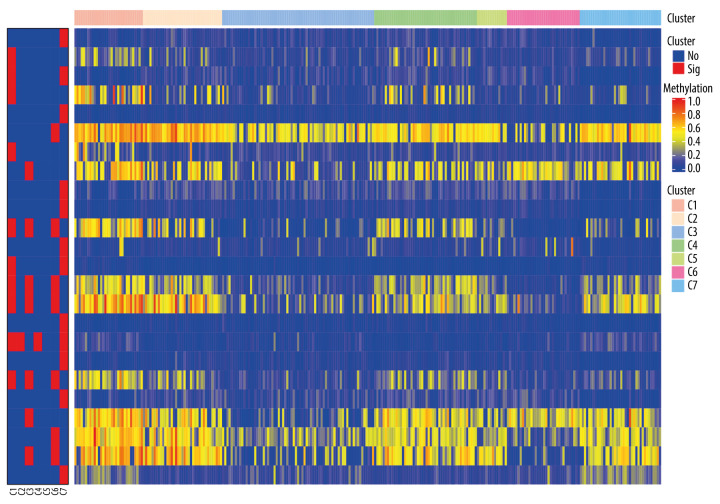
To identify the subgroup-specific DNA methylation sites, the differences of 196 methylation sites in every subgroup of LUSC were further investigated. As a result, 24 subgroup-specific CpG sites were obtained. The heatmap illustrated in Figure 6 shows that cluster 7 had the largest number of specific methylation sites (n=12), most of which were hypomethylated sites. The other clusters also had a small number of specific methylation sites, and most of them were hypomethylated sites. However, there were no specific methylation sites in cluster 5. These results suggest that these specific DNA methylation markers might the reason for different subgroups in LUSC.
Figure 6.
The subgroup-specific methylation sites for each cluster. The blue bar and red bar represent the hypomethylated CpG site and hypermethylated CpG site, respectively.
Establishing and Assessing the Prognostic Prediction Model
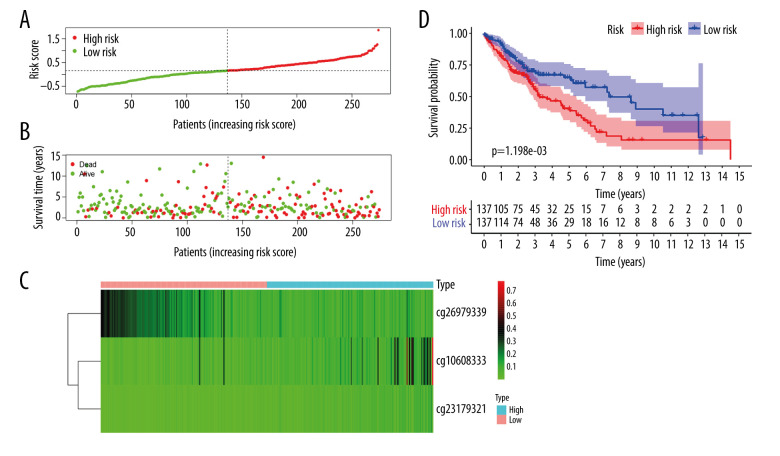
Of the 7 clusters, cluster 7 was linked to the best prognosis. Thus, all the specific methylation sites (n=12) in cluster 7 were selected for multivariate analysis (Supplementary Table 1). In the multivariate analysis, the R function step (direction=“both”) was used to obtain the optimal model based on the Akaike Information Criterion (AIC), which is a measure of the value of a prediction model [26]. The model with the smaller value of AIC was regarded as the better model. Following the multivariate analysis, we obtained 3 specific methylation sites (cg10608333, cg23179321, and cg26979339) for constructing the prediction model. The risk score=2.075815673*cg10608333+8.978013904* cg23179321+ (−2.219228256)* cg26979339 (Supplementary Table 2). According to the formula of the risk score, we calculated the value of the risk score for each sample. Based on the cut-off value of the risk score, we divided 274 LUSC samples into high-risk (n=137) and low-risk groups (n=137) (Figure 7A). As shown in Figure 7D, patients in the high-risk group had a shorter overall survival than patients in the low-risk group (p=1.198e-03). The survival time of each patient is displayed in Figure 7B. A heatmap is shown to present the DNA methylation level profile of the 3 CpG sites (Figure 7C). With an increased risk score of patients with LUSC, the methylation level of cg23179321 and cg10608333 was obviously increased; in contrast, the methylation level of cg26979339 was reduced. Finally, the AUC value for 5-year overall survival was 0.657 (Figure 8). Thus, these findings suggest that this prognostic prediction model shows great promise for application in clinical practice.
Figure 7.
A risk score of 3-methylation sites signature predicted overall survival in patients with LUSC. (A) Distribution of risk score per patient; (B) Survival status of each patients; (C) A heatmap of 3-gene expression profile; (D) Kaplan-Meier survival curve analysis for LUSC patients divided into the high-risk and low-risk groups.
Figure 8.
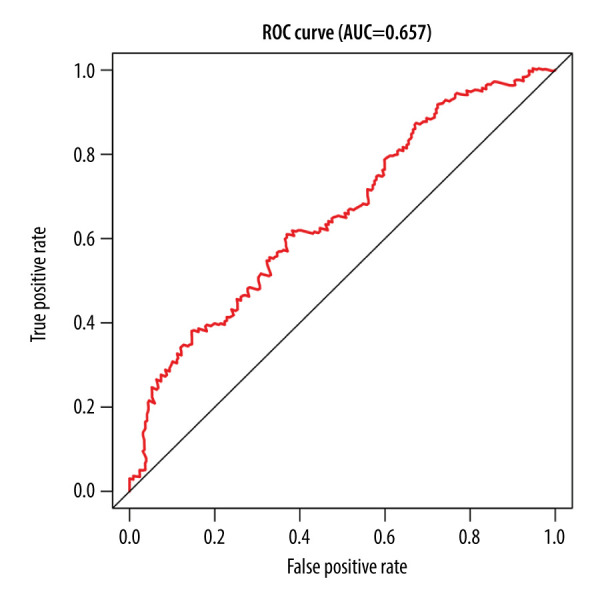
The time-independent receiver operating characteristic (ROC) curve of the risk score for prediction of 5-year overall survival.
Discussion
Apart from genomic DNA sequence alterations and mutations, other mechanisms for regulating gene expression are epigenetic changes. This regulation is heritable and reversible [27]. Epigenetic changes, particular DNA methylation, play key roles in cancer initiation and progression. Therefore, understanding the mechanism of DNA methylation can contribute to early diagnosis, treatment, and prevention of cancer. Whole-genome bisulfite sequencing is considered as the criterion standard to study DNA methylation. Nevertheless, owing to its high cost and analytical burden, this method is not widely used. DNA methylation array is an appropriate alternative for scrutinizing global genome DNA methylation. The TCGA database is an open available resource involving a variety of data on cancers, which allowed us investigate the molecular subtypes of LUSC more comprehensively [28].
Precision medicine or personalized medicine tackles cancers by tailoring treatment based on genomic alterations of each patient [29]. With precision medicine and the advancement of high-throughput sequencing technologies, genomic profiles of patients have been used for risk prediction, diagnosis, and treatment in cancers [29]. In addition, classification based on the origin of tissue or the pathological characteristics of tissue have certain limitations. Therefore, we performed this study to explore detailed classification of the LUSC epigenome on the basis of DNA methylation profile.
In this study, we selected CpG sites that were related to prognosis and located in gene promoter regions for cluster analysis. A total of 196 methylation sites (P<0.01) that were significantly associated with prognosis were used for consistent clustering, and 7 subgroups of LUSC were obtained. We found that these 7 subgroups had different prognosis and TNM stage, indicating that molecular subtypes are independent prognostic factors for LUSC. On the basis of the 7 molecular subtypes, when the significant CpG sites of patients were attributed to cluster 5, the patients were found to have higher risk of developing remote metastasis and advanced TNM stage, and had relatively poor prognosis. However, if the significant CpG sites of patients were attributed to cluster 1, the patients were found had low rick of distant metastasis and advanced stage, and had relatively good prognosis. Thus, this classification system could guide clinicians in treatment of LUSC.
Hypermethylation of CpG islands can inhibit the transcription of tumor suppressor genes and hypomethylation of CpG islands can activate the oncogenes, both of which can result in tumor formation and progression. We found these 196 significant methylation sites corresponded to 258 genes, such as ELOVL5 and CUL5. Boot et al [30] reported that ELOVL5 was downregulated through DNA hypermethylation in colorectal cancer, and it is involved in important cellular processes such as apoptosis, lipogenesis, and the downstream transcriptional effect of the MAPK-pathway. Zhao et al [31] reported that CUL5 deficiency promoted small-cell lung cancer metastasis by stabilizing integrin β1. Then, we used these 258 methylated genes for functional enrichment analysis. The results showed that these genes were enriched in the biological processes that were correlated with lung cancer, including DNA methylation and demethylation, cell cycle DNA replication, regulation of signal transduction by p53 class mediator, and genetic imprinting.
In addition, we identified 24 subgroup-specific methylation sites from the 196 CpG sites, and cluster 7 had the most subgroup-specific methylation sites (n=12). We used the subgroup-specific methylation sites in cluster 7 to construct a prognostic prediction model for LUSC patients using multivariate Cox hazards proportional model analysis. This model can effectively predict the outcomes of LUSC patients. Moreover, the model may provide useful guidance and assistance for clinicians in clinical diagnosis, prognostic assessment, and selection of therapeutic regimens. A previous study reported that 3-CpG methylation signature could be used as a tool for predicting prognosis in patients with LUSC [32]. However, this study just simply selected a series of prognosis-related CpG sites and constructed a predictive model using mathematical models. In contrast, in our study, we made a comprehensive analysis of methylation profile, survival data, and clinical characteristics of different subgroups and obtained their specific methylation features. This is more meaningful for personalized treatment for LUSC patients.
However, there are some limitation in our study. First, there were no available data on whether these methylation sites can be affected by chemotherapeutics or molecular inhibitors. Second, whether intervention at the methylation level after treatment will affect the prognosis of patients requires further investigation. Third, molecular experiments are needed to explore the biological function of these methylation sites.
Conclusions
Our study identified a new classification of LUSC into 7 prognosis subgroups based on DNA methylation data in TCGA, which demonstrated that molecular subtypes are independent factors for prognosis in LUSC. This may provide a more detailed explanation of LUSC heterogeneity. Additionally, this classification will contribute to discovery of new biomarkers of LUSC and provide more accurate subdivision of LUSC.
Furthermore, these specific DNA methylation sites and corresponding genes can serve as biomarkers for early diagnosis, accurate therapy, and prognosis prediction.
Supplementary Information
Supplementary Table 1.
The specific methylation sites in cluster 7.
| CpG site | conMean | treatMean | logFC | pValue | fdr |
|---|---|---|---|---|---|
| cg01087382 | 0.08402786 | 0.031889875 | −1.397769311 | 8.48497E-10 | 6.39636E-09 |
| cg03169527 | 0.086522066 | 0.017040041 | −2.344139284 | 7.37727E-11 | 8.50556E-10 |
| cg04305134 | 0.046636576 | 0.020481763 | −1.187121945 | 3.81751E-10 | 3.56301E-09 |
| cg08793459 | 0.119355449 | 0.027236803 | −2.131635171 | 1.83348E-12 | 5.98936E-11 |
| cg09747578 | 0.060656778 | 0.021209374 | −1.515966795 | 2.39862E-12 | 6.71614E-11 |
| cg10608333 | 0.089685772 | 0.042767721 | −1.068356787 | 2.56684E-08 | 1.22708E-07 |
| cg16721845 | 0.01690917 | 0.040948013 | 1.27598759 | 3.84743E-11 | 5.3864E-10 |
| cg23179321 | 0.036788663 | 0.018164567 | −1.018134276 | 4.13815E-08 | 1.80239E-07 |
| cg23274123 | 0.051585515 | 0.126322925 | 1.292078554 | 1.27875E-13 | 5.0127E-12 |
| cg23570261 | 0.053765073 | 0.021343811 | −1.332851506 | 6.36784E-11 | 8.15306E-10 |
| cg25418748 | 0.104443668 | 0.032923444 | −1.665537867 | 6.65556E-11 | 8.15306E-10 |
| cg26979339 | 0.12488955 | 0.250532 | 1.004342116 | 2.02873E-14 | 1.98816E-12 |
treatMean represents the average methylation level of CpG site X cluster 7; conMean represents the average methylation level of CpG site X in the remaining the clusters (cluster 1, cluster 2, cluster 3, cluster 4, cluster 5, and cluster 6); log2FC=log2 (treatMean/conMean); fdr represents adjusted p value.
Supplementary Table 2.
The 3 specific methylation sites for constructing the prognosis prediction model.
| CpG site | Coefficent | HR | p Value |
|---|---|---|---|
| cg10608333 | 2.075816 | 7.971046 | 0.006634 |
| cg23179321 | 8.978014 | 7926.873 | 0.019246 |
| cg26979339 | −2.219228 | 0.108693 | 0.089475 |
The β represents the regression coefficient of the corresponding CpG site obtained from the multivariate cox proportional risk regression model. HR >1 indicates the methylation level of CpG site is positively associated with prognosis; 0< HR <1 indicates the methylation level of CpG site is negatively associated with prognosis.
Acknowledgements
We thank the TCGA databases for the valuable public data.
Footnotes
Conflict of Interests
None.
Source of support: Departmental sources
References
- 1.Osmani L, Askin F, Gabrielson E, et al. Current WHO guidelines and the critical role of immunohistochemical markers in the subclassification of non-small-cell lung carcinoma (NSCLC): Moving from targeted therapy to immunotherapy. Semin Cancer Biol. 2018;52(Pt 1):103–9. doi: 10.1016/j.semcancer.2017.11.019. [DOI] [PMC free article] [PubMed] [Google Scholar]
- 2.Wang Q, Yang S, Wang K, et al. MET inhibitors for targeted therapy of EGFR TKI-resistant lung cancer. J Hematol Oncol. 2019;12(1):63. doi: 10.1186/s13045-019-0759-9. [DOI] [PMC free article] [PubMed] [Google Scholar]
- 3.Zhang H, Moisini L, Ajabnoor RM, et al. Applying the new guidelines of HER2 testing in breast cancer. Curr Oncol Rep. 2020;22(5):51. doi: 10.1007/s11912-020-0901-4. [DOI] [PubMed] [Google Scholar]
- 4.Lebanony D, Benjamin H, Gilad S, et al. Diagnostic assay based on hsa-miR-205 expression distinguishes squamous from nonsquamous non-small-cell lung carcinoma. J Clin Oncol. 2009;27(12):2030–37. doi: 10.1200/JCO.2008.19.4134. [DOI] [PubMed] [Google Scholar]
- 5.Hou J, Aerts J, Hamer BD, et al. Gene expression-based classification of non-small cell lung carcinomas and survival prediction. PLoS One. 2010;5(4):e10312. doi: 10.1371/journal.pone.0010312. [DOI] [PMC free article] [PubMed] [Google Scholar]
- 6.Bishop JA, Benjamin H, Cholakh H, et al. Accurate classification of non-small cell lung carcinoma using a novel microRNA-based approach. Clin Cancer Res. 2010;16(2):610–19. doi: 10.1158/1078-0432.CCR-09-2638. [DOI] [PubMed] [Google Scholar]
- 7.Bird A. DNA methylation patterns and epigenetic memory. Genes Dev. 2002;16(1):6–21. doi: 10.1101/gad.947102. [DOI] [PubMed] [Google Scholar]
- 8.Li KK, Li F, Li QS, et al. DNA methylation as a target of epigenetic therapeutics in cancer. Anticancer Agents Med Chem. 2013;13(2):242–47. doi: 10.2174/1871520611313020009. [DOI] [PubMed] [Google Scholar]
- 9.Jin Z, Liu Y. DNA methylation in human diseases. Genes Dis. 2018;5(1):1–8. doi: 10.1016/j.gendis.2018.01.002. [DOI] [PMC free article] [PubMed] [Google Scholar]
- 10.Field AE, Robertson NA, Wang T, et al. DNA methylation clocks in aging: Categories, causes, and consequences. Mol Cell. 2018;71(6):882–95. doi: 10.1016/j.molcel.2018.08.008. [DOI] [PMC free article] [PubMed] [Google Scholar]
- 11.Um SW, Kim HK, Kim Y, et al. Bronchial biopsy specimen as a surrogate for DNA methylation analysis in inoperable lung cancer. Clin Epigenetics. 2017;9:131. doi: 10.1186/s13148-017-0432-5. [DOI] [PMC free article] [PubMed] [Google Scholar]
- 12.Pfeifer GP, Rauch TA. DNA methylation patterns in lung carcinomas. Semin Cancer Biol. 2009;19(3):181–87. doi: 10.1016/j.semcancer.2009.02.008. [DOI] [PMC free article] [PubMed] [Google Scholar]
- 13.Wang HL, Li KZ, Li JL, et al. Prognostic value of AKAP13 methylation and expression in lung squamous cell carcinoma. Biomark Med. 2020;14(7):503–12. doi: 10.2217/bmm-2020-0054. [DOI] [PubMed] [Google Scholar]
- 14.Zhang W, Cui Q, Qu W, et al. TRIM58/cg26157385 methylation is associated with eight prognostic genes in lung squamous cell carcinoma. Oncol Rep. 2018;40(1):206–16. doi: 10.3892/or.2018.6426. [DOI] [PMC free article] [PubMed] [Google Scholar]
- 15.Li R, Yin YJ, Jin J, et al. Integrative analysis of DNA methylation-driven genes for the prognosis of lung squamous cell carcinoma using MethylMix. Int J Med Sci. 2020;17(6):773–86. doi: 10.7150/ijms.43272. [DOI] [PMC free article] [PubMed] [Google Scholar]
- 16.Gao C, Zhuang J, Zhou C, et al. Prognostic value of aberrantly expressed methylation gene profiles in lung squamous cell carcinoma: A study based on The Cancer Genome Atlas. J Cell Physiol. 2019;234(5):6519–28. doi: 10.1002/jcp.27389. [DOI] [PubMed] [Google Scholar]
- 17.Zhang M, Sun L, Ru Y, et al. A risk score system based on DNA methylation levels and a nomogram survival model for lung squamous cell carcinoma. Int J Mol Med. 2020;46(1):252–64. doi: 10.3892/ijmm.2020.4590. [DOI] [PMC free article] [PubMed] [Google Scholar]
- 18.Cline MS, Craft B, Swatloski T, et al. Exploring TCGA Pan-Cancer data at the UCSC Cancer Genomics Browser. Sci Rep. 2013;3:2652. doi: 10.1038/srep02652. [DOI] [PMC free article] [PubMed] [Google Scholar]
- 19.Cancer Genome Atlas Research Network. Integrated genomic analyses of ovarian carcinoma. Nature. 2011;474(7353):609–15. doi: 10.1038/nature10166. [DOI] [PMC free article] [PubMed] [Google Scholar]
- 20.Cancer Genome Atlas Research Network. Comprehensive genomic characterization of squamous cell lung cancers. Nature. 2012;489(7417):519–25. doi: 10.1038/nature11404. [DOI] [PMC free article] [PubMed] [Google Scholar]
- 21.Liu Q, Liu C. A novel locally linear KNN method with applications to visual recognition. IEEE Trans Neural Netw Learn Syst. 2017;28(9):2010–21. doi: 10.1109/TNNLS.2016.2572204. [DOI] [PubMed] [Google Scholar]
- 22.Leek JT, Johnson WE, Parker HS, et al. The sva package for removing batch effects and other unwanted variation in high-throughput experiments. Bioinformatics. 2012;28(6):882–83. doi: 10.1093/bioinformatics/bts034. [DOI] [PMC free article] [PubMed] [Google Scholar]
- 23.Zhang Z. Semi-parametric regression model for survival data: Graphical visualization with R. Ann Transl Med. 2016;4(23):461. doi: 10.21037/atm.2016.08.61. [DOI] [PMC free article] [PubMed] [Google Scholar]
- 24.Wilkerson MD, Hayes DN. ConsensusClusterPlus: A class discovery tool with confidence assessments and item tracking. Bioinformatics. 2010;26(12):1572–73. doi: 10.1093/bioinformatics/btq170. [DOI] [PMC free article] [PubMed] [Google Scholar]
- 25.Yu G, Wang LG, Han Y, et al. clusterProfiler: An R package for comparing biological themes among gene clusters. OMICS. 2012;16(5):284–87. doi: 10.1089/omi.2011.0118. [DOI] [PMC free article] [PubMed] [Google Scholar]
- 26.Aho K, Derryberry D, Peterson T. Model selection for ecologists: The worldviews of AIC and BIC. Ecology. 2014;95(3):631–36. doi: 10.1890/13-1452.1. [DOI] [PubMed] [Google Scholar]
- 27.Ebrahimi V, Soleimanian A, Ebrahimi T, et al. Epigenetic modifications in gastric cancer: Focus on DNA methylation. Gene. 2020;742:144577. doi: 10.1016/j.gene.2020.144577. [DOI] [PubMed] [Google Scholar]
- 28.Zhang Z, Li H, Jiang S, et al. A survey and evaluation of Web-based tools/databases for variant analysis of TCGA data. Brief Bioinform. 2019;20(4):1524–41. doi: 10.1093/bib/bby023. [DOI] [PMC free article] [PubMed] [Google Scholar]
- 29.Xu J, Yang P, Xue S, et al. Translating cancer genomics into precision medicine with artificial intelligence: Applications, challenges and future perspectives. Hum Genet. 2019;138(2):109–24. doi: 10.1007/s00439-019-01970-5. [DOI] [PMC free article] [PubMed] [Google Scholar]
- 30.Boot A, Oosting J, van Eendenburg JDH, et al. Methylation associated transcriptional repression of ELOVL5 in novel colorectal cancer cell lines. PLoS One. 2017;12(9):e0184900. doi: 10.1371/journal.pone.0184900. [DOI] [PMC free article] [PubMed] [Google Scholar]
- 31.Zhao G, Gong L, Su D, et al. Cullin5 deficiency promotes small-cell lung cancer metastasis by stabilizing integrin β1. J Clin Invest. 2019;129(3):972–87. doi: 10.1172/JCI122779. [DOI] [PMC free article] [PubMed] [Google Scholar]
- 32.Lee N, Xia X, Meng H, et al. Identification of a novel CpG methylation signature to predict prognosis in lung squamous cell carcinoma. Cancer Biomark. 2020 doi: 10.3233/CBM-201564. [Online ahead of print] [DOI] [PubMed] [Google Scholar]
Associated Data
This section collects any data citations, data availability statements, or supplementary materials included in this article.
Supplementary Materials
Supplementary Table 1.
The specific methylation sites in cluster 7.
| CpG site | conMean | treatMean | logFC | pValue | fdr |
|---|---|---|---|---|---|
| cg01087382 | 0.08402786 | 0.031889875 | −1.397769311 | 8.48497E-10 | 6.39636E-09 |
| cg03169527 | 0.086522066 | 0.017040041 | −2.344139284 | 7.37727E-11 | 8.50556E-10 |
| cg04305134 | 0.046636576 | 0.020481763 | −1.187121945 | 3.81751E-10 | 3.56301E-09 |
| cg08793459 | 0.119355449 | 0.027236803 | −2.131635171 | 1.83348E-12 | 5.98936E-11 |
| cg09747578 | 0.060656778 | 0.021209374 | −1.515966795 | 2.39862E-12 | 6.71614E-11 |
| cg10608333 | 0.089685772 | 0.042767721 | −1.068356787 | 2.56684E-08 | 1.22708E-07 |
| cg16721845 | 0.01690917 | 0.040948013 | 1.27598759 | 3.84743E-11 | 5.3864E-10 |
| cg23179321 | 0.036788663 | 0.018164567 | −1.018134276 | 4.13815E-08 | 1.80239E-07 |
| cg23274123 | 0.051585515 | 0.126322925 | 1.292078554 | 1.27875E-13 | 5.0127E-12 |
| cg23570261 | 0.053765073 | 0.021343811 | −1.332851506 | 6.36784E-11 | 8.15306E-10 |
| cg25418748 | 0.104443668 | 0.032923444 | −1.665537867 | 6.65556E-11 | 8.15306E-10 |
| cg26979339 | 0.12488955 | 0.250532 | 1.004342116 | 2.02873E-14 | 1.98816E-12 |
treatMean represents the average methylation level of CpG site X cluster 7; conMean represents the average methylation level of CpG site X in the remaining the clusters (cluster 1, cluster 2, cluster 3, cluster 4, cluster 5, and cluster 6); log2FC=log2 (treatMean/conMean); fdr represents adjusted p value.
Supplementary Table 2.
The 3 specific methylation sites for constructing the prognosis prediction model.
| CpG site | Coefficent | HR | p Value |
|---|---|---|---|
| cg10608333 | 2.075816 | 7.971046 | 0.006634 |
| cg23179321 | 8.978014 | 7926.873 | 0.019246 |
| cg26979339 | −2.219228 | 0.108693 | 0.089475 |
The β represents the regression coefficient of the corresponding CpG site obtained from the multivariate cox proportional risk regression model. HR >1 indicates the methylation level of CpG site is positively associated with prognosis; 0< HR <1 indicates the methylation level of CpG site is negatively associated with prognosis.


