

Abstract
One way scientists can observe and quantify processes in living cells is to engineer the genomes of animals to express multiple fluorescent proteins and then quantify those signals by various imaging techniques. To allow our laboratories to confidently quantify mixed (overlapping) fluorescent signals for our studies in the basic biology of gene expression and aging in C. elegans, we developed a comprehensive toolkit for C. elegans that we describe here. The Toolkit consists of two components: 1) a series of vectors for DNA assembly by homologous recombination (HR) in the yeast, Saccharomyces cerevisiae, and 2) a set of ten worm strains that each express a single, spectrally distinct fluorescent protein, under control of either the daf21 or eft-3 promoters. We measured the in vivo emission spectrum (3nm resolution) for each fluorescent protein in live C. elegans and showed that we can use those pure spectra to unmix overlapping fluorescent signals in spectral images of intestine cells. Seven of ten fluorescent proteins had signals that appeared to be localized in vesicular/elliptical foci or tubules in the hypodermis. We conducted fluorescence recovery after photobleaching (FRAP) experiments and showed that these structures have recovery kinetics more consistent with freely diffusing protein than aggregates (Q35::YFP). This toolkit will allow researchers to quickly and efficiently generate mutlti-fragment DNA assemblies for genome editing in C. elegans. Additionally, the transgenic C. elegans and the measured emission spectra should serve as a resource for scientists seeking to perform, or test their ability to perform, multidimensional (multi-color) imaging experiments.
INTRODUCTION
Biologists learn many truths about the living world via direct, reproducible observations. The ability to observe different molecular components of individual cells in live animals is an aspect of this direct observation approach that has been quite fruitful, in terms of generating scientific understanding about the biological world. Since the advent of the beta-galactosidase reporter genes in the late 1960s, scientists have relied on reporter genes to tell us about the physiologies of living cells [1, 2]. With the implementation of green fluorescent protein (GFP) in the 1990s [3], scientists were able to peer deeper into the inner workings of live cells in living animals.
Fluorescent proteins have been developed extensively over the past 20 years [4–8]. Yet, perhaps because GFP was the first fluorescent protein, or perhaps because most optical equipment (worm sorters, stereo microscopes, compound microscopes) is geared towards detection of GFP, it seems that most reporter genes in use in Caenorhabditis elegans, including those available at the C. elegans Genetics Center (CGC), utilize some form of GFP. The array of reporter genes generated to date has provided fantastic insight into the inner workings of cells and organs. However, the need to observe more processes simultaneously is apparent, especially for systems-type investigations in aging cell physiology [9]. In 2017, we are able to edit genomes to place reporter genes in precise locations using both transposon-based, and CRISPR/Cas9-based approaches [10]. Additionally, as we are able to observe more than three signals with spectral confocal microscopes capable of linear unmixing [11] or microscopes capable of fast sequential scanning, the need to develop additional fluorescent proteins for use in C. elegans has arisen. With the right tools and reagents, researchers should be able to use these advanced imaging technologies to further our understanding of organismic aging.
In order to generate the new reporter constructs for this work, and for our studies on aging and gene expression, we developed an in vivo cloning system that allows us to quickly and efficiently generate large, multi-fragment DNA assemblies compatible with both MosSCI and CRISPR genome editing [10]. Our system takes advantage of the efficient homologous recombination (HR) system of the yeast Saccharomyces cerevisiae [12]. Yeast HR systems have been used to generate very large plasmid constructs and even synthetic chromosomes [13–15]. We chose a system based on yeast HR because it is seamless, efficient, low cost, easily scalable and, most importantly, it provides an additional level of flexibility that other assembly methods do not [16–18]. That is, it allows for seamless, hierarchical assembly of new constructions from existing, sequence-confirmed plasmids by the same process. Therefore, a researcher using a yeast HR system can generate a construct consisting of an expression cassette (promoter, transgene and terminator), and in subsequent engineering steps, directly replace any or all of those elements in a seamless fashion by the same means without the need for extensive vector backbone sequencing of the resulting construct. We have reviewed DNA assembly methods in detail in [16].
In order to utilize additional fluorescent proteins in C. elegans we needed to determine three things. First, we needed to know if these proteins express in C. elegans. Second, we needed to measure the in vivo emission spectra in order to know the bandwidth and emission peaks for channel based imaging, and in order to enable unmixing of overlapping fluorescent signals from spectral images (linear unmixing). Third, we wanted to know if these new fluorescent proteins acted similar to mCherry and GFP in cells and tissues [19]. Specifically, we wanted to know if they appear to freely diffuse and accumulate in intestinal nuclei, which we use as a proxy for whole cell gene expression [9, 19]. Also, we and others (e.g.,[20]) have observed mCherry accumulating in vesicle-like structures, which are often colloquially referred to as aggregates, despite no biophysical evidence of aggregate-like nature. We wanted to know if this property was specific to mCherry or the ubiquitous behavior of all freely diffusing fluorescent proteins in C. elegans.
Here, we report a series of yeast HR vectors that are compatible with MosSCI and CRISPR/CAS9 genome editing in C. elegans. We used these vectors in 2, 3 and 4-fragment DNA assemblies in order to generate constructs that express ten spectrally distinct fluorescent proteins: mTagBFP2, mCerulean3, mTFP, mEGFP, mECitrine, mKO2, mTagRFP-T, mCherry, mScarlet and mNeptune. In eleven independent DNA assemblies we found 95% (40 of 42) of the resulting constructs to be assembled correctly. We used the Universal MosSCI system to make single copy reporter lines for each fluorescent protein [21]. We verified that these freely diffusing monomeric proteins behave similarly in vivo, in terms of increased concentration in the nuclei of intestine cells [19]. We also used a point emission scanning confocal microscope (Zeiss LSM780) to measure the emission spectrum of each fluorescent protein at 3nm resolution from the relatively pure signal emanating from the nuclei of intestine cells of live young adult animals [19]. Seven of ten fluorescent proteins concentrated in foci in the hypodermis, similar to what has been observed with mCherry. To investigate the nature of these structures, we performed FRAP experiments which suggest that these are not aggregated fluorescent proteins, but rather, freely diffusing fluorescent proteins inside tubular or vesicular structures. We hope that this report and toolkit will serve as a technical resource for scientists wishing to perform genome editing and multidimensional (multi-color) imaging in C. elegans.
Materials & Methods
DNA assembly reactions
We provide a detailed protocol for DNA assembly in Supplemental Protocol 1. Briefly, For each recombination reaction, we added transformation mix, plus 60–100ng linearized vector, and 20:1 molar ratio of insert DNAs, to a pellet of previously frozen yeast. After a 40-minute heat shock at 42°C, we grew yeast in YPD without selection for 2–3 hours then plated them onto YPD agar plates containing 200μg/ml G418. We grew plates for 48 hours at 30°. For all yeast DNA assembly reactions, we used 30–35bp homology arms between fragments. For the vector construction and for all subsequent DNA assemblies, we used yeast strain BY4741 [22] prepared as described [23]. After assembly by HR in yeast, the resulting plasmids were rescued into E. coli and sequenced. We purchased all PCR and restriction enzymes from New England Biolabs (Ipswich). We provide vector and primer sequences in Supplemental Data file 2.
Plasmid rescue
For plasmid rescue we modified the Qiagen miniprep protocol to include a glass bead disruption step. Outside of the glass bead disruption the protocol is the same as a standard Qiagen miniprep except we used 320μl buffer P1 and P2 and 450μl of buffer N3. We transformed rescued plasmid into competent E. coli.
Colony PCR screen of yeast assemblies
As listed in Table 1, we screened some assemblies by yeast or E. coli colony PCR. To do so, we picked single colonies into 2.5μl of dH2O and added a Platinum Blue PCR master mix (Invitrogen) containing primers sets that prime outside the DNA assembly junctions (Supplemental Figure 2).
Table 1.
Accuracy of multi-fragment DNA Assembly.
| Construct | Inserts | Fragment Sizes (Total Insert Size) | Vector | colony PCR | Digest | Sequencing |
|---|---|---|---|---|---|---|
| N/A | Hsp16.2-mCherry-Hsp16.2T | 8434, 1900 (1900) | BSP179 | 11/12 | 8/8 | |
| BSP149 | Daf21P, mEGFP, Unc54 T | 8434, 2055, 925, 805 (3784) | BSP179 | 8/8 | 3/3 | |
| BSP147 | Daf21P-mCherry, Unc54 T | 8434, 2055, 901, 805 (3761) | BSP179 | 8/8 | 3/3 | |
| BSP602 | EFT3 P, mScarlet | 9185, 665, 904 (1569) | BSP188 | 6/6 | 2/2 | |
| BSP605 | EFT3 P, mCerulean | 9185, 665, 823 (1488) | BSP188 | 3/3 | 2/2 | |
| BSP606 | EFT3 P, mECitrine | 9185, 665, 823 (1488) | BSP188 | 6/6 | 5/6 | |
| BSP607 | mKO2 | 9794, 713 (713) | BSP605 | 3/3 | 3/3 | |
| BSP608 | mNeptune | 9794, 805 (805) | BSP605 | 3/3 | 3/3 | |
| BSP609 | mTFP | 9794, 767 (764) | BSP605 | 5/6 | ||
| BSP610 | mtagBFP2 | 9794, 784 (784) | BSP605 | 3/3 | ||
| BSP611 | mtagRFP-T | 9794, 805 (805) | BSP605 | 3/3 |
Worm Strains and Culture Conditions
We acquired AM140, RT258, EG8082, EG6699/(RBW6699) from the CGC. Animals were cultured as previously described [24]. Briefly, strains were maintained on NGM seeded with OP50 E. coli at 20° for experiments measuring emission spectra or foci behavior, or 25° after microinjection.
Worm Transformation via Microinjection
We used standard microinjection protocols [25] to inject template DNA to repair a double stranded break caused by the excision of a Mos transposon at particular loci in the genome, as described [21, 26, 27]. We used 50ng/0μl of repair template and 50ng/μl of transposase. In our hands, this results in at least one correct integration per ten worms injected, and usually three to five insertions per ten animals injected.
Microscopy & Collection of Emission Spectra
We mounted animals in an 80-lane microfluidic device designed and constructed by Dr. Matt Crane at the microfluidics core of the University of Washington Nathan Shock Center of Excellence in the Basic Biology of Aging (See supplemental Figure 6). We used a syringe to push individual adult animals into individual channels for imaging. Animals were immersed in a relatively gentle tricaine/tetramisole anesthetic that we and others have described previously [19]. Thus, the animals were oriented in the same fashion, physically restricted and anesthetized, providing optimal conditions for imaging the emission spectra emanating from each worm. We used a Zeiss LSM780 inverted spectral point scanning confocal microscope to collect emission spectra. We placed the microscope in Lambda mode for measuring wavelength. We selected a laser lines with shorter wavelengths than peak excitation whenever possible, in order to collect the broadest emission spectrum from each fluorescent protein. We used a 20X 0.8 NA objective to collect emission spectra; we used a 40X 1.2 NA water objective to collect yeast emission spectra. We used a 5μm optical slice. We set the bin size to 3nm and averaging of each pixel/point in the image to 8X. We adjusted laser power and gain to ensure strong signal, but no saturation. We measured at least three individual worms for each reported emission spectra.
To collect the emission spectrum from the data, we used the Zeiss Black software to highlight a circular, 20-micrometer diameter area over the nucleus of individual animals and extracted the resulting emission intensity × wavelength bin data into Excel. Waveforms were the same when collected elsewhere from the animal or by highlighting the whole animal. We normalized each spectrum to its maximum intensity bin, and then plotted that data using SigmaStat (Systat Software, Inc., San Jose).
FRAP Experiments
We used Zeiss Zen software to identify regions of interest for image acquisition and for bleaching over a tubule or vesicle or Q35 aggregate. For mCherry, we set the 561nm diode laser power to 100% and photobleached the region of interest for 10 iterations after initial image acquisition. For Q35::YFP, we set the 488nm diode laser power to 100% and photobleached the region of interest for 20 iterations after initial image acquisition. After bleaching we acquired a time series of images to observe loss of signal and subsequent recovery.
RESULTS
Construction of yeast HR expression vectors compatible with universal MosSCI
In our lab, we rely heavily on our ability to quickly generate transgenic worm strains that express single copy transgenes at defined genomic loci. We have tested an array of multi-fragment DNA assembly methods including Gateway, Gibson and other homology-driven methods and, more recently, in vivo homologous recombination (HR) assembly using the yeast Saccharomyces cerevisiae (reviewed in [16]). For our work, the yeast HR system has proved to be reliable, efficient, and flexible. The main advantage of this system is the ability to quickly generate complex, seamless DNA assemblies, such as an expression cassette consisting of a promoter, transgene and terminator, whether for MosSCI single copy insertions or for CRISPR/Cas9 editing, and then to re-engineer those plasmids at will. Re-engineering constructs cannot be easily accomplished by any other method without the addition of scar sequences between DNA elements or extensive full vector backbone PCR (see Table3.26.1 in [16] for a full comparison of DNA assembly methods). The yeast HR system is also very cost effective because there are no proprietary enzyme mixes to purchase.
For much of our work, we utilize the Universal MosSCI, transposon-based, system [21, 26, 27]. The Universal MosSCI system allows scientists to place a transgene cassette encoded by a single plasmid at any of six different locations in the genome of C. elegans [21]. To generate a yeast HR vector compatible with Universal MosSCI (BSP179, Figure 1A), we set up a 3-fragment DNA assembly with the following: fragment 1 was the backbone from a standard yeast/E. coli shuttle vector PCR amplified from pRSII326 [28–30], fragment 2 was a dual kanamycin/G418 selectable marker (kind gift from Fabian Rudolf, ETHZ), and fragment 3 was a PCR product amplified from pCFJ350 [27], consisting of both ttTi5605 homology arms separated by the C. briggsae unc119(+) marker and MCS [21, 27]. Because many of our constructs utilize the unc-54 terminator, we added it to an additional vector BSP188 (Figure 1B). Plasmids are available from Addgene.
Figure 1. Vector Maps.
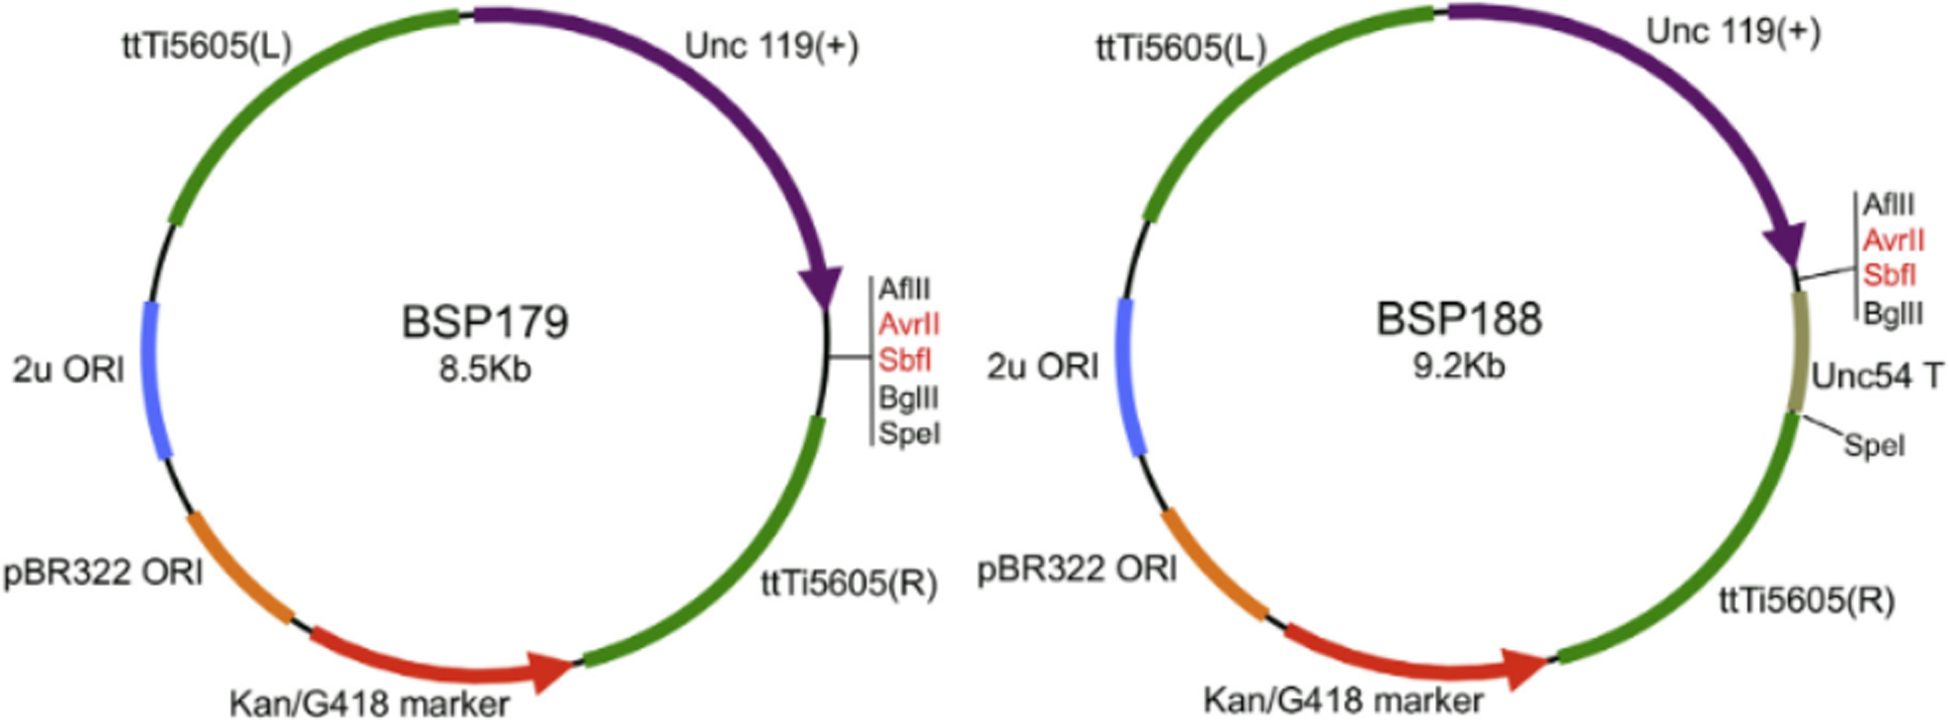
Maps of vectors for making Universal MosSCI constructs. The backbones of BSP179 and BSP188 each have a replication origin for both yeast and E. coli maintenance. The dual drug resistance marker allows for yeast plasmid selection on YPD plus 200ug/ml G418 plates and E. coli plasmid selection on LB plus 50ug/ml Kanamycin plates. The C. briggsae Unc-119 gene allows for phenotypic conversion of the unc phenotype in C. elegans. ttTi5605 homology arms flank the unc-119 marker and MCS. BSP188 has the unc-54 terminator cloned downstream of the MCS but is otherwise identical to BSP179. For DNA assembly in yeast, we linearize each vector by digestion with AvrII and SbfI (shown in red, recommended), or any unique site within the vector.
Yeast HR DNA assembly system for generating MosSCI expression constructs is efficient and highly flexible
First, we tested assembly of a single 1900bp insert into BSP179. We chose an insert from an already constructed MosSCI vector in order to have a positive control for assessing DNA assembly efficiency. We amplified the Phsp16.2::mCherry::Tunc-54 insert from pAM104 by PCR with 35bp homology arms to BSP179. Insert PCR plus 100ng of linear BSP179 was transformed into previously frozen, single use aliquots of S. cerevisiae strain BY4741 at a 20:1 molar ratio of insert to vector via standard lithium acetate heat shock (see Supplemental Protocol for details). We used linearized vector without insert as a background control. We plated transformed yeast on YPD with 200ug/ml G418 and grew them at 30° for approximately 48 hours. To detect successful assemblies, we screened yeast clones by colony PCR (Supplemental Figure 2). Eleven of twelve colonies were positive for a correct assembly. We sequenced eight of the PCR positive plasmids and found all eight to be correctly assembled without any inserted or deleted nucleotides at the assembly junctions.
We then set out to generate all of the reporter constructs for this study by 4-fragment DNA assembly (vector plus 3 inserts) into BSP179, by 3-fragment assembly (vector plus 2 inserts) into BSP188 or by 2fragment assembly (fluorescent protein swap) into BSP605. We list the results of all assemblies in Table 1. We generated our insert fragments by PCR such that each insert contained 35bp homology arms at each end. To assess assembly accuracy, we screened constructed plasmid DNA by restriction digest and DNA sequencing. 95% of plasmids (40/42 sequenced clones) were correctly assembled. A single clone of BSP606 had a 15-nucleotide insertion at the 5’ assembly junction and a single clone of BSP609 had a large deletion in the middle of the mTFP ORF. The BSP606 insertion was due to sequence homology at the 5’ end of the mECitrine ORF. The BSP609 deletion appears to be a plasmid that had a secondary recombination event; the insert recombined correctly and was then partly looped out. The mechanism of plasmid replication in yeast is complex and might contribute to these low incidence events [31, 32]. Overall, this system proved to be highly efficient and accurate at generating MosSCI-compatible vectors from multiple insert DNAs.
A Collection of C. elegans expressing functional, spectrally distinct, fluorescent proteins.
We integrated each of the yeast-HR generated plasmids designed to express codon optimized fluorescent proteins into the C. elegans genome as a single copy, at specific sites using the Universal MosSCI genome editing system [21]. The list of resulting strains is shown in Supplemental Table 1. Each of the fluorescent proteins we tested was expressed as a freely diffusing fluorescent protein and showed no adverse effects on the rate of development or gross morphology. Specifically, each strain reached gravid adulthood at approximately the same rate as wild type at 20°, and the animals appear to have wild-type anatomy, in terms of approximate size and shape of gonads muscles and intestines upon microscopic examination with 20X, 0.8 NA air and 40X, 1.2 NA water objectives utilizing Nomarski DIC optics. The spectral images in Figure 3 show the natural color of each fluorescent protein, which is sometimes incongruent with the name of the protein.
Figure 3. True colors of fluorescent proteins in worms and their emission spectra.

A) Emission-based, filter-free images of worms expressing fluorescent proteins from either the Daf-21(mEGFP and mCherry) or Eft-3 (mTagBFP2, mCerulean3, mTFP, mCitrine, MKO2, mTagRFP-T, mScarlet, mNeptune) promoters.. Each fluorescent protein and the peak emission measured for that fluorescent protein is listed on the left. The corresponding worm is shown on the right. The red arrow indicates concentrated protein in nuclei of intestine cells in mTFP worms. All of the fluorescent proteins we looked at show this property. B) The histogram pictured here shows the emission intensity as a function of wavelength for each fluorescent protein we measured in vivo in C. elegans.
Emission spectra of fluorescent proteins in C. elegans.
The spectral behaviors of individual fluorescent proteins have often been characterized in E. coli and/or mammalian cells and are presumed to be the same in all living systems. However, fluorescent proteins sometimes do exhibit different behaviors in different biological systems; for example, the relative brightness of two different variants of GFP is reversed in C. elegans relative to the biological systems in which the properties of these fluorescent proteins were first reported [33]. Here we measured the emission spectra (3nm resolution) of ten different fluorescent proteins from the intestinal nuclei of living C. elegans using a spectral confocal microscope. We found that nine out of ten emission spectra were close to or the same as reported from other systems, shown in Figure 3B and Supplemental Dataset 1. However, for mNeptune, we found that the emission spectrum was blue-shifted 16nm, peaking at 634nm and not 650nm as reported [34]. We found that the same sequence expressed in yeast also peaked at 634nm (Supplemental Figure 1). We do not know whether this inconsistency is due to the intrinsic differences between worms and yeast and mammalian tissues in which mNeptune was first expressed, but we believe that the emission spectra reported in this study should be used for multidimensional microscopy in C. elegans.
We used the spectral waveforms from mEGFP and mTagBFP2 to unmix multicolor spectral images of the worm intestine where mTagBFP2 was freely diffusing and Lysosome Associated Membrane Protein 1 (LMP-1) was tagged with GFP (Figure 4). The mixed image in Figure 4A appears to show GFP expression only at the plasma membrane. However, once the pure mTagBFP2 (Figure 4B) and mEGFP (Figure 4C) signals are unmixed and merged (Figure 4E), GFP expression on membranes and membrane-bound vesicles becomes apparent, including at the plasma membrane (red arrows). Therefore, these pure emission spectra can be used to separate true fluorescent protein signals and reveal the subcellular localization of natural proteins tagged with fluorescent proteins, as previously shown for an image of fluorescent protein with chemical dye (GFP and FITC) [11]. Worm strains are available from the Caenorhabditis Genetics Center (CGC).
Fig 4. Linear unmixing of LAMP-1::GFP signal from stronger, freely diffusing mTagBFP2 signal in intestine cells of C. elegans reveals plasma membrane and vesicles.

A) The composite spectral image where GFP appears as its natural aqua marine color (see also Fig 3) and is only visible in the plasma membrane (red arrow in subsequent panels). Freely diffusing mTagBFP2 appears blue. B) The unmixed mTagBFP signal. C) The unmixed GFP signal; note the image shows GFP signal on membranes and membrane-bound vesicles, as we would expect for lysosome associated membrane protein 1 (LAMP-1::GFP). These structures are hidden in the mixed spectral image in panel A. D) The Nomarski DIC transmitted light image. E) Merged image after linear unmixing of the spectral image, revealing LAMP-1::GFP surrounding many different vesicles in the intestine, some of which also contain mTagBFP2. We acquired the image with a 1.2 NA 40X water objective, 405nm and 488nm excitation lasers and an 8.9nm emission spectrum bandwidth from spanning from 411–690 nm. We used the Zeiss Zen software to unmix the mTagBFP2 and GFP signals using emission spectrums we previously measured from animals expressing only mTagBFP2 or mEGFP, shown in Figure 3.
Properties of Fluorescent Proteins in Live C. elegans
Like mEGFP and mCherry, other freely diffusing proteins show concentrated signal in the intestine cell nuclei.
For our investigations into the mechanisms of cell-to-cell variation in intestinal gene expression [9, 19], we use the nucleus as a proxy for the whole cell because it contains a relatively large volume of concentrated and relatively pure signal compared to the rest of the intestine cell. Nuclear fluorescent protein is over 99% correlated with cytoplasmic fluorescent protein levels, but is relatively free of intrinsically fluorescent molecules, and thus provides a more accurate measurement of the concentration of fluorescent proteins in cells [19]. The torso images of live worms in Figure 3A show fluorescence signal throughout the worm body, and importantly, increased signal in intestinal nuclei (e.g., red arrow in mTFP worm). Thus, we expect all of these fluorescent proteins to be useful in quantifying signal from intestinal nuclei in live animals.
Freely diffusing fluorescent proteins in the hypodermis are visibly concentrated in tubular filaments and vesicles.
Our own observations and previous reports (e.g., [20]) have shown that, while freely diffusing mEGFP signal is relatively absent from foci in the hypodermis, mCherry signal concentrates in moving elliptical structures and foci. Anecdotally, these are assumed to be mCherry aggregates, though we are unaware of any experimental evidence showing this. Of the ten fluorescent proteins measured here, we found that mTagBFP2, mCerulean3, mTFP, mKO2, mTagRFP-T, and mScarlet show similar concentration in the hypodermis. In order to determine if these structures are the same as those seen with mCherry, we imaged live worms expressing freely diffusing mCherry and mTagBFP2 and showed that both fluorescent proteins accumulate and colocalize in filaments and foci (Supplemental Figure 3). It is unclear to us why we do not see this behavior with mEGFP, mECitrine or mNeptune. It is possible that these proteins are in fact accumulating, but we simply cannot detect signal based on the different biophysical properties of these proteins, such as pKa, and the environment within these structures.
To investigate the nature of these structures we performed FRAP experiments, wherein we photobleached a small region of the tubule or foci to determine its nature in terms of diffusion. We compared mCherry-expressing worms with AM140 worms which express a Q35 aggregate form of YFP [35]. We found that mCherry does not behave like an aggregate when subject to biophysical examination (Supplemental Figure 4). Instead, we found the FRAP kinetics and behavior to be more consistent with that of freely diffusing fluorescent proteins inside tubular or vesicular structures separated from the rest of the cytoplasm. While these results are preliminary, they suggest that mCherry, and probably the other fluorescent proteins that concentrate in the hypodermis, are not aggregates, or at least not aggregates like Q35. The observed loading of fluorescent proteins into these compartments may be some natural aspect of proteostasis, or some other yet unknown process.
DISCUSSION
Cost-effective, Efficient DNA Assembly.
We believe that the DNA assembly system described here is another important tool that the C. elegans community can use to more efficiently generate transgenic worms. In our lab, we have used this system to generate hundreds of DNA assemblies, including additional transcriptional reporters similar to those described above, and more complex assemblies including gene fusions, reporters targeted to subcellular structures and CAS9/CRISPR targets and repair templates. While we do not show cloning of CRISPR target RNAs in this work, we have described it in Supplemental Figure 5.
In our hands, this system has dramatically increased the efficiency at which we can generate transgenic C. elegans. However, all yeast HR-based cloning systems have limitations. Because yeast have such an efficient homologous recombination system, it is not possible to clone DNA fragments with extensive stretches of homology to vector backbone DNA or within insert fragments. For example, many reporter genes are derived from GFP (Citrine, Cerulean, etc.) and have long stretches of sequence homology throughout. If the goal is to clone a Citrine reporter into a plasmid that already contains the gene for GFP, one would want to digest out as much of the GFP sequence as possible before assembly. There are ways around this limitation. One can replace a GFP-derived reporter with one extracted from another organism (mCherry for example) without risk of misassembles. One can also replace a GFP-derived reporter with another if the DNA sequences are dissimilar (for example, using gBlocks or synthetic DNAs as PCR templates).
Many C. elegans reporter genes have been generated with multiple synthetic intron sequences spaced throughout the reading frame. The synthetic intron sequences are highly similar, and may also cause misassembly in the above example. In our lab, we simply digest vector plasmids with restriction enzyme sites that flank intron-containing sequence before assembly. In this work, we generated a Peft-3::mCerulean3::Tunc-54 construct (BSP605) where the mCerulean3 ORF contained a single synthetic intron. In order to do a fluorescent protein swap into this plasmid, we digest BSP605 with AleI and NaeI, sites that flank the intron and cut close to the 5’ and 3’ end of mCerulean3. This allowed us to swap in any new fluorescent protein insert, whether it was derived from GFP (like Cerulean is) or it contains one or more introns.
Current homology-based DNA assembly methods such as Gibson or In-Fusion are also very efficient and faster to complete one-off constructions than yeast HR because of the slow growth rate of yeast compared to E. coli and the need to rescue yeast plasmid DNA. However, we are constantly trying to replace single DNA elements out of already constructed plasmids in a seamless manner, and that is where the time savings comes in (see Table3.26.1 in [36] and Detailed Protocol). For example, to accomplish this same task with Gibson cloning requires the PCR amplification of the full vector backbone, and thus, extensive DNA sequencing of the resulting construction (due to the probability of PCR errors). Since worm expression vectors can be close to 10Kb, and in our work they can be closer to 12–15Kb, we find the yeast HR system to be more efficient and more cost effective for this purpose. On top of the simplicity and non-reliance on commercial enzymes, this is the main advantage of a yeast HR system over other methods.
Practical considerations for spectral imaging:
Instrumentation.
The first consideration is the instrument from which you will be acquiring emission spectra from biological samples. Nikon, Zeiss and Leica are among major microscope manufacturers that offer spectral microscopy systems. Nikon [37] and Zeiss [38] use diffraction gratings to project emitted light onto an array of linked photomultiplier tubes. Resolution is tunable, with a tradeoff between scan time and resolution. Leica [39] uses a prism to split the emission spectrum onto a smaller array of individually controllable detectors. Additionally, some innovative scientists have designed their own spectral imaging systems, which may have their own technical caveats. Each instrument will have different excitation setups, and different lenses, which will also need to be considered. Are the objectives being used good for transmitting photons of many different wavelengths? How many different excitation lasers can be used? How much bandwidth is blocked by each excitation channel? How many different fluorescent dyes or proteins can be excited by the same laser? Table 2 shows four excitation lasers capable of simultaneously firing on our system, and the fluorescent proteins that each laser can reasonably excite.
Table 2.
Potential Imaging Scenarios
| Excitation Lasers | ||||
|---|---|---|---|---|
| 405 | 458 | 514 | 561 | |
| Fluorescent Proteins | mtagBFP2 | mCerulean | mECitrine | mKO2 |
| mCerulean | mTFP | mKO2 | mTagRFP-T | |
| mEGFP | mTagRFP-T | mScarlet | ||
| mECitrine | mScarlet | mCherry | ||
| mNeptune | ||||
Spectral Resolution.
Resolution may be tunable, and it may come at a tradeoff with speed and signal strength [37]. Collecting in bigger bins means more photons per bin and thus, more signal, but less spectral resolution. On our Zeiss diffraction grating/PMT array based spectral imaging system, we find that the native, and fastest, 8.9 nm resolution is sufficient for resolving most spectra, including the signals in Figure 4. Consider the emission spectrums and peaks for the fluorescent proteins or dyes you will use. Generally, it is a good idea to set a resolution greater than what you would need to resolve spectral differences. So, if you have a 6nm difference in emission peak, 3nm is a good resolution, and 10nm may not be sufficient; yet, 10nm might be sufficient if the emission spectrum widths are distinct. The unmixing algorithms will use the entire waveform to unmix the signals, thus other features of the waveform besides the peak can be features used to distinguish distinct emission spectra. Ultimately, you will want to test the ability of your system with standards (see Standards section below).
Signal Strength (Dynamic Range of Signals).
Each signal must be detectable. So, they must all be within the dynamic range of whatever detectors you are using. Thus, brightness of fluorescent proteins or chemicals, expression levels and excitation efficiencies must all be considered. As in, if you have something that is expressed highly and something that is expressed at a relatively low level, you may want to use a dimmer fluorescent protein for the more highly expressed gene. For example, if imaging LMP-1::GFP signal in conjunction with a strong signal driven by expression from, perhaps, the eft-3 promoter, one may find that TagRFP-T is preferable to the incredibly bright and spectrally similar, mScarlet. Thus consider brighter and dimmer versions of the same fluorescent protein when considering what fluorescent proteins to use as reporters for particular combinations of genes; many fluorescent proteins have been engineered for increased brightness and have dimmer versions available. You may consider the excitation scenarios possible on your system; using different excitation efficiencies can be an effective way to change the signal strength of different fluorescent proteins in your sample. Another strategy can be to make mutlimers of fluorescent proteins; for example, we were able to increase signal in yeast by making “Triple-mTFP” (Bryan Sands and Roger Brent, unpublished). Ultimately, you may simply have to experiment with different combinations of fluorescent reporter protein configuration. Table 2 shows several potential possibilities for imaging three to perhaps up to ten colors at once, using the lasers we used to acquire these emission spectra. The excitation scenario will depend on the particulars of the instrument. More signals will require more optimization of excitation and reporter gene configurations to ensure that all the signals are both detectable, and, not saturating the detectors.
Standards.
For each signal you want to unmix, it is advisable to have that signal alone in a biological control sample. We have provided C. elegans strains that express each fluorescent protein so that you may acquire the waveform of a particular fluorescent protein on your particular imaging system (Figure 3); strains are available from the Caenorhabditis Genetics Center. We have deposited plasmids at Addgene so that you may generate color standards for your particular reporter gene. Unmixing reporter genes that have some overlapping and some distinct features is often a good way to test the effectiveness of the imaging and unmixing scenario, as shown in Figure 4. The BFP signal overtakes the GFP signal, but, because the GFP is still detected alone under those imaging conditions (revealed by the single color LMP-1::GFP strain), we were able to unmix the signal, and found it to be in distinct regions. That is, there were areas with no BFP and areas with no GFP and those areas appeared to be as they biologically should, based on our single color standards and knowing that one reporter is a membrane protein and one reporter is freely diffusible in the cytoplasm. Furthermore, even biological samples with only a single color of fluorescent protein can be further verified by unmixing the fluorescent protein signal from the image. Many images of GFP acquired from 500–550nm emission filters contain significant amounts of signal that are not GFP [19]; hence, unmixing fluorescent signals from biological signals also separates them from other intrinsically fluorescent biomolecules that may be obscuring the true signal.
Tools for Understanding Cell Physiology
For our exploration into aging cell physiology, we need to understand what components of cells do tend to fail first, and we need to know what can happen when we engineer failures of specific components [40]. Thus, we needed to be able to monitor multiple cellular subsystems simultaneously. Here we have generated a resource for our lab and other labs seeking to observe multiple components of biological systems simultaneously. The promise of such observations is great. Spectral imaging and subsequent linear unmixing of fluorescent protein signals with overlapping emission spectra has been functional for over a decade [11], but almost never applied to live cell imaging, especially not in the context of aging [9]. We hope that other labs will begin to implement this sometimes-challenging technology. We anticipate that an understanding of the dynamic interactions between distinct cellular subsystems will lead to new insights on the aging process.
Within the C. elegans community there have been anecdotal suggestions that some fluorescent proteins, most notably mCherry, aggregate in the worm hypodermis and elsewhere. Here, we show preliminary FRAP experiments suggesting that the regions of increased fluorescent protein signal in the hypodermis are more like freely diffusing fluorescent protein than aggregated protein. When we compared the recovery kinetics of photobleached mCherry to an aggregating form of YFP (Q35::YFP), we found that the bonafide Q35::YFP aggregate was essentially static for over an hour; that is, there was still a visible hole in the Q35::YFP aggregate more than an hour after photobleaching. More work certainly needs to be done to definitively determine the nature of these hypodermal structures. It will be important to determine if the fluorescent proteins that do not appear to concentrate in the hypodermis (mEGFP, mECitrine and mNeptune) are in fact localized to the same foci and tubules but are undetectable by microscopy (for example, do to the pH of the microenvironment). It’s intriguing to think that the loading of proteins into structures within the hypodermis might be a natural physiological process, an aspect of proteostasis, or an unknown process that can fortuitously be studied because of the concentration of fluorescent proteins.
Supplementary Material
Supplemental Figure 4 FRAP experiments
Supplemental Figure 6 Microfluidics device
Supplemental Figure 3 mTagBFP2 and mCherry localize into the same vesicles and tubules.
Supplemental Figure 5 Vector maps and protocol for cloning CRISPR RNAs
Supplemental Figure 1 mNeptune expression in yeast
Supplemental Figure 2 Colony PCR screen of yeast assembly
Supplemental Data File 1. Spectrum measurements
Supplemental Table 1. C. elegans strains
Supplemental Protocol. Detailed protocol
Supplemental Data File 2. Vector and primer sequences
Figure 2. DNA Assembly Workflow and Flexibility.
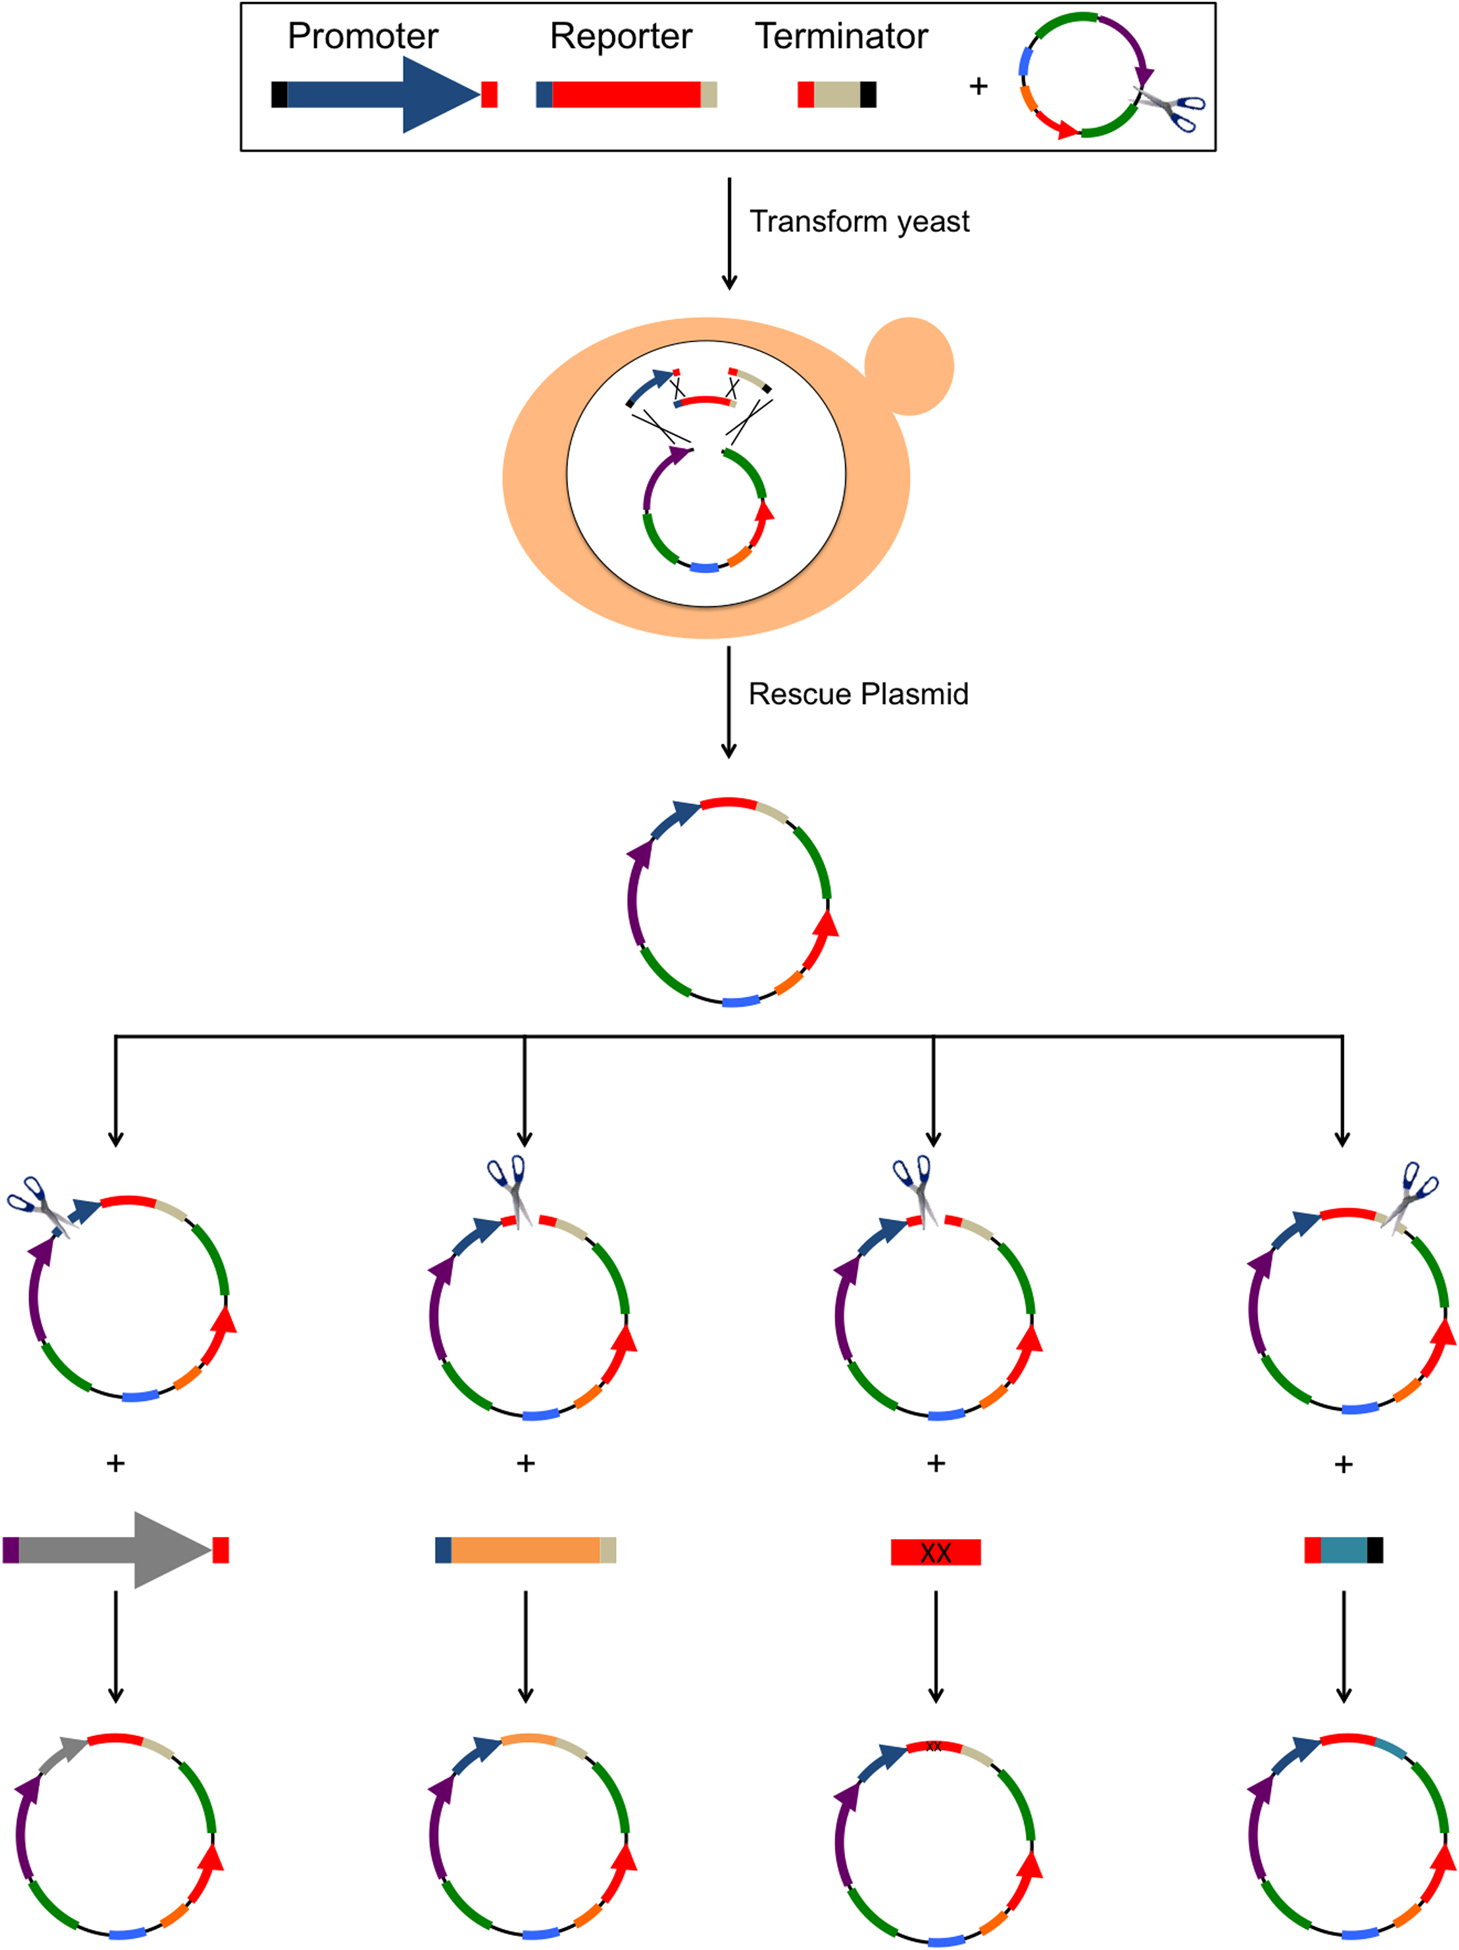
Example of a 4-fragment DNA assembly in yeast consisting of an expression cassette (Promoter, Reporter Gene and Terminator) and linearized BSP179. Each insert has terminal 35bp homology arms to upstream and downstream fragments. Inserts and linearized vector are transformed in yeast where the DNA fragments are assembled by homologous recombination. After plasmid DNA is rescued from yeast, it can be used directly in experiments or act as input DNA for additional constructions. Shown here are four possible constructions made from the resulting plasmid though any piece of DNA can be changed or deleted so long as there is at least one unique restriction site between the homology arms of the new repair template DNA. From left to right we show examples of a promoter swap, a transgene swap, a partial transgene replacement or mutagenesis, and a terminator swap. The homology arms of the insert DNA do not need to be in close proximity to the plasmid linearization site. Any plasmid DNA sequence between the linearization site and the homology arms will be deleted. See Supplemental Protocol for more details.
Acknowledgements:
Some strains were provided by the CGC, which is funded by NIH Office of Research Infrastructure Programs (P40 OD010440). We thank Fabian Rudolf (ETHZ, Basel) for kindly providing the yeast/E. coli dual drug resistant marker. We thank Andy Samuelson, Ilya Ruvinsky and other members of the C. elegans community present at a lunchtime conversation during the 2017 International worm meeting for suggesting the FRAP experiments to help determine the physical nature of the fluorescent proteins in the mysterious tubules and vesicles in the C. elegans hypodermis. We thank Brian Wasko for critical reading of the manuscript and thoughtful discussions.
Funding: Funding was provided by a Pilot grant from the Nathan Shock Center for Excellence in the Basic Biology of Aging to AM (NIA Grant P30AG013280 to MK) and the National Institutes of Health National Institute on Aging Grant number R00AG045341 to AM and P50 AG005136 to MK and a training grant from the National Institute on Aging, T32AG000057, to support NB and MC.
References:
- 1.Pardee AB and Prestidge LS, Ultraviolet-sensitive targets in the enzyme-synthesizing apparatus of Escherichia coli. J Bacteriol, 1967. 93(4): p. 1210–9. [DOI] [PMC free article] [PubMed] [Google Scholar]
- 2.Miller JH, et al. , Fusions of the lac and trp Regions of the Escherichia coli Chromosome. J Bacteriol, 1970. 104(3): p. 1273–9. [DOI] [PMC free article] [PubMed] [Google Scholar]
- 3.Chalfie M, et al. , Green fluorescent protein as a marker for gene expression. Science, 1994. 263(5148): p. 802–5. [DOI] [PubMed] [Google Scholar]
- 4.Heim R, Prasher DC, and Tsien RY, Wavelength mutations and posttranslational autoxidation of green fluorescent protein. Proc Natl Acad Sci U S A, 1994. 91(26): p. 12501–4. [DOI] [PMC free article] [PubMed] [Google Scholar]
- 5.Ormo M, et al. , Crystal structure of the Aequorea victoria green fluorescent protein. Science, 1996. 273(5280): p. 1392–5. [DOI] [PubMed] [Google Scholar]
- 6.Shaner NC, Steinbach PA, and Tsien RY, A guide to choosing fluorescent proteins. Nat Methods, 2005. 2(12): p. 905–9. [DOI] [PubMed] [Google Scholar]
- 7.Shu X, et al. , Novel chromophores and buried charges control color in mFruits. Biochemistry, 2006. 45(32): p. 9639–47. [DOI] [PubMed] [Google Scholar]
- 8.Chudakov DM, et al. , Fluorescent proteins and their applications in imaging living cells and tissues. Physiol Rev, 2010. 90(3): p. 1103–63. [DOI] [PubMed] [Google Scholar]
- 9.Mendenhall A, Driscoll M, and Brent R, Using measures of single-cell physiology and physiological state to understand organismic aging. Aging Cell, 2016. 15(1): p. 4–13. [DOI] [PMC free article] [PubMed] [Google Scholar]
- 10.Frokjaer-Jensen C, Exciting Prospects for Precise Engineering of Caenorhabditis elegans Genomes with CRISPR/Cas9. Genetics, 2013. 195(3): p. 635–42. [DOI] [PMC free article] [PubMed] [Google Scholar]
- 11.Dickinson ME, et al. , Multi-spectral imaging and linear unmixing add a whole new dimension to laser scanning fluorescence microscopy. Biotechniques, 2001. 31(6): p. 1272, 1274–6, 1278. [DOI] [PubMed] [Google Scholar]
- 12.Orr-Weaver TL, Szostak JW, and Rothstein RJ, Yeast transformation: a model system for the study of recombination. Proc Natl Acad Sci U S A, 1981. 78(10): p. 6354–8. [DOI] [PMC free article] [PubMed] [Google Scholar]
- 13.Gibson DG, et al. , Complete chemical synthesis, assembly, and cloning of a Mycoplasma genitalium genome. Science, 2008. 319(5867): p. 1215–20. [DOI] [PubMed] [Google Scholar]
- 14.Gibson DG, et al. , One-step assembly in yeast of 25 overlapping DNA fragments to form a complete synthetic Mycoplasma genitalium genome. Proc Natl Acad Sci U S A, 2008. 105(51): p. 20404–9. [DOI] [PMC free article] [PubMed] [Google Scholar]
- 15.Annaluru N, et al. , Total synthesis of a functional designer eukaryotic chromosome. Science, 2014. 344(6179): p. 55–8. [DOI] [PMC free article] [PubMed] [Google Scholar]
- 16.Sands B and Brent R, Overview of post Cohen-Boyer methods for single segment cloning and for multisegment DNA assembly. Curr Protoc Mol Biol, 2016. 113: p. 3 26 1–3 26 20. [DOI] [PMC free article] [PubMed] [Google Scholar]
- 17.Gibson DG, Gene and genome construction in yeast. Curr Protoc Mol Biol, 2011. Chapter 3: p. Unit3 22. [DOI] [PubMed] [Google Scholar]
- 18.Ma H, et al. , Plasmid construction by homologous recombination in yeast. Gene, 1987. 58(2–3): p. 201–16. [DOI] [PubMed] [Google Scholar]
- 19.Mendenhall AR, et al. , Single Cell Quantification of Reporter Gene Expression in Live Adult Caenorhabditis elegans Reveals Reproducible Cell-Specific Expression Patterns and Underlying Biological Variation. PLoS One, 2015. 10(5): p. e0124289. [DOI] [PMC free article] [PubMed] [Google Scholar]
- 20.Roux AE, et al. , Reversible Age-Related Phenotypes Induced during Larval Quiescence in C. elegans. Cell Metab, 2016. 23(6): p. 1113–1126. [DOI] [PMC free article] [PubMed] [Google Scholar]
- 21.Frokjaer-Jensen C, et al. , Random and targeted transgene insertion in Caenorhabditis elegans using a modified Mos1 transposon. Nat Methods, 2014. 11(5): p. 529–34. [DOI] [PMC free article] [PubMed] [Google Scholar]
- 22.Brachmann CB, et al. , Designer deletion strains derived from Saccharomyces cerevisiae S288C: a useful set of strains and plasmids for PCR-mediated gene disruption and other applications. Yeast, 1998. 14(2): p. 115–32. [DOI] [PubMed] [Google Scholar]
- 23.Gietz RD and Schiestl RH, Frozen competent yeast cells that can be transformed with high efficiency using the LiAc/SS carrier DNA/PEG method. Nat Protoc, 2007. 2(1): p. 1–4. [DOI] [PubMed] [Google Scholar]
- 24.Brenner S, The genetics of Caenorhabditis elegans. Genetics, 1974. 77(1): p. 71–94. [DOI] [PMC free article] [PubMed] [Google Scholar]
- 25.Mello C and Fire A, DNA transformation. Methods Cell Biol, 1995. 48: p. 451–82. [PubMed] [Google Scholar]
- 26.Frokjaer-Jensen C, et al. , Improved Mos1-mediated transgenesis in C. elegans. Nat Methods, 2012. 9(2): p. 117–8. [DOI] [PMC free article] [PubMed] [Google Scholar]
- 27.Frokjaer-Jensen C, et al. , Single-copy insertion of transgenes in Caenorhabditis elegans. Nat Genet, 2008. 40(11): p. 1375–83. [DOI] [PMC free article] [PubMed] [Google Scholar]
- 28.Chee MK and Haase SB, New and Redesigned pRS Plasmid Shuttle Vectors for Genetic Manipulation of Saccharomycescerevisiae. G3 (Bethesda), 2012. 2(5): p. 515–26. [DOI] [PMC free article] [PubMed] [Google Scholar]
- 29.Christianson TW, et al. , Multifunctional yeast high-copy-number shuttle vectors. Gene, 1992. 110(1): p. 119–22. [DOI] [PubMed] [Google Scholar]
- 30.Sikorski RS and Hieter P, A system of shuttle vectors and yeast host strains designed for efficient manipulation of DNA in Saccharomyces cerevisiae. Genetics, 1989. 122(1): p. 19–27. [DOI] [PMC free article] [PubMed] [Google Scholar]
- 31.Broach JR, The yeast plasmid 2 mu circle. Cell, 1982. 28(2): p. 203–4. [DOI] [PubMed] [Google Scholar]
- 32.Broach JR, Guarascio VR, and Jayaram M, Recombination within the yeast plasmid 2mu circle is site-specific. Cell, 1982. 29(1): p. 227–34. [DOI] [PubMed] [Google Scholar]
- 33.Zeiser E, et al. , MosSCI and gateway compatible plasmid toolkit for constitutive and inducible expression of transgenes in the C. elegans germline. PLoS One, 2011. 6(5): p. e20082. [DOI] [PMC free article] [PubMed] [Google Scholar]
- 34.Lin MZ, et al. , Autofluorescent proteins with excitation in the optical window for intravital imaging in mammals. Chem Biol, 2009. 16(11): p. 1169–79. [DOI] [PMC free article] [PubMed] [Google Scholar]
- 35.Morley JF, et al. , The threshold for polyglutamine-expansion protein aggregation and cellular toxicity is dynamic and influenced by aging in Caenorhabditis elegans. Proc Natl Acad Sci U S A, 2002. 99(16): p. 10417–22. [DOI] [PMC free article] [PubMed] [Google Scholar]
- 36.Sands B and Brent R, Overview of post-Cohen-Boyer methods for single segment cloning and for multisegment DNA assembly, in Current Protocols in Molecular Biology. 2015: In Press. [DOI] [PMC free article] [PubMed]
- 37.McNamara G, Larson JM, and Davidson DW. Spectral Imaging and Linear Unmixing 2017. [cited 2018 January 22]; Available from: https://www.microscopyu.com/techniques/confocal/spectral-imaging-and-linear-unmixing.
- 38.Carl Zeiss I Introduction to Spectral Imaging and Linear Unmixing. 2018. [cited 2018 January 22]; Available from: https://www.zeiss.com/microscopy/us/solutions/reference/spectral-imaging/introduction.html#intro.
- 39.Borlinghaus R and Microsystems L. Spectral Detection – How to Define the Spectral Bands that Collect Probespecific Emission. 2013. June 27, 2013 [cited 2018 January 22]; Available from: https://www.leicahttps://www.leica-microsystems.com/science-lab/spectral-detection-how-to-define-the-spectral-bands-that-collect-probe-specific-emission/microsystems.com/science-lab/spectral-detection-how-to-define-the-spectral-bands-that-collect-probe-specifichttps://www.leica-microsystems.com/science-lab/spectral-detection-how-to-define-the-spectral-bands-that-collect-probe-specific-emission/emission/.
- 40.Kennedy BK, et al. , Geroscience: linking aging to chronic disease. Cell, 2014. 159(4): p. 709–13. [DOI] [PMC free article] [PubMed] [Google Scholar]
Associated Data
This section collects any data citations, data availability statements, or supplementary materials included in this article.
Supplementary Materials
Supplemental Figure 4 FRAP experiments
Supplemental Figure 6 Microfluidics device
Supplemental Figure 3 mTagBFP2 and mCherry localize into the same vesicles and tubules.
Supplemental Figure 5 Vector maps and protocol for cloning CRISPR RNAs
Supplemental Figure 1 mNeptune expression in yeast
Supplemental Figure 2 Colony PCR screen of yeast assembly
Supplemental Data File 1. Spectrum measurements
Supplemental Table 1. C. elegans strains
Supplemental Protocol. Detailed protocol
Supplemental Data File 2. Vector and primer sequences