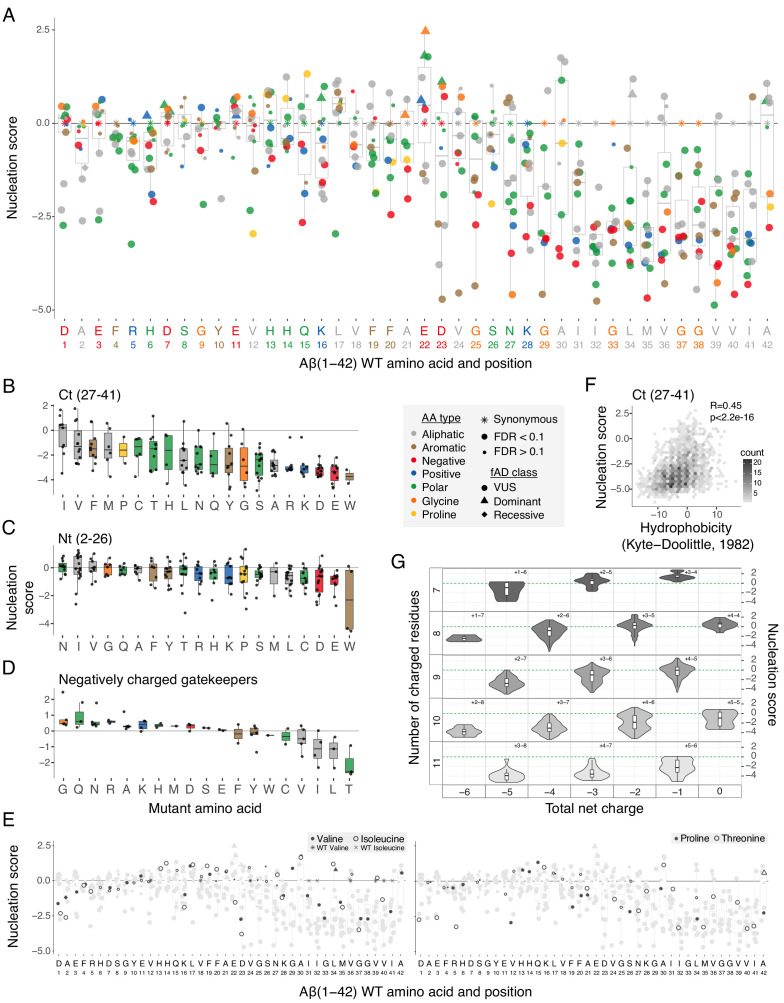
Figure 3. Determinants of amyloid beta (Aß) nucleation.
(A) Effect of single aa mutants on nucleation for each Aß position. The wild-type (WT) aa and position are indicated on the x-axis and coloured on the basis of aa type. The horizontal line indicates the WT nucleation score (0). (B to D) Effect of each mutant aa on nucleation for the Ct (27-41) (B), the Nt (2-26) (C), and the negatively charged gatekeeper positions (D1, E3, D7, E11, and E22) (D). The three position clusters are mutually exclusive. Colour code indicates aa type. The horizontal line is set at the WT nucleation score (0). (E) Effect on nucleation for single aa mutations to proline, threonine, valine, and isoleucine. Mutations to other aa are indicated in grey. The horizontal line indicates WT nucleation score (0). Point size and shape indicate false discovery rate (FDR) and familial Alzheimer’s disease (fAD) class, respectively (see legend). (F) Nucleation scores as a function of hydrophobicity changes (Kyte and Doolittle, 1982) for single and double aa mutants in the Ct (27-41) cluster. Only double mutants with both mutations in the indicated position-range were used. Weighted Pearson correlation coefficient and p-value are indicated. (G) Nucleation score distributions arranged by the number of charged residues (y-axis) and the total net charge (x-axis) for single and double aa mutants in the full peptide (1-42). Only polar, charged, and glycine aa types were taken into account, for both WT and mutant residues. Colour gradient indicates the total number of charged residues. Numbers inside each cell indicate the number of positive and negative residues. The horizontal line indicates WT nucleation score (0). Boxplots represent median values and the lower and upper hinges correspond to the 25th and 75th percentiles, respectively. Whiskers extend from the hinge to the largest value no further than 1.5*IQR (interquartile range). Outliers are plotted individually or omitted when the boxplot is plotted together with individual data points or a violin plot.


