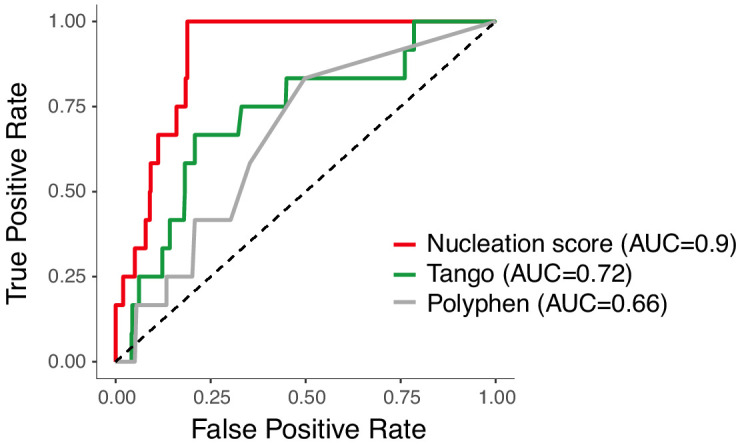
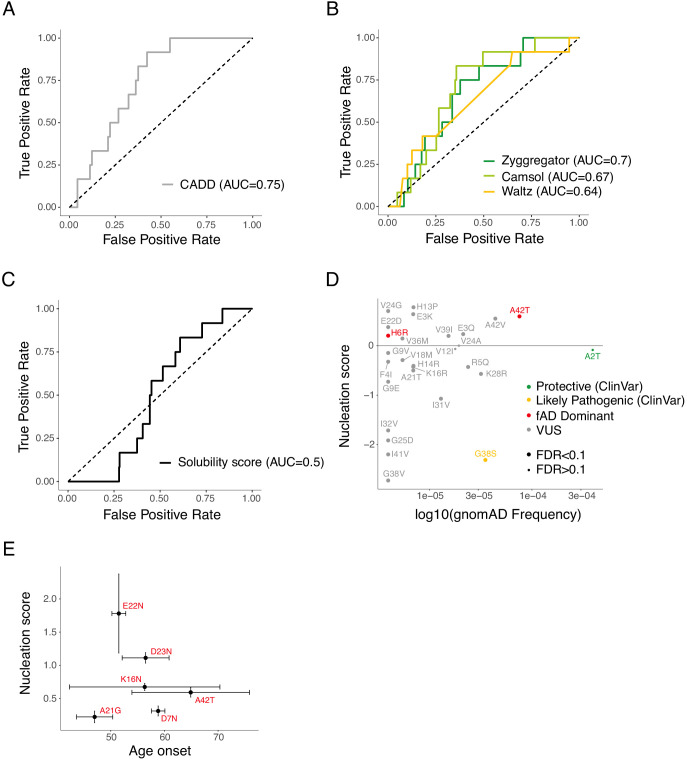
(
A and B) Receiver operating characteristic (ROC) curves built using 12 fAD mutants versus all other single amino acid (aa) mutants in the dataset for variant effect predictors (
A) and aggregation predictors (
B). Area under the curve (AUC) values are indicated in the legend. Diagonal dashed lines indicate the performance of a random classifier. (
C) ROC curve built using 12 fAD mutants versus all other single aa mutants available in the referenced study (
Gray et al., 2019). AUC value is indicated in the legend. Diagonal dashed line indicates the performance of a random classifier. (D) Comparison between nucleation scores (NS) and gnomAD (
Karczewski, 2020) allele frequencies (
https://gnomad.broadinstitute.org/). The horizontal line indicates wild-type (WT) NS (0). The classification of variants is based on Clinvar annotations (
https://www.ncbi.nlm.nih.gov/clinvar/). (
E) Relation between NS and clinical age-of-onset (
Ryman et al., 2014). Vertical and horizontal error lines indicate estimated error associated to NS and standard deviation for age-of-onset, respectively.


