

Abstract
The progress of viral diseases such as the new coronavirus (COVID-19) can be influenced not only by social isolation policies, but also by climatic factors. Understanding how these factors affect the progress of the pandemic caused by severe acute respiratory syndrome coronavirus 2 (SARS-CoV-2) may be essential to know the risks each country is facing because of the disease. In this study, we verified the existence of a relationship between the basic reproduction number (R0) of SARS-CoV-2 with different climate variables, while also considering the Global Health Security Index (GHS). We collected data from confirmed cases of COVID-19 along with their respective GHS notes and climate data, from December 31, 2019 to April 13, 2020, for 52 countries. The generalized additive model (GAM) was applied to explore the effect of temperature, relative humidity, solar radiation index, and GHS score on the spread rate of COVID-19. The countries that showed similarity to each other were grouped into clusters using the Kohonen self-organizing map methodology to investigate the importance of each variable in the dissemination of the disease. The temperature variable presented a linear relationship (p < 0.001) with the R0, with an explained variation of 36.2%, while the relative humidity variable did not present a significant relationship with the R0. The response curve of the solar radiation variable presented a significant nonlinear relationship (p < 0.001) with an explained variation of 32.3%. The GHS index variable, with a significant nonlinear relationship (p < 0.001), presented the largest explanatory response in the control of COVID-19, with an explained variation of 38.4%; further, it was observed that the countries with the largest GHS index scores were less influenced by climate variables.
Keywords: Generalized additive model (GAM), Basic reproduction number (R0), Temperature, Solar radiation index, Coronavirus disease
Graphical abstract

Highlights
-
•
A negative association is found between the incidence of COVID-19 and temperature.
-
•
Countries with higher GHS are less affected by climatic variables.
-
•
Solar radiation index is associated with a lower degree of dissemination of the virus.
1. Introduction
Coronaviruses (CoV) are a large family of viruses that affect humans, targeting mainly their respiratory systems. These viruses stand out for having the largest genomes among all RNA viruses, with approximately 30,000 nucleotides, and primary transmission based on zoonotic transfer [17]. Among the coronaviruses that can infect humans, two had been previously identified as causing severe diseases, these being the Severe Acute Respiratory Syndrome (SARS-CoV), and Middle East Respiratory Syndrome (MERS). In late December 2019 a group of patients in China with an unknown initial diagnosis presented symptoms similar to SARS, leading researchers to identify a new coronavirus (SARS-CoV-2), which was later named COVID-19 by the World Health Organization (WHO) [33]. The new virus has a high transmissibility rate and its propagation occurs mainly by direct contact or by droplets generated from coughing or sneezing from contaminated individuals [3]. The rate of transmission can be measured by the basic reproduction number (R0); this calculation indicates the average number of infections generated from an infected individual in a fully susceptible population. When the R0 exceeds the numerical value of one, it indicates that the number of infected individuals multiplies rapidly and can result in an epidemic [7]. The R0 of a highly contagious disease, such as Measles, ranges from 13 to 18, while that of the common flu is 1.3; the estimate for COVID-19 is between 2 and 3 [27].
The basic reproduction number has been used to guide government decisions aimed at containing the disease outbreak, and the best option to curb its advance has been to adopt social isolation measures since a vaccine or drug that demonstrates total efficacy is not yet available [32]. The manner in which the disease has progressed in each country reveals the discrepancy in health system capacity, political security, and socioeconomic risk of each country; further, it highlights that efficient measures are required to mitigate the pandemic. These discrepancies were measured through the Global Health Security Index (GHS) that indicates a country's capacity to detect and respond to an emerging outbreak. It estimates a global average for 195 countries, by considering the following factors: capacity for early detection and reporting of epidemics; a prepared and robust health sector to treat patients and protect health workers; commitment to improve country capacity, and funding plans to adhere to global standards [19].
Although coronaviruses have been the subject of scientific studies since 1968, this new strain of the virus presents some characteristics that have not yet been well determined, such as its survival rates in outdoor and indoor environments. It is known that viruses do not replicate outside the living cells of their hosts [3]. However, infectious viruses such as SARS-CoV can survive on contaminated environmental surfaces [9]. Studies conducted during the SARS epidemic showed that days with lower temperature, relative air humidity, and solar radiation increased the number of cases of the disease by 18 times when compared to opposite climatic conditions [15]. In the COVID-19 pandemic it was observed that in March 2020, most of the confirmed cases were registered in countries with low temperatures and humidity [31]. Although the behavior of COVID-19 in different climatic conditions is not well known thus far, understanding the stability of the virus in these various environments is of utmost importance to understand the transmission of this new infectious agent.
Thus, the aim of this study was to verify the relationship between the dissemination rate of COVID-19 and climate information, such as environmental temperature, relative humidity, and solar radiation, based on the compilation of data obtained in several countries, whilst also considering the Global Health Security Index (GHS) of the selected countries.
2. Material and methods
2.1. Epidemiological data
We collected publicly-available data on 1,033,796 confirmed COVID-19 cases from 52 countries having more than 100 confirmed cases of the disease (Appendix A), in different climate regions (Fig. 1), for the period from December 31, 2019 to April 13, 2020. The data were extracted from online reports on the European Centre for Disease Prevention and Control (ECDC) website [6]. (See Table A.)
Fig. 1.
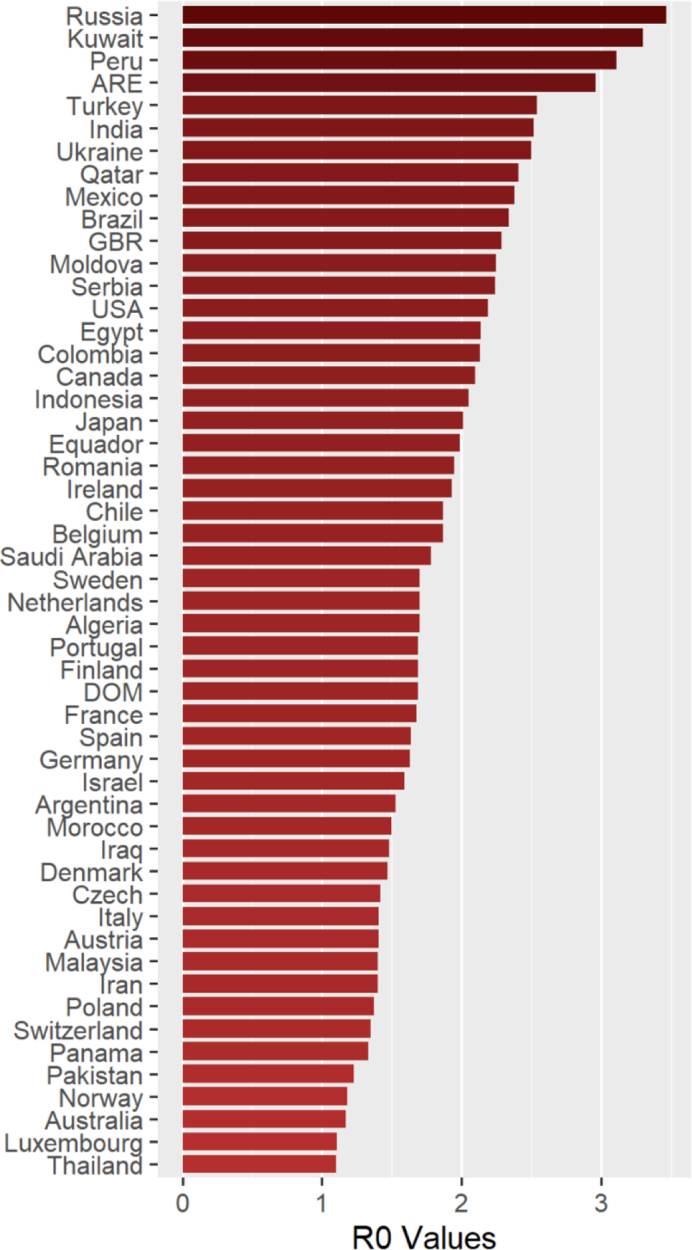
Estimates of the basic reproduction number in the 52 countries studied. The x-axis indicates the R0 values and the y-axis represents the countries.
Abbreviations: ARE: United Arabia Emirates; GBR: United Kingdom; USA: United States of America; DOM: Dominican Republic.
Table A.
Averages of the variables basic reproduction number (R0), GHS index (GHS index), temperature, relative humidity and solar radiation index used in the GAM methodology.
| Countries | R0 Exp | GHS index | Temperature | Relative humidity | Solarwave radiation |
|---|---|---|---|---|---|
| Algeria | 1.7 | 23.8 | 12 | 75.6 | 4.4 |
| Argentina | 1.53 | 58.6 | 22 | 69.45 | 6 |
| Australia | 1.17 | 75.5 | 22 | 66.45 | 5.95 |
| Austria | 1.41 | 58.5 | 4.25 | 66.45 | 2.9 |
| Belgium | 1.87 | 61 | 5.75 | 74.55 | 2.45 |
| Brazil | 2.34 | 59.7 | 22.5 | 78.9 | 5.85 |
| Canada | 2.1 | 75.3 | −3.5 | 72.65 | 3.1 |
| Chile | 1.87 | 58.3 | 20 | 49.55 | 7.3 |
| Colombia | 2.13 | 44.2 | 13.5 | 73.1 | 4.55 |
| Czech | 1.42 | 52 | 3.5 | 71.45 | 2.7 |
| Denmark | 1.47 | 70.4 | 2.5 | 79.85 | 2.05 |
| Egypt | 2.14 | 39.9 | 18 | 57.2 | 5.45 |
| Finland | 1.69 | 68.7 | −2.5 | 80.2 | 1.75 |
| France | 1.68 | 68.2 | 6.75 | 74.75 | 2.7 |
| Germany | 1.63 | 66 | 3.75 | 72 | 2.35 |
| India | 2.52 | 46.5 | 20.75 | 77.2 | 5.5 |
| Indonesia | 2.05 | 56.6 | 27.5 | 81.4 | 4.45 |
| Iran | 1.4 | 37.7 | 9.5 | 44.25 | 4.8 |
| Iraq | 1.48 | 25.8 | 15.75 | 39.55 | 4.9 |
| Ireland | 1.93 | 59 | 6.5 | 80.4 | 2.2 |
| Israel | 1.59 | 47.3 | 11 | 70.3 | 5.1 |
| Italy | 1.41 | 56.2 | 7.5 | 67.55 | 3.35 |
| Japan | 2.01 | 59.8 | 8.75 | 61.6 | 4.05 |
| Kuwait | 3.3 | 46.1 | 18.5 | 50.5 | 5.05 |
| Luxembourg | 1.11 | 43.8 | 4.5 | 76.95 | 2.6 |
| Malaysia | 1.4 | 62.2 | 28 | 77.4 | 5.2 |
| Mexico | 2.38 | 57.6 | 16.5 | 39.65 | 6.5 |
| Moldova | 2.25 | 42.9 | 3 | 63.2 | 3 |
| Morocco | 1.5 | 43.7 | 14.25 | 81.75 | 4.75 |
| Netherlands | 1.7 | 75.6 | 5.5 | 76.8 | 2.4 |
| Norway | 1.18 | 64.6 | −0.75 | 75.55 | 1.8 |
| Pakistan | 1.23 | 35.5 | 15.5 | 70.65 | 4.6 |
| Panama | 1.33 | 43.7 | 28.25 | 69.6 | 6.4 |
| Peru | 3.11 | 49.2 | 23 | 76.3 | 6.15 |
| Poland | 1.37 | 55.4 | 2 | 70 | 2.45 |
| Portugal | 1.69 | 60.3 | 13.5 | 74 | 4.15 |
| Qatar | 2.41 | 41.2 | 21.25 | 60 | 5.4 |
| Romania | 1.95 | 45.8 | 4.5 | 65.3 | 3.25 |
| Russia | 3.47 | 44.3 | −3 | 74.9 | 2.2 |
| Saudi Arabia | 1.78 | 49.3 | 19.75 | 30.75 | 5.7 |
| Serbia | 2.24 | 52.3 | 5.75 | 65.35 | 3.2 |
| Spain | 1.64 | 65.9 | 8.5 | 71.3 | 4.1 |
| Sweden | 1.7 | 72.1 | 0 | 75.9 | 3.2 |
| Switzerland | 1.35 | 67 | 3.5 | 73.6 | 3.2 |
| Thailand | 1.1 | 73.2 | 28.75 | 65.35 | 5.75 |
| Turkey | 2.54 | 52.4 | 3.5 | 65.95 | 3.95 |
| Ukraine | 2.5 | 38 | 0.75 | 71.3 | 2.6 |
| United Arab Emirate | 2.96 | 46.7 | 22.25 | 58.45 | 5.6 |
| United Kingdom | 2.29 | 77.9 | 7.75 | 71.4 | 2.45 |
| USA | 2.19 | 83.5 | 6.75 | 63.55 | 3.8 |
| Equador | 1.99 | 50.1 | 13.75 | 57.025 | 4.9 |
| Dominican Republic | 1.69 | 38.3 | 25 | 73.5 | 6.25 |
2.2. Climate data
Data were collected on temperature (°C), relative humidity (%), and solar radiation (kWh/m2) during the months of December 2019 to April 2020 (Appendix A). The data used to calculate the daily averages for the months studied were extracted from the Weather Spark online web service [25].
2.3. Global Health security index (GHS)
In order to minimize the differences in effects between developed and underdeveloped countries, including from their significant cultural differences, scores used in this study were based on the Global Health Security Index (GHS) (Appendix A). The GHS index is a project of the Nuclear Threat Initiative (NTI) and the Johns Hopkins Center for Health Security (JHU), and it was developed along with the Economist Intelligence Unit (EIU). The GHS indicates a country's ability to detect and respond to an emerging outbreak. The indicators and sub-indicators used for developing the scores can be found online on the GHS Index website [19]. It is known that the way in which this index is calculated can enter as a bias in these analyzes, however according to [5] the GHS index uses the arithmetic mean of the data for the six categories under analysis, so the weights are distributed equally among them. When analyzing each of these categories separately and using different types of statistics, it is possible to conclude that the items where the rapid response to a pandemic and risk detection is foreseen, factors evaluated in this article, have the least impacts for both statistical tests.
2.4. Statistical analysis
2.4.1. Estimation of the basic reproduction number (R0)
To quantify the transmission of COVID-19, we use serial intervals with the log-normal distribution. The mean and standard deviation of the series of intervals were 8.4 and 3.8 days, respectively. Since the estimation of R0 is difficult due to this being a pandemic still in progress, it was agreed to start the calculations from ten cases for each country in order to obtain results closer to the reality of the disease's course.
All analyses were done with the R software (version 3.6.0) using the “R0” package developed by [1].
2.4.2. Generalized additive model (GAM)
When working with nonlinear relationships, as is the case with climatic and epidemiological factors, it is necessary to be mindful of the choice of models that can best represent this association. We used the generalized additive model (GAM) that represents a semiparametric extension of the generalized linear model (GLM), which has been successfully employed to study nonlinear relationships [14,16,20,22,30]. The general model of GAM as given by Hastie and Tibshirani [10] is as follows:
| (1) |
where g(.) are the values of the basic reproduction number; β0 is the overall average response; sjis the smoothing function of the covariates xij; n is the total number of covariates; and εi is the i-th residue, with var.(εi) = ө2assumed to be normally distributed. The choice of the smoothing parameters was made through the restricted maximum likelihood (REML) method. The predictor variables analyzed in this study were the GHS index, temperature (temp), solar radiation index (SR), and relative humidity (RH). In our study, the model was developed as the following:
| (2) |
This GAM model was implemented through the “mgcv” package [29] in the R environment (version 3.6.0). The statistical tests were bilateral.
2.4.3. Self-organizing maps
It was agreed to group the countries that displayed similar predictor variables into clusters using Kohonen's methodology of self-organizing maps [12], in order to investigate how important each variable was in the dissemination of the disease. This methodology is based on a two-tier network that is able to organize the analyzed data from a random start. The results show the natural relationships that exist between the patterns provided to the network, combining an entry layer with a competitive layer trained by the unsupervised learning algorithm [11]. The data were standardized to prevent variables with longer intervals from coordinating the map organization.
All analyses were performed using the R software (version 3.6.0). The “Kohonen” package [26] was used to construct the networks.
3. Results
3.1. Basic reproduction number (R0)
Fig. 1 shows the estimates of R0 values of the 52 countries studied. The probability estimates of R0 ranged from 1.1 to 3.47, with the lowest estimate being for Thailand and the highest for Russia. These values may vary according to the estimation method used as well as the population and containment structure of each country. Because it is a disease with a short progression time and there is insufficient data on this aspect, the general estimates regarding of COVID-19 are still considered biased. However, it is expected that these estimation errors will be minimized as more data are amassed. Thus, considering these conditions, the results of this study corroborate the initial WHO estimate that the R0 of SARS-CoV-2 is between 2 and 3 [28].
3.2. General additive model (GAM)
The response relationship curves of climatic factors and GHS index with R0, including the visual diagnosis of the residual, are found in Fig. 2. The GHS and Solar Radiation variables presented nonlinear relationships (p < 0.001) and explained variations of 38.4% and 32.3%, respectively. The temperature variable presented a decreasing linear relationship (p < 0.001) and an explained variation of 36.2%. The relative humidity variable did not present any significant relationship with R0 (p > 0.05).
Fig. 2.

Response curves for the effects of GHS, Temperature, and Solar Radiation. The x-axis contains the explanatory variables and the y-axis represents the smoothing functions for the R0 values. The relationship between the variables is indicated by the solid lines, and the dotted lines represent the 95% confidence interval (CI). p(y|x) is the probability of the conditional density of the residual.
When analyzing the behavior of the curve presented by the temperature variable (Fig. 2b), it was found that each increase of one unit led to a decrease of 0.001 in the value of R0. The other climate variable that presented significant association was Solar Radiation (Fig. 2a), showing a curved pattern similar to the GHS index (Fig. 2c). When analyzing the behavior of Solar Radiation, we observed an increase of 0.152 R0 from its point of origin, reaching its critical point of 3.35 R0, with a subsequent gradual decrease of 0.099 R0, until it reached the inflection point where it presented a final R0 value of 0.066.
The GHS index presented an increase of 0.026 R0 from its point of origin, reaching the critical point of 46.7 R0; then, there was a subsequent decrease of 0.016 R0, reaching its inflection point where it presented the final value of 0.010 R0.
Considering the conditional density of the residual represented in Fig. 2, the presence of the homoscedasticity component is verified for the variables temperature and solar radiation, presenting a constant variance of the residuals. The same cannot be observed in the GHS index variable, which shows a higher variability of the residual in lower values of the index, confirming the presence of heteroscedasticity. It was not possible to have a constant distribution of the residual even through the use of smoothing functions. Thus, lower GHS values present lower confidence bands, even though the Confidence Interval (CI) is centered on the regression function.
3.3. Self-organizing maps
The optimal network topology was found using five columns and seven rows (5 × 7), totaling 35 neurons. One thousand training iterations were performed in order to select the best net topology, culminating in the formation of five clusters. Fig. 3 show the list of 52 countries studied and the cluster each one was grouped into. The averages obtained in each cluster for the variables R0, GHS index, temperature (Temp), and solar radiation index (SR) are shown in Table 1.
Fig. 3.

Map representing the 52 countries studied, grouped into clusters using the Kohonen methodology. The colors represent the five clusters formed.
Table 1.
Averages of the variables basic reproduction number (R0), GHS index (GHS index), temperature (Temp), and solar radiation index (SR) of the clusters formed using the Kohonen methodology.
| Cluster | R0 value | GHS index | Temp | SR |
|---|---|---|---|---|
| 1 | 2,23 | 44,38 | 17,45 | 5,16 |
| 2 | 1,48 | 35,63 | 13,00 | 4,75 |
| 3 | 1,69 | 57,54 | 23,65 | 5,94 |
| 4 | 1,75 | 62,18 | 4,45 | 2,92 |
| 5 | 2,98 | 41,15 | -1,12 | 2,40 |
4. Discussion
In this study, we sought to understand if climatic factors and the GHS index is associated with the increase or decrease in the transmissibility of the virus. When analyzing the temperature variable, it was observed that its increase led to a decrease in R0. The results corroborate previous studies conducted during the SARS epidemic, where [4] demonstrated that high temperature synergistically inactivated the viability of SARS, while low temperatures increased the survival rate of the virus in contaminated environments. Low temperatures also impact the immunological health of hosts, increasing the chance of lung infections and therefore causing hosts to become more susceptible to viral diseases [21] such as COVID-19. Recently, similar studies have been carried out with COVID-19, which also show negative associations between the number of confirmed cases and climate temperatures [18,24].
Another climatic factor evaluated in this study, solar radiation, presented a negative relationship with the transmissibility of COVID-19. The ultraviolet-B (UV-B) wavelength range has a fundamental effect on the human body, specifically in the synthesis of vitamin D [2]. This, in turn, is strongly related to immunity. In a controlled experiment, Cannel et al. observed that patients who received higher doses of vitamin D were three times less likely to develop flu symptoms. Thus, individuals with lower vitamin D levels have a significantly greater chance of being infected by respiratory diseases [23]. The level of vitamin D manufactured by the human body is dependent on the duration of the skin's exposure to the sun's UV-B rays [2]. Studies conducted with the H1N1 virus showed that countries with higher rates of solar radiation had lower numbers of influenza-infected people, while countries with lower rates of solar radiation had higher numbers of patients with the disease [8].
However, the variable that presented the greatest explanation for the corresponding R0 response was the GHS index. Countries in which this index was higher, i.e., with greater capacity to detect and respond to emerging disease outbreaks, such as those in Clusters 3 and 4, presented similar R0 values. The exception was Cluster 2, which presented a low R0 value and a low GHS index. The countries that comprised this cluster also had the smallest confidence bands due to the greater variability of the residuals, which can be explained by sub-notifications resulting from the different capabilities for COVID-19 detection and notification [13].
Discrepancies in the results for temperature among countries in Clusters 3 and 4 (with a higher GHS index) indicate that climatic difference was not the determining factor for the change in R0 in these cases. It is noted that in countries with lower temperatures (Clusters 4 and 5), prone to greater spread of the virus, the discordant values of R0 are mainly due to GHS scores. In countries with higher temperatures (Clusters 1 and 3), differences between R0 values were lower when compared to colder countries, but were also influenced by GHS indices.
Finally, it can be observed that the R0 index was low in countries with an advanced health system capacity, lower socioeconomic risk, and greater political security, demonstrating that they possess more capacity to control the outbreak regardless of the climate variables. This differs from countries with lower GHS scores, in which the climate has a greater influence on transmissibility (Clusters 1 and 5).
Several limitations of the present study exist. First, given the novelty of COVID-19, it is possible that the onset of the disease and other event data have been treated differently between countries. Second, our data includes a number of different observations from confirmed cases between countries, which may cause a bias in the R0 value. Finally, this study was made possible only through the open sharing of data from confirmed cases in the countries under study, and there may be bias due to the notification and disclosure being the responsibility of each country. Continuous communication of dates and other details related to exposure and infection is crucial to promote scientific understanding of the virus, the infections it causes and measures that can be used to contain and mitigate the spread of the epidemic.
5. Conclusions
The results indicate the existence of a negative relationship between the incidence of COVID-19 and local temperature. A higher solar radiation index was also associated with a lower degree of dissemination of the virus. The variable with the highest explanatory response in the control of COVID-19 was the GHS index, as countries with the lowest values of this indicator also demonstrated greater influences of climate variables on the transmissibility of SARS-CoV-2.
Declaration of Competing Interest
None.
Acknowledgements
This work was supported by the Minas Gerais State Foundation for Research Aid (FAPEMIG) and National Council of Scientific and Technological Development (CNPq).
Footnotes
Supplementary data to this article can be found online at https://doi.org/10.1016/j.onehlt.2021.100235.
Appendix A. Supplementary data
Supplementary material 1
Supplementary material 2
References
- 1.Boelle P.Y., Obadia T. R0: Estimation of R0 and Real-Time Reproduction Number from Epidemics. 2015. https://cran.r-project.org/web/packages/R0/R0.pdf R package version.
- 2.Cannell J.J., Vieth R., Umhau J.C., Holick M.F., Grant W.B., Madronich S., Garland C.F., Giovannucci E. Epidemic influenza and vitamin D. Epidemiol. Infect. 2006;134(6):1129–1140. doi: 10.1017/S0950268806007175. [DOI] [PMC free article] [PubMed] [Google Scholar]
- 3.Carlos W.G., Dela C.C., Cao B., Pasnick S., Jamil S. Novel Wuhan (2019-nCoV) coronavirus. Am. J. Respir. Crit. Care Med. 2020;201(4):P7. doi: 10.1164/rccm.2014P7. [DOI] [PubMed] [Google Scholar]
- 4.Chan K.H., Peiris J.S., Lam S.Y., Poon L.L.M., Yuen K.Y., Seto W.H. The effects of temperature and relative humidity on the viability of the SARS coronavirus. Adv. Virol. 2011;2011 doi: 10.1155/2011/734690. [DOI] [PMC free article] [PubMed] [Google Scholar]
- 5.Chang C.L., McAleer M. Security indexes for risk analysis of COVID-19. Int. J. Environ. Res. Public Health. 2020;17(9):316. doi: 10.3390/ijerph17093161. [DOI] [PMC free article] [PubMed] [Google Scholar]
- 6.ECDC Centro Europeu de Prevenção e Controlo das Doenças. Considerações relativas às medidas de distanciamento social em resposta à COVID-19 – Segunda Atualização. 2020. https://qap.ecdc.europa.eu/public/extensions/COVID-19/COVID-19.html (accessed 4 April 2020)
- 7.Eichner M., Dietz K. Transmission potential of smallpox: estimates based on detailed data from an outbreak. Am. J. Epidemiol. 2003;158(2):110–117. doi: 10.1093/aje/kwg103. [DOI] [PubMed] [Google Scholar]
- 8.Grant W.B., Giovannucci E. The possible roles of solar ultraviolet-B radiation and vitamin D in reducing case-fatality rates from the 1918–1919 influenza pandemic in the United States. Dermato-Endocrinology. 2009;1(4):215–219. doi: 10.4161/derm.1.4.9063. [DOI] [PMC free article] [PubMed] [Google Scholar]
- 9.Hall C.B., Douglas R.G., Jr., Geiman J.M. Possible transmission by fomites of respiratory syncytial virus. J. Infect. Dis. 1980;141(1):98–102. doi: 10.1093/infdis/141.1.98. [DOI] [PubMed] [Google Scholar]
- 10.Hastie T.J., Tibshirani R.J. Vol. 43. CRC Press; 1990. Generalized Additive Models. [Google Scholar]
- 11.Haykin S. 2nd ed. Bookman; 2001. Neural Networks: A Comprehensive Foundation; p. 900. il. [Google Scholar]
- 12.Kohonen T. Self-organizing Maps. Springer; Berlin, Heidelberg: 2001. Learning vector quantization; pp. 245–261. [Google Scholar]
- 13.Lau H., Khosrawipour V., Kocbach P., Mikolajczyk A., Ichii H., Schubert J., Bania J., Khosrawipour T. Internationally lost COVID-19 cases. J. Microbiol. Immunol. Infect. 2020 doi: 10.1016/j.jmii.2020.03.013. [DOI] [PMC free article] [PubMed] [Google Scholar]
- 14.Lin H., Tao J., Kan H., Qian Z., Chen A., Du Y., Liu T., Zhang Y., Qi Y., Ye J., Li S. Ambient particulate matter air pollution associated with acute respiratory distress syndrome in Guangzhou, China. J. Exp. Sci. Environm. Epidemiol. 2018;28(4):392. doi: 10.1038/s41370-018-0034-0. [DOI] [PubMed] [Google Scholar]
- 15.Lin K., Fong D.Y.T., Zhu B., Karlberg J. Environmental factors on the SARS epidemic: air temperature, passage of time and multiplicative effect of hospital infection. Epidemiol. Infect. 2006;134(2):223–230. doi: 10.1017/S0950268805005054. [DOI] [PMC free article] [PubMed] [Google Scholar]
- 16.Liu K., Hou X., Ren Z., Lowe R., Wang Y., Li R., Liu X., Sun J., Lu L., Song X., Wu H. Environmental Research; 2020. Climate Factors and the East Asian Summer Monsoon May Drive Large Outbreaks of Dengue in China; p. 109190. [DOI] [PubMed] [Google Scholar]
- 17.Luis A.D., Hayman D.T., O'Shea T.J., Cryan P.M., Gilbert A.T., Pulliam J.R., Mills J.N., Timonin M.E., Willis C.K., Cunningham A.A., Fooks A.R. A comparison of bats and rodents as reservoirs of zoonotic viruses: are bats special? Proc. R. Soc. B Biol. Sci. 2013;280(1756) doi: 10.1098/rspb.2012.2753. Published 2013 Feb 1. [DOI] [PMC free article] [PubMed] [Google Scholar]
- 18.Ma Y., Zhao Y., Liu J., He X., Wang B., Fu S., Yan J., Niu J., Zhou J., Luo B. Science of The Total Environment; 2020. Effects of Temperature Variation and Humidity on the Death of COVID-19 in Wuhan, China; p. 138226. [DOI] [PMC free article] [PubMed] [Google Scholar]
- 19.Nuclear Threat Initiative and the Johns Hopkins Center for Health Security GHS Index: Findings and Recommendations. 2019. http://wwwghsindex.org (accessed 13 April 2020)
- 20.Peng R.D., Dominici F., Louis T.A. Model choice in time series studies of air pollution and mortality. J. R. Statist. Soc. Ser. A (Statist. Soc.) 2006;169(2):179–203. doi: 10.1111/j.1467-985X.2006.00410.x. [DOI] [Google Scholar]
- 21.Shephard R.J., Shek P.N. Cold exposure and immune function. Can. J. Physiol. Pharmacol. 1998;76(9):828–836. doi: 10.1139/cjpp-76-9-828. [DOI] [PubMed] [Google Scholar]
- 22.Talmoudi K., Bellali H., Ben-Alaya N., Saez M., Malouche D., Chahed M.K. Modeling zoonotic cutaneous leishmaniasis incidence in Central Tunisia from 2009-2015: forecasting models using climate variables as predictors. PLoS Negl. Trop. Dis. 2017;11(8) doi: 10.1371/journal.pntd.0005844. [DOI] [PMC free article] [PubMed] [Google Scholar]
- 23.Urashima Takaaki Segawa, Okazaki Minoru, Kurihara Mana, Wada Yasuyuki, Ida Hiroyuki. Randomized trial of vitamin D supplementation to prevent seasonal influenza A in schoolchildren. Am. J. Clin. Nutr. May 2010;91(5):1255–1260. doi: 10.3945/ajcn.2009.29094. [DOI] [PubMed] [Google Scholar]
- 24.Wang L., Li J., Guo S., Xie N., Yao L., Cao Y., Day S.W., Howard S.C., Graff J.C., Gu T., Ji J. Science of the Total Environment; 2020. Real-Time Estimation and Prediction of Mortality Caused by COVID-19 with Patient Information Based Algorithm; p. 138394. [DOI] [PMC free article] [PubMed] [Google Scholar]
- 25.Weather Spark The Typical Weather Anywhere on Earth. 2020. https://weatherspark.com/ URL. (accessed on 13 April, 2020)
- 26.Wehrens R., Buydens L.M. Self-and super-organizing maps in R: the Kohonen package. J. Stat. Softw. 2007;21(5):1–19. doi: 10.18637/jss.v021.i05. [DOI] [Google Scholar]
- 27.World Health Organization (WHO) Statement on the Second Meeting of the International Health Regulations (2005) Emergency Committee Regarding the Outbreak of Novel Coronavirus. 2020. https://www.who.int/news-room/detail/30-01-2020-statement-on-the-second-meeting-of-the-international-health-regulations-(2005)-emergency-committee-regarding-the-outbreak-of-novel-coronavirus-(2019-ncov) (accessed on 13 April, 2020)
- 28.World Health Organization (WHO) COVID-19. 2020. https://www.who.int/zh/news-room/detail/30-01-2020 (accessed on 13 April, 2020)
- 29.Wood S.N. Fast Stable Restricted Maximum Likelihood and Marginal Likelihood Estimation of Semiparametric Generalized Linear Models. 2011. https://cran.r-project.org/web/packages/mgcv/mgcv.pdf R package version.
- 30.Wu X., Lang L., Ma W., Song T., Kang M., He J., Zhang Y., Lu L., Lin H., Ling L. Non-linear effects of mean temperature and relative humidity on dengue incidence in Guangzhou, China. Sci. Total Environ. 2018;628:766–771. doi: 10.1111/j.1467-9868.2010.00749.x. [DOI] [PubMed] [Google Scholar]
- 31.Yu I.T., Li Y., Wong T.W., Tam W., Chan A.T., Lee J.H., Leung D.Y., Ho T. Evidence of airborne transmission of the severe acute respiratory syndrome virus. N. Engl. J. Med. 2004;350(17):1731–1739. doi: 10.1056/NEJMoa032867. [DOI] [PubMed] [Google Scholar]
- 32.Zhang J., Litvinova M., Liang Y., Wang Y., Wang W., Zhao S., Wu Q., Merler S., Viboud C., Vespignani A., Ajelli M. Changes in contact patterns shape the dynamics of the COVID-19 outbreak in China. Science. 2020 doi: 10.1126/science.abb8001. [DOI] [PMC free article] [PubMed] [Google Scholar]
- 33.Zhao S., Lin Q., Ran J., Musa S.S., Yang G., Wang W., Lou Y., Gao D., Yang L., He D., Wang M.H. Preliminary estimation of the basic reproduction number of novel coronavirus (2019-nCoV) in China, from 2019 to 2020: a data-driven analysis in the early phase of the outbreak. Int. J. Infect. Dis. 2020;92:214–217. doi: 10.1016/j.ijid.2020.01.050. [DOI] [PMC free article] [PubMed] [Google Scholar]
Associated Data
This section collects any data citations, data availability statements, or supplementary materials included in this article.
Supplementary Materials
Supplementary material 1
Supplementary material 2