

Abstract
The COVID-19 outbreak is in its growing stage due to the lack of standard diagnosis for the patients. In recent times, various models with machine learning have been developed to predict and diagnose novel coronavirus. However, the existing models fail to take an instant decision for detecting the COVID-19 patient immediately and cannot handle multiple medical sensor data for disease prediction. To handle such challenges, we propose an intelligent health monitoring and prediction framework, namely the iCovidCare model for predicting the health status of COVID-19 patients using the ensemble Random Forest (eRF) technique in edge networks. In the proposed framework, a rule-based policy is designed on the local edge devices to detect the risk factor of a patient immediately using monitoring Temperature sensor values. The real-time health monitoring parameters of different medical sensors are transmitted to the centralized cloud servers for future health prediction of the patients. The standard eRF technique is used to predict the health status of the patients using the proposed data fusion and feature selection strategy by selecting the most significant features for disease prediction. The proposed iCovidCare model is evaluated with a synthetic COVID-19 dataset and compared with the standard classification models based on various performance matrices to show its effectiveness. The proposed model has achieved 95.13% accuracy, which is higher than the standard classification models.
Keywords: COVID-19, Health monitoring, Disease prediction, eRF classification model, Feature selection, Edge networks
1. Introduction
The recent spread of the COVID-19 disease simply referred to as coronavirus pandemic, is an ongoing pandemic worldwide, causes by Severe Acute Respiratory Syndrome Coronavirus 2 (SARSCoV2)1 [1]. The outbreak of the COVID-19 pandemic was initiated in Wuhan, China in December 2019.2 According to the World Health Organization (WHO), the coronavirus most likely spreads from animal origin and is a negatively stranded RNA virus, which causes severe acute respiratory syndrome from common colds [2]. More importantly, the coronavirus disease can run its courses without any symptoms of illness on a patient body, however, the infection can include severe pneumonia and in the worst case, the patient can die. This virus swarms the lungs of the patients after a few days of throat infection and can have devastating effects and manifesting fever, cough, and severe headache [3], [4]. In the case of young people, infected with coronavirus disease, the illness runs its course without any complications and the patient gets well soon. However, this virus affects mostly elderly people and people with chronic diseases [5], [6]. The main mode of transmission of the coronavirus is droplet mode and the virus spreads mainly through the close contact person, especially through coughing.3 As of 7th August 2020, more than 18.9 million cases have been reported of COVID-19 in more than 200 countries and territories, where more than 712,000 deaths occurred and more than 11.4 million people have recovered.4 Therefore, immediate and accurate prediction of the coronavirus disease in its early stage is very important to effectively treat the patient before spreading the virus on the patient body.
The coronavirus disease can be identified by using wearable sensors (such as temperature sensor) or conducting medical tests in the hospital. However, in most cases, extracting valuable risk factors of coronavirus disease through temperature sensor data with some API (Application Programming Interface) or electronic medical tests is difficult. Nowadays, to detect coronavirus disease, wearable body sensor networks (WBSN) are used to monitor the patient’s body at a regular time interval and externally through various medical sensors (MSs). However, the medical sensor data (MSD) for the coronavirus disease prediction is corrupted by a single artifact such as noise and missing value, which reduces the system performance and accuracy level of disease prediction. Thus, the first challenging task in WBSN is to utilize both previous medical records (PMRs) of the patients and MSD together while monitoring COVID-19 patients. The second challenging task is to extract the meaningful and relevant features from the dataset for increasing the accuracy of disease prediction. Therefore, to identify the hidden syndromes of the COVID-19 patient and identify the presence of coronavirus inside the patient body, an intelligent framework is required for extracting the important features from both the MSD and PMRs with data fusion and feature selection techniques and predicts the disease with a classification model.
1.1. Motivation
Due to the outbreak and increasing number of deaths of coronavirus disease, the prediction of COVID-19 disease is one of the challenging tasks in the health-care domain. Currently, several models have been developed to predict and analyze the coronavirus disease on centralized cloud servers with MSs data. Furthermore, the existing system models of coronavirus disease prediction are based on various data mining and machine learning approaches instead of using data fusion and feature selection techniques. Thus, due to a lack of theoretical support, the existing approaches fail to increase the accuracy of disease prediction while minimizing the mean square error. Besides that, the collected dataset on coronavirus disease through MSs contains relevant features along with many irrelevant and redundant features. Such features can increase the noise level and create confusion while preparing the final dataset before applying the classification model for disease prediction. As a result, handing such a dataset with irrelevant features can reduce the prediction accuracy while increasing the run-time of data classification and prediction. Therefore, it is necessary to remove the unnecessary features and prepare an updated dataset before applying the standard classification model for disease prediction. Moreover, another important research aspect of COVID-19 is to take an instant decision for the emergency patient. Motivated by the above-mentioned challenges, we develop an intelligent health prediction model using a feature selection technique and ensemble Random Forest (eRF) classification model for increasing the accuracy of the coronavirus disease prediction in edge networks.
1.2. Contributions
In this paper, a novel intelligent health monitoring and prediction model, namely the iCovidCare model is designed for coronavirus disease prediction using the feature selection technique and eRF classification model. Initially, the data of a patient is collected efficiently based on two different modes, namely MSD and PMRs. Next, an instant decision-making approach is developed to take an immediate decision about the risk-factor of coronavirus disease using the temperature sensor data and age of the patient with a rule-based approach on the local edge devices. The detailed analysis of the coronavirus disease prediction is evaluated on the centralized cloud servers with the MSD and PMRs of the patients. The data fusion and feature selection strategy are used to combine the MSD and PMRs and generates rich healthcare data. Secondly, data integration and data preprocessing approaches are developed to reduce the number of features set with suitable feature weight for increasing the accuracy level of coronavirus disease prediction. Finally, an eRF classifier is used to train the proposed iCovidCare model for coronavirus disease prediction. The major contributions of the proposed work are discussed as follows:
-
•
For COVID-19 disease prediction, an intelligent prediction model, namely the iCovidCare model is developed in edge networks using data fusion and feature selection strategies with the eRF classification model for COVID-19 disease prediction.
-
•
An instant decision-making strategy is developed to diagnose coronavirus disease on a patient body at local edge devices with minimum delay using the temperature sensor data using a rule-based approach.
-
•
A Data fusion technique is applied to combine both the MSD and the PMRs for COVID-19 disease prediction. Moreover, different data preprocessing techniques along with the proposed feature selection strategy are used for noise reduction and decrease the dimensionality and complexity of the dataset.
-
•
The eRF classification model is used to train the iCovidCare model for coronavirus disease prediction and analysis the risk factor of the COVID-19 patients.
-
•
An extensive empirical study has been conducted to evaluate the effectiveness of the proposed iCovidCare model. The proposed model enhances the performance by achieving higher accuracy of 95.13% as compared to the standard classification models.
1.3. Paper organization
The rest of the paper is structured as follows: Section 2 discusses a brief review of the coronavirus disease prediction models and importance of RF classification model. Section 3 introduces the proposed iCovidCare model in edge networks followed by the proposed methodologies for COVID-19 disease predictions. The empirical evaluations of the proposed model have been discussed in Section 4. Finally, the conclusion and future research scopes are discussed in Section 5.
2. Related work
Nowadays, one of the critical tasks in the healthcare domain is to predict the various risk levels of COVID-19 affected patients based on their MSD and PMRs. More importantly, extracting the useful features from these raw data, and then fuse those data to prepare a structured dataset for further prediction, is a challenging task. Besides that, the selection of highly critical features from the fused data for enhancing accuracy with a standard classification model on disease prediction is another challenging task. Therefore, in this section, we discuss the existing disease diagnostic models based on WBSN, data and feature-level fusion techniques, and various standard classification models for disease prediction.
WBSN plays a critical role in monitoring vital signs of the patients in a regular time interval to improve the COVID-19 disease prediction [7], [8]. Also, the data fusion techniques are highly used to integrate the raw sensor data from several monitoring devices and produce data in a more consistent, accurate, and useful form [9], [10]. To address this issue, authors in [11] used a variable ranking method to extract relevant features and predict the risk factors of cardiovascular diseases. Further, it can perform better over the stored data in a structured format by removing noisy and inaccurate data. However, there would be many redundant variables in a given feature set. To overcome this issue, feature selection strategy [12] has been introduced to select the most significant features for training the models that can significantly improve the accuracy. In [13], the dependency between two stochastic variables and similar weights to all the selected features have been considered for a given dataset. To reduce the dimensionality of the dataset, a chi-square technique with Principle Component Analysis (PCA) has been introduced to enhance the prediction accuracy of the classification models [14]. Though this method selected the most important features for identifying risk factors from the heart disease dataset, it does not support a dataset with a small sample size. Further, it requires a larger dataset with different feature selection techniques. Hence, the assignment of unique weights and scores based on the sample size and the selected set of features is a primary challenging task before training the machine learning models.
Many researchers have developed various disease prediction models using different machine learning classification algorithms [15], [16], [17]. Several classification models including linear regression (LR), Support Vector Clustering (SVC), Decision Tree (DT), Random Forest (RF), and Gaussian Naive Bayes (GN) were analyzed and tested using various healthcare datasets for disease prediction [18], [19], [20]. Here, the prediction accuracy of all classification models varies due to the sample data size, noisy data, missing values, and random selection of features for validation. Authors in [21] evaluated well-known classifiers at the initial level, then combined overall predictions to achieve better performance using gradient boosting classifier. However, this classifier will increase the random feature sets due to the unfused dataset. The statistical and correlation methods along with machine learning algorithms in [22] showed better accuracy for predicting the COVID-19 disease severity and mortality rate using several clinical parameters. Moreover, supervised machine learning models for COVID-19 infected patients have been developed in [23], these learning algorithms validated using epidemiology labeled dataset to identify the positive and negative COVID-19 cases. Also, the correlation coefficient analysis technique has been incorporated to determine the various dependent and independent feature sets before developing the models.
In recent times most of the existing works [24], [25], [26], [27] have applied the RF classification model to achieve better accuracy over various healthcare datasets for disease prediction. The empirical evaluations of these algorithms have indicated that the RF classification model performs superior to the standard classification models. Moreover, these existing models revealed the unavailability of high-quality clinical datasets, lack of multi-model learning and external validation of vital signs from the healthcare professionals, and the absence of selecting the most critical feature sets. This will highly reduce the disease prediction accuracy since these clinical aspects need to be addressed for further refining the classification models. By motivating the above-mentioned issues, in this paper, we proposed an intelligent model for COVID-19 disease risks prediction with a feature selection strategy and ensemble RF classification model.
3. iCovidCare model and disease prediction methodology
In this section, the structure of the proposed iCovidCare model has been discussed in detail. Further, we highlight the instant decision policy at local edge devices followed by the disease prediction mechanism with multiple monitoring parameters with proposed data fusion strategy and eRF technique.
3.1. iCovidCare model
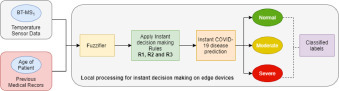
The structure of the proposed iCovidCare model in edge networks is shown in Fig. 1 . The proposed model has two data sources such as the wireless body sensor network (WBSN) and the PMRs of the patients (represented as ). The proposed model uses a set of MSs including Body Temperature (BT-), Oxygen Saturation (OS-), Blood Pressure (BP-), Respiration Rate (RR-), and Heart Rate (HR-) of the patients to collect internal and external physiological data for daily health monitoring and prediction, which are transmitted to the processing devices through a local edge device or gateway via WiFi (Task 1 in Fig. 1). Further, the iCovidCare model consists of two processing devices for instant decision making and future disease prediction such as a set of local edge devices (represented as and a centralized cloud data center (CDC) with a set of resource-rich cloud servers (represented as . The local edge devices are used for taking an instant decision based on the temperature sensor data and age of the patient using a rule-based policy (Task 2 in Fig. 1).
Fig. 1.

Structure of proposed iCovidCare model.
After taking an instant decision of the patients, the local edge devices transfer the health monitoring data to the centralized CDC via Long-Term Evolution for further prediction. Initially, the MSD and the PMRs of the patients are securely stored in a database of the CDC, namely Monitoring Data Storage (MDS) (Task 3 in Fig. 1). Further, the health prediction model of the CDC starts to predict the coronavirus disease using MSD and the PMRs of the patients (Task 4 in Fig. 1). The health prediction model consists of three main phases: 1) Data Fusion; 2) Data Preprocessing with feature selection; 3) Classification model for disease prediction. In the first phase, the features are extracted from both MSD and the PMRs using the proposed fusion techniques (Task 5 in Fig. 1). Next, the fused data are preprocessed for removing the noise and missing-data filtering using various data mining techniques (Task 5 in Fig. 1). Finally, the preprocessed data are passed through the RF classifier for the final COVID-19 disease prediction of the patient (Task 6 in Fig. 1). Further, the analyzed data are stored in the MDS of the CDC for future disease analysis and prediction (Task 7 in Fig. 1).
3.2. Instant disease identification
The initial solution of the proposed iCovidCare model is to take an instant decision of COVID-19 disease on a patient body at the edge of the networks. The local edge devices of the proposed iCovidCare model consider two types of data for COVID-19 disease identification: body temperature data, collected by a BT-MS1, and age of the patient, retrieved from the PMRs of the patient. In this model, we have considered that the age of the registered patients is stored on the resource-constrained local edge devices, whereas the remaining PMRs of the patients are stored on the resource-rich cloud database (as shown in Fig. 1).
In this strategy, automated detection and classification of the temperature sensor values from the patient body support early diagnosis of the COVID-19 disease along with the age of the patient and takes immediate action for his/her treatment, especially the patients who have moderate or severe symptoms (as shown in Fig. 2 ). In this context, only the data from the temperature medical sensor is observed and analyzed every ten minutes to determine the health condition of an individual patient. Subsequently, the if-then rule-based classification technique is applied to the observed temperature samples at the local edge device before transmitting to the centralized cloud server. This technique makes use of a set of rules for classifying the observed samples (i.e. patients temperature value5 and age belong to severe, moderate, or normal) by assigning a specific rank or condition to these rules. For disease classification, we define eight rules to detect the risk levels of COVID-19 patients, which are defined as follows.
Fig. 2.
Instant decision making for COVID-19 disease on edge devices.
Rule 1 : IF THEN Patient Condition is Normal.
Rule 2 : IF THEN Patient Condition is Severe.
Rule 3 : IF THEN Patient Condition is Moderate.
Rule 4 : IF THEN Patient Condition is Severe.
Rule 5 : IF THEN Patient Condition is Moderate.
Rule 6 : IF THEN Patient Condition is Severe.
Rule 7 : IF THEN Patient Condition is Severe.
Rule 8 : IF a patient does not belong to any of the above groups, his/her condition is Normal.
With the help of the proposed rule-based classification policy, the hospital authority can easily take necessary action on the COVID-19 patients and ask them to isolate themselves or stay at home/hospital based on the aforesaid severity conditions. The proposed methodologies of the COVID-19 disease prediction on the centralized cloud servers are discussed in the following sections.
3.3. Data fusion technique
Data fusion is one of the most significant methods in real-time sensor data analysis. This process integrates the raw data from multiple sources including MSD and PMRs of the patients to generate a more consistent, accurate, and useful dataset. In the data fusion level, both MSDs and PMRs are used to effectively filter the unnecessary data. To achieve this, initially, various risk factors related to COVID-19 disease are extracted from the PMRs dataset. For example, the proposed data fusion strategy extracts the age and body temperature values along with other chronic disease parameters to identify the risk level of the patient. Besides that, it completely removes the medical records that contain no history of chronic diseases. Further, other raw data collected from the MSDs are fused, as described in Section 3.4. Finally, the fused sensor data with extracted risk factors from the PMRs dataset is merged and stored into comma-separated value in (.CSV) files for training the classification models. In this way, the training models use the best combination of the features for COVID-19 disease prediction
3.4. Data preprocessing techniques
Data preprocessing is one of the most important steps before applying classification models for disease identification. To improve the accuracy of the disease prediction, the inconsistent, incomplete, and noisy real-world data need to be preprocessed with some techniques including missing-data filtering, data integration, data normalization, and feature selection. Therefore, to increase the accuracy of the COVID-19 disease prediction, we have applied the above-mentioned four types of preprocessing techniques for preparing the noise-free dataset.
3.4.1. Missing-data filtering
The data received from the MSs from the patient body and data extracted from the PMRs of the patients contain some incorrect and useless information. Sometimes while receiving the MSD through the gateways for COVID-19 disease prediction, the data may damage due to various signal artifacts including noise and missing values, which can reduce the disease prediction accuracy. On the other hand, the PMRs of the patients may contain some missing values due to the failure of the text mining techniques during recognizing FRF value. To overcome the above-mentioned issues of MSD and PMRs files and to prepare a noise-free dataset, we employ a simple Kalman filter method for removing noise, inconsistencies and remove duplicate records [28]. Furthermore, two unsupervised filters, namely Remove Useless and Replace Missing Values are utilized in the initial stage of data filtering to remove useless information with a maximum 90% variance and replace the missing values with the mean and median values with the existing data in a structured dataset using Eq. (1) [29].
| (1) |
Here, represents features, = pid, age, gen, bt, osr,...,hr, rr, bp, represents the category level. Both and indicate the number of patterns and pattern of the feature with respect to respectively. Further, represents the mean value of feature under category . replaces the missing values of feature (i.e. gen) within category . Moreover, the missing values in the PMRs are replaced by the current FRF attribute values in the structured dataset.
3.4.2. Data integration
Data integration is another important step in preprocessing that merges the raw healthcare records from different sources to process and store them into a single database. Typically, the combined datasets may contain some redundant values that lead to poor quality of the data. In such a case, predicting the COVID-19 disease of a patient becomes very difficult due to the redundancy and inconsistency in the attribute values. For resolving this issue, we introduce a correlation-based feature filtering (CFF) method to find the subset of the most relevant feature from the COVID-19 dataset for training the classification models. This preprocessing technique uses an intelligent score () to pick the most significant feature for predicting the dependent variable, which is defined as follows.
| (2) |
Where denotes the set of features. Both and represent the average feature class correlation and average feature-feature inter-correlation, respectively.
3.4.3. Data normalization
The combined COVID-19 dataset () with MSD and PMRs of the patients contains several features with different numerical values, which may increase the burden of the computation process of classification models for disease prediction. To reduce this burden, the data normalization process is applied to re-scale one or more attributes for normalizing the attribute values of the dataset in the range between [0, 1]. In the proposed iCovidCare model, we apply the well-known max-min normalization technique. This technique helps to convert and rescale the numerical values of the COVID-19 dataset within the range of [0, 1] [30]. For an instant, in the COVID-19 dataset, one of the feature variables is age, whose values vary from 0100. Moreover, this process reduces the computation difficulties and numerical complexity of the classification models. The numerical data value () of () is changed into the normalized form () within the range of [0, 1] using the following formulation.
| (3) |
Where, indicates the normal data value. Both and represent the minimum and maximum data value, respectively. Then, and denote the range of the converted dataset, which assigns the values for and .
3.5. Feature selection
Patient health-care information including MSD and the PMRs contains several irrelevant features, which can degrade the performance of disease prediction. Thus, one of the important research challenges in the field of disease prediction is to extract meaningful information from the combined MSD and the PMRs dataset by removing irrelevant features. Therefore, for improving the prediction accuracy of the COVID-19 disease, feature selection is one of the most important steps that improve the clarity of the data and reduces the training time. In the proposed iCovidCare model, we apply the Information Gain (IG) approach for removing the noise and selecting the important features from the COVID-19 dataset for further classification. The IG approach helps to find the difference between prior and post entropy between two distinct variable and which is defined as follows.
| (4) |
Here, and represent the discrete random variables. The prior entropy of feature is calculated as follows.
| (5) |
Where presents the prior probability for . Then, the conditional entropy of after applying post entropy of is calculated based on the following Equation.
| (6) |
Finally, the IG is measured by substituting Eqs. (5) and (6) (alternatively, put the values of Eqs. (5) and (6) into Eq. (4)), which is defined as follows.
| (7) |
The iCovidCare model estimates the important features from the COVID-19 dataset for disease prediction using Eq. (7) by measuring the IG for each feature. Thus, the IG approach helps to estimate the important features of the dataset for improving the accuracy of COVID-19 disease prediction with a minimum number of features. Further, a feature weight approach is used over the selected features for assigning a weight to each feature and removing the irrelevant and redundant features from the training COVID-19 dataset [31]. In this paper, the proposed iCovidCare model uses a probabilistic approach for assigning a feature weight on each class for task prediction. This approach helps to improve the prediction accuracy of the training dataset and performance of the proposed model with the standard classification models. In the proposed probabilistic approach of the feature weight, each feature shares a different weight. Let us consider that represents the features variables of a class. Further, is an instance that can signify the feature vector where represents the weight of the feature . The feature weight of the specific instance is defined based on the following Equation.
| (8) |
Here, and represent the particular weight of feature value of the class and the class variable, respectively. The values of lies within the range of [0, 1] and is related to the feature value of of the class . The main goal of the feature weight approach is to prepare the COVID-19 dataset into a more manageable form to improve the prediction accuracy of the COVID-19 disease using the eRF classification model. The proposed methodology is illustrated using Fig. 3 .
Fig. 3.

Illustration of Feature Selection strategy.
3.6. RF classification model for disease prediction
In this section, we discuss the COVID-19 disease prediction using the eRF classification model over the COVID-19 dataset with the selected set of features. The eRF model is a powerful multi-way classifier algorithm for disease prediction and an ensemble of different trees. Also, it consists of multiple trees (also known as a decision tree) and combines the predicted values obtained from the trees. This policy helps to make the eRF model is a powerful one for prediction. These trees of the RF model contain two different stages including ensemble learning and feature selection. Firstly, samples from the training dataset are randomly selected, which ensures that each tree predicts some values using a set of rules. Secondly, the algorithm combines the predicted values from all trees to find the best split. The eRF model has several advantages over other the standard classification models such as (a) eRF model performs well for both categorical and continuous variables, (b) eRF model handles the missing values and noise data for higher accuracy, (c) eRF model reduces the overfitting problem in decision trees and reduces the variance of the dataset while prediction. Besides that, a higher number of trees of the eRF model always helps to provide the high accuracy of disease prediction.
The proposed methodology of the eRF classification model for COVID-19 disease prediction is shown in Fig. 4 . Initially, the eRF model trains the model based on the selected set of features from COVID-19 dataset (using IG approach for feature selection, as discussed in Section 3.5). Further, the iCovidCare model predicts the COVID-19 disease based on the real-time MSD and PMRs of the patients, as shown in Fig. 4. Let us consider that and represent the set of random variables and the set of responses, respectively. A function helps to predict the response for the random variable . The records of the dataset () of works as an independent pairs in the form of with . For COVID-19 disease prediction, we use infinite RF for the dataset. For collecting numbers of random trees, the predicted value for the th tree in the collection at is where represent the random variables of dataset. A unified finite forest is derived by aggregating the results of individual trees of the eRF, which is derived as follows.
| (9) |
Fig. 4.

Illustration of COVID-19 disease prediction using Classification Models.
The pseudo code of the eRF classification model is shown in Algorithm 1.
Algorithm 1.

eRF classification model.
4. Empirical evaluation and analysis
In this section, we discuss the system-level analysis of the proposed iCovidCare model with different classification algorithms for COVID-19 disease prediction using synthetic structure datasets. One of the essential tasks to determine the performance accuracy of the model is to identify an accurate classifier with higher prediction accuracy over synthetic datasets before and after the data fusion technique. Moreover, it is very hard to predict the optimal set of features that would be the most suitable for COVID-19 risk assessments. Based on these insights, the most significant features from the datasets are applied to train the model after performing data fusion, preprocessing, feature extraction, and feature selection techniques as discussed in Section 3. As a result, to show the prominence of the proposed iCovidCare model, several standard classification algorithms including Linear Regression (LR), Support Vector Clustering (SVC), Decision Tree (DT), ensemble Random Forest (eRF), and Gaussian Naive Bayes (GN) are considered and evaluated based on the different validation metrics. The empirical results show that the RF technique performs better than the other standard classification techniques for COVID-19 disease prediction with 95.13% accuracy.
4.1. Experimental dataset
The performance of the proposed model is tested with a synthetic COVID-19 dataset, which is created based on the real-time clinical data of 100 patients. The ranges of vital signs and other chronic symptoms of patients [32], [33], [34] were collected and validated under the guidance of a medical expert from the government Stanley Medical College (SMC)6 , Chennai. To prepare a synthetic dataset for validating the proposed model, the individual vital signs are injected into a Scikit-learn tool to generate a large dataset for COVID-19 disease risks prediction. This dataset consists of two types of data including MSD that contains 2000 samples with five features, PMRs which contains 2000 samples with fifteen features and also labeled with a number, i.e.1 (present) or 0 (absent) to indicate the disease status of the patients. Finally, the numerical dataset is evaluated with standard classification models in two different ways: (1) before applying data fusion and feature selection techniques, (2) after applying data fusion and feature selection techniques. The feature descriptions and properties of the COVID-19 synthetic dataset is shown in Table 1 .
Table 1.
Feature descriptions and their properties of the COVID-19 datasets.
| Medical Sensors Data (MSD) | ||||
|---|---|---|---|---|
| Feature Label | Feature Name | Description | Data Range | Data Type |
| F1 | Body Temperature (BT) | Body temperature of the patient in Celsius (36.4=normal; (36.6–37.5)-moderate; ( 38)=sever) | 36–40 F | Numeric |
| F2 | Oxygen Saturation Rate (OSR) | Level of blood oxygen saturation in mm Hg (from 95 to 100=normal; 80-95-critical; 65–80=emergency) | 65–100% | Numeric |
| F3 | Respiration Rate (RR) | The respiration rate of patient in bpm ((from 8 to 25=normal; 26–35 = critical; >35=emergency) | 8–40 Breaths per Minute | Numeric |
| F4 | Heart Rate (HR) | Variability of heart rate ranges in bpm (from 50 to 110=normal; 111–130=critical; >130=emergency) | 50–140 Beats per Minute | Numeric |
| F5 | Blood Pressure (BP) | Systolic pressure of circulating blood is measured in mmHg (less than 120=normal; 120–130=critical; 130–180=emergency) | 60–160 mmHG | Numeric |
| Previous Medical Records (PMRs) | ||||
| Feature Label | Feature Name | Description (0 represents absent and 1 represents present) | Data Range | Data Type |
| F6 | Patient ID (PID) | Identity number of a patient | 1–2000 | Numeric |
| F7 | Gender (GEN) | Gender of the patient (1= male; 0=female) | 0, 1 | Binary |
| F8 | Age (AGE) | Age of a patient | 5–90 | Numeric |
| F9 | Heart Diseases (HD) | Heart disease history of the patient | 0, 1 | Binary |
| F10 | Asthma (AST) | History of asthma | 0, 1 | Binary |
| F11 | Sugar (SUG) | The chronic blood sugar level of patient | 0, 1 | Binary |
| F12 | Bronchitis (BRO) | Past symptoms of acute bronchitis | 0, 1 | Binary |
| F13 | Chronic Kidney Disease (CKD) | Medical history of chronic kidney disease affected patient | 0, 1 | Binary |
| F14 | Lung Cancer (LC) | Past archives of lung cancer affected patient | 0, 1 | Binary |
| F15 | Pneumonia (PNE) | Historical symptoms of pneumonia | 0, 1 | Binary |
| F16 | Pregnant Women (PW) | Pregnancy status of the patient | 0, 1 | Binary |
| F17 | Emphysema (EMP) | Medical records of emphysema affected patient | 0, 1 | Binary |
| F18 | Taste and Smell Disorders (TSD) | Old report of a patient who has taste and smell disorder | 0, 1 | Binary |
| F19 | Viral Infection in Tonsils (VIT) | Historical record of viral infection of patient | 0, 1 | Binary |
| F20 | Neurological Disorders (ND) | Historical record of neurological disorder patient | 0, 1 | Binary |
4.2. Validation metrics
This section presents different validation metrics, which are used for evaluating the classification models. Different validation metrics including accuracy, precision, recall, mean absolute error (MAE), and root mean square error (RMSE) are considered to find out the effectiveness of the standard classification techniques for COVID-19 disease prediction. Likewise, the accuracy of all the models is computed concerning the train and test dataset.
Accuracy: Accuracy is an intuitive metric, primarily used to evaluate the prediction ability of the classification models. It is measured as the ratio of the number of correct predictions to the total number of predictions made for a given dataset as shown in Eq. (10).
| (10) |
Also, the accuracy of the classification models is evaluated based on the true negative (TN) and true positive (TP), which can predict the presence or absence of COVID-19 disease. Further, the false negative (FN) and false positive (FP) are used to identify the false predictions generated by the classification models. Thus, the newly derived accuracy formulation with TP, TN, FP, and FN is defined as follows.
| (11) |
Where and denote the number of TP, TN, FP, and FN, respectively.
Precision: Precision is defined as the ratio of the correctly predicted TP observations to the total predicted positive (TPP) observations . The formula of can be expressed as follows.
| (12) |
Where TPP observation is defined as ( represents the number of FP).
Recall: Recall is defined as the ratio of true positive (TP) observations to all the observations in actual class (AAP) . It can be mathematically expressed as follows.
| (13) |
Where AAP observation is defined as ( represents the number of FN).
Mean Absolute Error (MAE): The MAE parameter is represented as an error metric in the model evaluation process, which is defined as the average value of all the absolute errors. Absolute error is represented as the difference between all the actual values and predicted values. It is obtained by dividing the sum of all the absolute errors by the number of observations . The MAE metric is defined as follows.
| (14) |
Root Mean Squared Error (RMSE): The RMSE parameter is represented as the square root of the mean squared error values. It measures the differences between the actual values and the predicted values by dividing the number of observations . The RMSE metric is defined as follows.
| (15) |
4.3. Validation results of instant decision making
Due to the lack of instant risk prediction models and detailed analysis on COVID-19 disease, the proposed iCovidCare model aims to experimentally validate the instant decision-making model with varying body temperature values of the patients and makes instant decisions at the local edge device with minimum delay. The efficacy of the proposed model is validated and compared with other existing rule-based classification models [35], [36], [37], as depicted in Fig. 5 . From the analysis, it is noted that the predicted success ratio of the instant decision-making model is linearly increased with respect to the total number of patients. Further, the proposed model enhanced the predicted success ratio by 89%, as compared with existing rule-based classification models.
Fig. 5.

Success Ratio of Instant Disease making at edge devices.
4.4. Empirical results and analysis
In this section, we discuss the empirical results and analysis of the iCovidCare model with various standard classification techniques. First, we discuss feature analysis of the synthetic dataset to show the most significant features, which need to be used for further experimental evaluation. Further, we compare the eRF classification technique with four standard classification techniques including Linear Regression (LR), Support Vector Clustering (SVC), Decision Tree (DT), and Gaussian Naive Bayes (GN) with various validation matrices such as accuracy, precision, recall, RMSE, MAE, and training time.
4.4.1. Feature analysis
The system accuracy of a model depends on the selection of the optimal number of features set. Thus, to provide an analytical model, we have used a Correlation-based Feature Selection strategy to assess the important feature of the COVID-19 dataset, as shown in Fig. 6 . The main objective behind the feature selection is to predict features that are more crucial for COVID-19 disease prediction. The attribute analysis shows some interesting results such as a negative correlation between body temperature and patients age. Likewise, the relationship between other features can also be depicted in Fig. 6.
Fig. 6.

Relative features of COVID-19 dataset using correlation matrix.
Before data fusion, the various number of features need to be selected to depict the best feature set for COVID-19 disease prediction. In this experiment, a unique weight is assigned to each feature that splits the feature values into 8, 12, 16, and 20, respectively. The accuracy of various classification models before fusion is calculated based on the set of selected features, as depicted in Fig. 7 . From the results, it is evident that all classification models with 20 features achieved a better accuracy rate than the other feature sets. Moreover, the analysis result before data fusion indicates that the eRF technique performs better with 20 features set as compared with other classification models.
Fig. 7.

Accuracy of various classification models without features selection.
The accuracy rate of various classification models over after fusion COVID-19 dataset with the most significant number of features is depicted in Fig. 8 . From this analysis, it is observed that the accuracy of each classification model is much improved after applying data fusion, data fusion, and feature selection strategies. All classifiers for a set containing 20 features that improved the accuracy rate instead of other feature sets. However, the eRF classification model with 20 feature sets remain achieves better results than all other feature sets.
Fig. 8.

Accuracy of various classification models with features selection.
Table 2 summarizes the estimated accuracy of all classification models according to the feature sets. The eRF technique achieves 67.1% accuracy, which is better than other classification models before applying the data fusion strategy. However, the result is different when considering only the most significant features from the COVID-19 dataset after the data fusion strategy. In this case, the accuracy rate of the eRF classifier achieves 75.9% accuracy, which is higher than other classification models and before the data fusion technique. The achieved results show that the eRF classification model can able to predict the COVID-19 disease by ingesting enough features. Furthermore, the experimental results also indicate that the data fusion and feature selection methods can significantly improve the COVID-19 disease predictions as well as the accuracy rates of all classification models in terms of the large dimensional dataset with more features.
Table 2.
Accuracy results of various classification models before and after data fusion.
| No of features | Before Fusion |
After Fusion |
|||||||||
|---|---|---|---|---|---|---|---|---|---|---|---|
| LR | SVC | DT | eRF | GN | LR | SVC | DT | eRF | GN | ||
| 8 | Accuracy | 0.4167 | 0.5026 | 0.5278 | 0.5628 | 0.5415 | 0.4902 | 0.5347 | 0.5358 | 0.6003 | 0.55406 |
| 12 | 0.4501 | 0.5393 | 0.5646 | 0.5976 | 0.5493 | 0.5275 | 0.5709 | 0.6473 | 0.6741 | 0.5737 | |
| 16 | 0.5165 | 0.6092 | 0.5381 | 0.6409 | 0.5962 | 0.5914 | 0.6332 | 0.6814 | 0.6967 | 0.6623 | |
| 20 | 0.5606 | 0.6297 | 0.6563 | 0.6714 | 0.6371 | 0.6385 | 0.6881 | 0.7064 | 0.7593 | 0.6986 | |
4.4.2. Validation result analysis
The validation results for the proposed iCovidCare model with eRF classification technique and the standard four classification models based on the feature selection approach is shown in Table 3 , which presents the accuracy, precision, recall, MAE, and RMSE of the classification models. We applied the eRF classification model and the standard classification models before and after the proposed data fusion and feature selection strategy. The accuracy achieved by the eRF classification model was compared with the standard classification models to evaluate the performance of the proposed iCovidcare model with a feature selection strategy. Before feature selection, the proposed eRF and the DT classification model obtained higher accuracy, however, other classification models obtained lower accuracy. Moreover, MAE and RMSE of both eRF and SVC classification models are very less as compared with other classification models. The obtained results suggested that the COVID-19 dataset without data fusion does not provide higher accuracy results for all classification models. Besides that, the dataset is trained using a randomly selected set of features, which decreases the accuracy of all prediction models as well as increases the error rates. The validation results of the proposed eRF model and the standard classification models over various performance matrices without fusion strategy are shown in Fig. 9 .
Table 3.
Validation results of various classification models before and after data fusion.
| Validation Metrics | Before Fusion |
After Fusion |
||||||||
|---|---|---|---|---|---|---|---|---|---|---|
| LR | SVC | DT | eRF | GN | LR | SVC | DT | eRF | GN | |
| Training Accuracy | 0.5629 | 0.5931 | 0.6252 | 0.7641 | 0.6056 | 0.6486 | 0.6225 | 0.8642 | 0.9513 | 0.7631 |
| Test Accuracy | 0.5933 | 0.6381 | 0.6473 | 0.6986 | 0.6267 | 0.7102 | 0.6814 | 0.7928 | 0.9168 | 0.8025 |
| Precision | 0.6267 | 0.6179 | 0.7019 | 0.7327 | 0.6539 | 0.6963 | 0.7015 | 0.8239 | 0.8821 | 0.8323 |
| Recall | 0.5898 | 0.7073 | 0.7263 | 0.7705 | 0.6822 | 0.6687 | 0.7432 | 0.8512 | 0.8975 | 0.7516 |
| RMSE | 0.4912 | 0.4536 | 0.5498 | 0.4132 | 0.4226 | 0.4372 | 0.3643 | 0.4758 | 0.3481 | 0.3529 |
| MAE | 0.3425 | 0.3503 | 0.2978 | 0.2315 | 0.2931 | 0.2763 | 0.2307 | 0.2582 | 0.2096 | 0.2459 |
Fig. 9.

Validation results of classifiers with no feature selection.
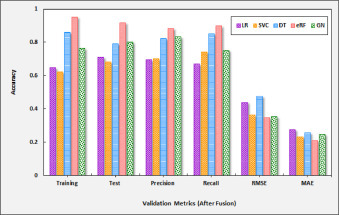
The accuracy of the standard classification models largely increased after applying the proposed data fusion and feature selection strategy. From Table 3, it is observed that the accuracy of the proposed eRF model is increased, whereas the RMSE and MAE values are decreased as compared to other classification models. After applying the proposed data fusion and feature selection strategy, the accuracy result of the DT and eRF models are greatly increased, i.e. 86.4% and 95.1%, respectively. However, the DT model fails to provide better accuracy as compared to the proposed eRF model, which is 8.9% less than the eRF model. The validation results of the proposed eRF model and the standard classification models over various performance matrices are shown in Fig. 10 . From Fig. 10, it is observed that the values of accuracy, precision, and recall parameters show higher variations in eRF, whereas other classification models provide fewer variations for the same metrics after data fusion and feature selection strategy. Thus, during experimental analysis, we have observed that the proposed data fusion and feature selection strategy helps to extract the most crucial information from the COVID-19 dataset, eliminate the noise by removing the irrelevant features, and reduce the dimensionality and complexity of the dataset. Besides that, we also observed that the proposed RF model and the standard classification models with feature selection strategy can accurately predict the COVID-19 disease with a limited number of features.
Fig. 10.
Validation results of classifiers with feature selection.
4.4.3. Training time analysis
During training time analysis, we report the training time of the proposed eRF model and the standard classification models with an increasing number of estimators for the most significant features from the dataset. Fig. 11 depicts the training time of various classification models, which is estimated based on the selection of the most significant features from the COVID-19 dataset. During analysis, it is also observed that the training time increases with the increase in the number of available features on the dataset. From Fig. 11, it is observed that the training time for both LR and DT classification models are higher, i.e. 0.39 and 0.31, respectively when the set of optimal number of features is maximum, i.e. 20. However, for the same set of features, the training time of SVC, eRF, and GN classification models is less, i.e. 0.20, 0.27, and 0.22, respectively as compared with LR and DT models.
Fig. 11.

Training time of various classification models.
In summary, we can conclude that the proposed iCovidCare model with ensemble RF classification technique provides considerably better solutions in terms of accuracy, precision, recall, MAE, and RMSE parameters and predicts the COVID-19 diseases more accurately with 20 features set. However, the proposed eRF model requires more computational effort for training the dataset as compared to the SVC and GN classification model due to inherent higher complexity.
5. Conclusion
In this paper, we presented an intelligent health monitoring and prediction model, namely the iCovidCare model, using data fusion, feature selection, and eRF classification model in edge networks to improve the accuracy of COVID-19 disease prediction. To the best of our knowledge, COVID-19 disease prediction using feature selection and ensemble RF classification model in edge networks is a novel solution. The major contributions of the proposed iCovidCare model are two folded. Firstly, an instant decision has been taken by the local edge devices based on the temperature sensor data using a rule-based approach. Secondly, in the cloud servers, a data fusion and feature selection strategy has been applied to combine the extracted features from the MSD and the PMRs for generating valuable healthcare data. Besides that, several data prepossessing techniques have been applied to eliminate irrelevant and redundant data and select important ones without noise. Finally, eRF classification model is used to train the proposed iCovidCare model for the COVID-19 disease prediction. The proposed model is evaluated with a synthetic COVID-19 dataset and compared with the traditional classification models based on various performance metrics to show its effectiveness. The eRF classification model for iCovidCare has achieved 95.13% accuracy, which is higher than the standard classification models.
In the future, the performance of the data fusion strategy will be enhanced by applying different data mining techniques to generate a more refined dataset for COVID-19 disease prediction. Further, we will apply the ensemble deep learning model for COVID-19 disease prediction and prepare an ontology-aware recommendation system.
Declaration of Competing Interest
The authors declare that they have no known competing financial interests or personal relationships that could have appeared to influence the work reported in this paper.
Acknowledgment
We would like to express our special thanks to Dr. S. Sujatha (Government Stanley Medical College (SMC), Chennai, India) for her assistance and guidance in clinical data collection and validation. We also thank Dr. D. Sridharan (Professor, Anna University, Chennai, India,) for his timely support and help to get the vital signs information.
Footnotes
References
- 1.Rogers J.P., Chesney E., Oliver D., Pollak T.A., McGuire P., Fusar-Poli P., Zandi M.S., Lewis G., David A.S. Psychiatric and neuropsychiatric presentations associated with severe coronavirus infections: a systematic review and meta-analysis with comparison to the COVID-19 pandemic. Lancet Psychiatry. 2020 doi: 10.1016/S2215-0366(20)30203-0. [DOI] [PMC free article] [PubMed] [Google Scholar]
- 2.Peiris J., Lai S., Poon L., Guan Y., Yam L., Lim W., Nicholls J., Yee W., Yan W., Cheung M., et al. Coronavirus as a possible cause of severe acute respiratory syndrome. Lancet. 2003;361(9366):1319–1325. doi: 10.1016/S0140-6736(03)13077-2. [DOI] [PMC free article] [PubMed] [Google Scholar]
- 3.H.S. Maghdid, A.T. Asaad, K.Z. Ghafoor, A.S. Sadiq, M.K. Khan, Diagnosing COVID-19 pneumonia from X-ray and CT images using deep learning and transfer learning algorithms, arXiv preprint arXiv:2004.00038(2020).
- 4.W.H. Organization, et al., Novel coronavirus (2019-ncov): situation report, 3 (2020).
- 5.Yao H., Chen J.-H., Xu Y.-F. Rethinking online mental health services in china during the COVID-19 epidemic. Asian J. Psychiatry. 2020;50:1–2. doi: 10.1016/j.ajp.2020.102015. [DOI] [PMC free article] [PubMed] [Google Scholar]
- 6.Roosa K., Lee Y., Luo R., Kirpich A., Rothenberg R., Hyman J., Yan P., Chowell G. Real-time forecasts of the COVID-19 epidemic in China from february 5th to february 24th, 2020. Infect. Dis. Model. 2020;5:256–263. doi: 10.1016/j.idm.2020.02.002. [DOI] [PMC free article] [PubMed] [Google Scholar]
- 7.Hassen H.B., Ayari N., Hamdi B. A home hospitalization system based on the Internet of Things, fog computing and cloud computing. Inform. Med. Unlocked. 2020;20:100368. doi: 10.1016/j.imu.2020.100368. [DOI] [PMC free article] [PubMed] [Google Scholar]
- 8.Taiwo O., Ezugwu A.E. Smart healthcare support for remote patient monitoring during COVID-19 quarantine. Inform. Med. Unlocked. 2020;20:100428. doi: 10.1016/j.imu.2020.100428. [DOI] [PMC free article] [PubMed] [Google Scholar]
- 9.Meng T., Jing X., Yan Z., Pedrycz W. A survey on machine learning for data fusion. Inf. Fusion. 2020;57:115–129. [Google Scholar]
- 10.Nweke H.F., Teh Y.W., Mujtaba G., Al-Garadi M.A. Data fusion and multiple classifier systems for human activity detection and health monitoring: review and open research directions. Inf. Fusion. 2019;46:147–170. [Google Scholar]
- 11.Jonnagaddala J., Liaw S.-T., Ray P., Kumar M., Chang N.-W., Dai H.-J. Coronary artery disease risk assessment from unstructured electronic health records using text mining. J. Biomed. Inform. 2015;58:S203–S210. doi: 10.1016/j.jbi.2015.08.003. [DOI] [PMC free article] [PubMed] [Google Scholar]
- 12.Jain D., Singh V. Feature selection and classification systems for chronic disease prediction: a review. Egypt. Inform. J. 2018;19(3):179–189. [Google Scholar]
- 13.Ahmed H., Younis E.M., Hendawi A., Ali A.A. Heart disease identification from patients social posts, machine learning solution on spark. Future Gener. Comput. Syst. 2020;111:714–722. [Google Scholar]
- 14.Garate-Escamilla A.K., Hassani A.H.E., Andres E. Classification models for heart disease prediction using feature selection and PCA. Inform. Med. Unlocked. 2020:1–11. [Google Scholar]
- 15.Binkhonain M., Zhao L. A review of machine learning algorithms for identification and classification of non-functional requirements. Expert Syst. Appl. X. 2019;1:1–13. [Google Scholar]
- 16.Uddin S., Khan A., Hossain M.E., Moni M.A. Comparing different supervised machine learning algorithms for disease prediction. BMC Med. Inform. Decis. Mak. 2019;19(1):1–16. doi: 10.1186/s12911-019-1004-8. [DOI] [PMC free article] [PubMed] [Google Scholar]
- 17.Abbas S.A., Rehman A.U., Majeed F., Majid A., Malik M.S.A., Kazmi Z.H., Zafar S. Performance analysis of classification algorithms on birth dataset. IEEE Access. 2020;8:102146–102154. [Google Scholar]
- 18.Sen P.C., Hajra M., Ghosh M. Emerging Technology in Modelling and Graphics. Springer; 2020. Supervised classification algorithms in machine learning: a survey and review; pp. 99–111. [Google Scholar]
- 19.Abdar M., Zomorodi-Moghadam M., Das R., Ting I.-H. Performance analysis of classification algorithms on early detection of liver disease. Expert Syst. Appl. 2017;67:239–251. [Google Scholar]
- 20.Dogan N., Tanrikulu Z. A comparative analysis of classification algorithms in data mining for accuracy, speed and robustness. Inf. Technol. Manag. 2013;14(2):105–124. [Google Scholar]
- 21.AlJame M., Ahmad I., Imtiaz A., Mohammed A. Ensemble learning model for diagnosing COVID-19 from routine blood tests. Inform. Med. Unlocked. 2020;21:100449. doi: 10.1016/j.imu.2020.100449. [DOI] [PMC free article] [PubMed] [Google Scholar]
- 22.S. Aktar, M. Ahamad, M. Rashed-Al-Mahfuz, A. Azad, S. Uddin, A. Kamal, S.A. Alyami, P.-I. Lin, S.M.S. Islam, J.M. Quinn, et al., Predicting patient COVID-19 disease severity by means of statistical and machine learning analysis of blood cell transcriptome data, arXiv preprint arXiv:2011.10657(2020).
- 23.Muhammad L., Algehyne E.A., Usman S.S., Ahmad A., Chakraborty C., Mohammed I. Supervised machine learning models for prediction of COVID-19 infection using epidemiology dataset. SN Comput. Sci. 2021;2(1):1–13. doi: 10.1007/s42979-020-00394-7. [DOI] [PMC free article] [PubMed] [Google Scholar]
- 24.Alam M.Z., Rahman M.S., Rahman M.S. A random forest based predictor for medical data classification using feature ranking. Inform. Med. Unlocked. 2019;15:1–12. [Google Scholar]
- 25.Li R., Shen S., Zhang X., Li R., Wang S., Zhou B., Wang Z. Proceedings of the International Conference on Healthcare Science and Engineering. Springer; 2018. Cardiovascular disease risk prediction based on random forest; pp. 31–43. [Google Scholar]
- 26.Iwendi C., Bashir A.K., Peshkar A., Sujatha R., Chatterjee J.M., Pasupuleti S., Mishra R., Pillai S., Jo O. COVID-19 patient health prediction using boosted random forest algorithm. Front. Public Health. 2020;8:1–9. doi: 10.3389/fpubh.2020.00357. [DOI] [PMC free article] [PubMed] [Google Scholar]
- 27.Muhammad L., Islam M.M., Sharif U.S., Ayon S.I. Predictive data mining models for novel coronavirus (COVID-19) infected patients recovery. SN Comput. Sci. 2020;206:1–7. doi: 10.1007/s42979-020-00216-w. [DOI] [PMC free article] [PubMed] [Google Scholar]
- 28.Din S., Paul A. Smart health monitoring and management system: toward autonomous wearable sensing for internet of things using big data analytics. Future Gener. Comput. Syst. 2019;91:611–619. [Google Scholar]
- 29.Paul A.K., Shill P.C., Rabin M.R.I., Murase K. Adaptive weighted fuzzy rule-based system for the risk level assessment of heart disease. Appl. Intell. 2018;48(7):1739–1756. [Google Scholar]
- 30.Narayan S., Sathiyamoorthy E. A novel recommender system based on FFT with machine learning for predicting and identifying heart diseases. Neural Comput. Appl. 2019;31(1):93–102. [Google Scholar]
- 31.Kabir W., Ahmad M.O., Swamy M. Normalization and weighting techniques based on genuine-impostor score fusion in multi-biometric systems. IEEE Trans. Inf. Forensics Secur. 2018;13(8):1989–2000. [Google Scholar]
- 32.Petrilli C.M., Jones S.A., Yang J., Rajagopalan H., ODonnell L., Chernyak Y., Tobin K.A., Cerfolio R.J., Francois F., Horwitz L.I. Factors associated with hospital admission and critical illness among 5279 people with coronavirus disease 2019 in New York city: prospective cohort study. BMJ. 2020;369 doi: 10.1136/bmj.m1966. [DOI] [PMC free article] [PubMed] [Google Scholar]
- 33.Tharakan S., Nomoto K., Miyashita S., Ishikawa K. Body temperature correlates with mortality in COVID-19 patients. Crit. Care. 2020;24(1):298. doi: 10.1186/s13054-020-03045-8. [DOI] [PMC free article] [PubMed] [Google Scholar]
- 34.Liu F.-Y., Sun X.-L., Zhang Y., Ge L., Wang J., Liang X., Li J.-F., Wang C.-L., Xing Z.-T., Chhetri J.K., et al. Evaluation of the risk prediction tools for patients with coronavirus disease 2019 in Wuhan, China: a single-centered, retrospective, observational study. Crit. Care Med. 2020 doi: 10.1097/CCM.0000000000004549. [DOI] [PMC free article] [PubMed] [Google Scholar]
- 35.Virgeniya S., Ramaraj E. Predictive analytics using rule based classification and hybrid logistic regression(hlr) algorithm for decision making. Int. J. Sci. Technol. Res. 2019;8:1509–1513. [Google Scholar]
- 36.Kumar Y., Sahoo G. Prediction of different types of liver diseases using rule based classification model. Technol. Health Care. 2013;21(5):417–432. doi: 10.3233/THC-130742. [DOI] [PubMed] [Google Scholar]
- 37.Christopher J. Proceedings of the 9th International Conference on Cloud Computing, Data Science Engineering (Confluence) 2019. The science of rule-based classifiers; pp. 299–303. [DOI] [Google Scholar]